Danvers, MA (Massachusetts) Houses and Residents
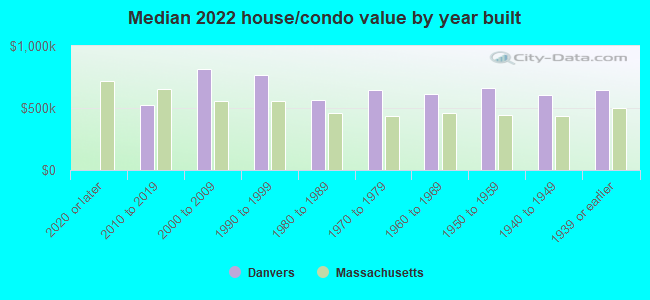
Estimated median house or condo value in 2022: $639,715 (it was $225,000 in 2000 )
Danvers:
$639,715Massachusetts:
$534,700
Lower value quartile - upper value quartile: $475,123 - $771,897Mean price in 2022: Detached houses: $686,058 Here:
$686,058State:
$651,570
Townhouses or other attached units: $534,911 Here:
$534,911State:
$617,749
In 2-unit structures: $515,669 Here:
$515,669State:
$594,808
In 3-to-4-unit structures: $439,424 Here:
$439,424State:
$601,912
In 5-or-more-unit structures: $323,465 Here:
$323,465State:
$555,768
Mobile homes: $79,812 Here:
$79,812State:
$170,209
Total population: 26,493 (Urban population: 25,212, Rural population: 0)
Houses: 11,666 (11,256 occupied: 7,913 owner occupied, 3,375 renter occupied )
% of renters here:
30%State:
38%
Housing density: 878 houses/condos per square mile
Median price asked for vacant for-sale houses and condos in 2022: $1,963,831.
Median contract rent in 2022: $1,911 (lower quartile is $1,433, upper quartile is over $2,000)
Median rent asked for vacant for-rent units in 2022: $4,996
Median gross rent in Danvers, MA in 2022: $1,996
Housing units in Danvers with a mortgage: 5,363 (858 second mortgage, 15 home equity loan, 763 both second mortgage and home equity loan )Houses without a mortgage: 142
Median household income for houses/condos with a mortgage: $147,930
Median household income for apartments without a mortgage: $83,343
Median monthly housing costs: $2,108
Data:
Median house or condo value ($)
Median house or condo value ($ change since 2000)
Median house or condo value ($) - White
Median house or condo value ($) - Black or African American
Median house or condo value ($) - Asian
Median house or condo value ($) - Hispanic or Latino
Median house or condo value ($) - American Indian and Alaska Native
Median house or condo value ($) - Multirace
Median house or condo value ($) - Other Race
Median price asked for mobile homes ($)
Household density (households per square mile)
Mean house or condo value by units in structure - 1, detached ($)
Mean house or condo value by units in structure - 1, attached ($)
Mean house or condo value by units in structure - 2 ($)
Mean house or condo value by units in structure by units in structure - 3 or 4 ($)
Mean house or condo value by units in structure - 5 or more ($)
Mean house or condo value by units in structure - Boat, RV, van, etc. ($)
Mean house or condo value by units in structure - Mobile home ($)
Median contract rent ($)
Median contract rent - Lower quartile ($)
Median contract rent - Upper quartile ($)
Median gross rent ($)
Urban houses (%)
Rural houses (%)
Houses occupied (%)
Houses occupied (% change since 2000)
Houses owner occupied (%)
Houses owner occupied (% change since 2000)
Houses renter occupied (%)
Houses renter occupied (% change since 2000)
Vacant housing units - For rent (%)
Vacant housing units - For rent (% change since 2000)
Vacant housing units - For sale only (%)
Vacant housing units - For sale only (% change since 2000)
Vacant housing units - Rented or sold, not occupied (%)
Vacant housing units - Rented or sold, not occupied (% change since 2000)
Vacant housing units - For seasonal, recreational, or occasional use (%)
Vacant housing units - For seasonal, recreational, or occasional use (% change since 2000)
Vacant housing units - For migrant workers (%)
Vacant housing units - For migrant workers (% change since 2000)
Vacant housing units - Other vacant (%)
Vacant housing units - Other vacant (% change since 2000)
Median monthly housing costs ($)
Median household income for houses/condos with a mortgage ($)
Median household income for houses/condos without a mortgage ($)
Median household income ($)
Median household income ($) - White
Median household income ($) - Black or African American
Median household income ($) - Asian
Median household income ($) - Hispanic or Latino
Median household income ($) - American Indian and Alaska Native
Median household income ($) - Multirace
Median household income ($) - Other Race
Mortgage status - with mortgage (%)
Mortgage status - with second mortgage (%)
Mortgage status - with home equity loan (%)
Mortgage status - with both second mortgage and home equity loan (%)
Mortgage status - without a mortgage (%)
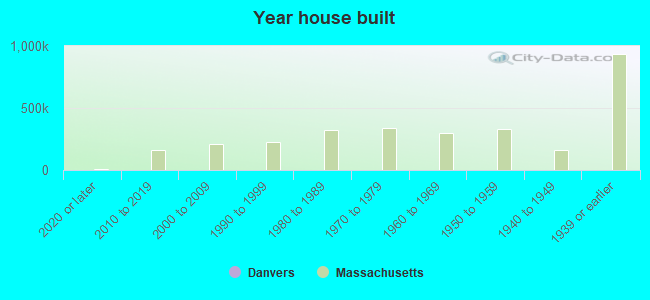
Median year house/condo built
Median year apartment built
Household type by relationship - Male householder living alone (%)
Household type by relationship - Male householder not living alone (%)
Household type by relationship - Female householder living alone (%)
Household type by relationship - Female householder not living alone (%)
Household type by relationship - Opposite-Sex spouse (%)
Household type by relationship - Same-Sex spouse (%)
Household type by relationship - Opposite-Sex unmarried partner (%)
Household type by relationship - Same-Sex unmarried partner (%)
Household type by relationship - In group quarters (%)
Size of family households - 2-person household (%)
Size of family households - 3-person household (%)
Size of family households - 4-person household (%)
Size of family households - 5-person household (%)
Size of family households - 6-person household (%)
Size of family households - 7-or-more-person household (%)
Size of nonfamily households - 1-person household (%)
Size of nonfamily households - 2-person household (%)
Size of nonfamily households - 3-person household (%)
Size of nonfamily households - 4-person household (%)
Size of nonfamily households - 5-person household (%)
Size of nonfamily households - 6-person household (%)
Size of nonfamily households - 7-or-moreperson household (%)
Year house built - Built 2010 or later (%)
Year house built - Built 2000 to 2009 (%)
Year house built - Built 1990 to 1999 (%)
Year house built - Built 1980 to 1989 (%)
Year house built - Built 1970 to 1979 (%)
Year house built - Built 1960 to 1969 (%)
Year house built - Built 1950 to 1959 (%)
Year house built - Built 1940 to 1949 (%)
Year house built - Built 1939 or earlier (%)
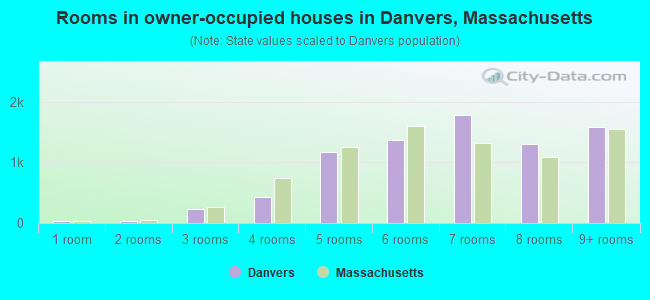
Median number of rooms in houses and condos
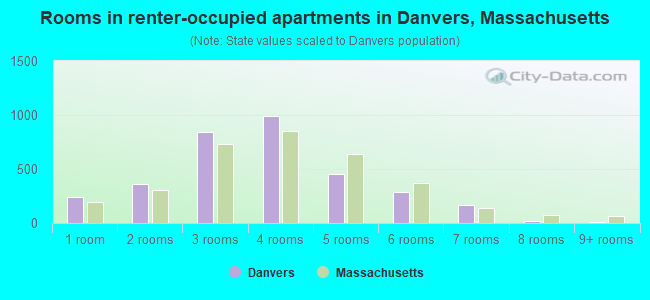
Median number of rooms in apartments
Median number of bedrooms in owner occupied houses
Mean number of bedrooms in owner occupied houses
Median number of bedrooms in renter occupied houses
Mean number of bedrooms in renter occupied houses
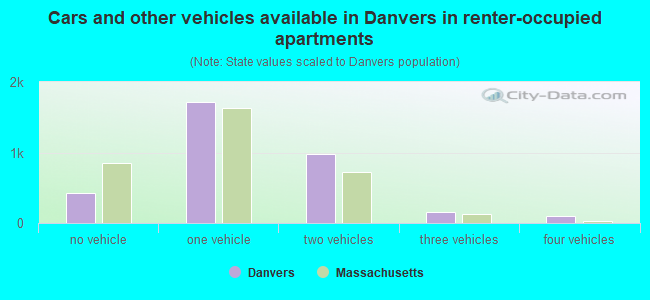
Median number of vehichles in owner occupied houses
Mean number of vehichles in owner occupied houses
Median number of vehichles in renter occupied houses
Mean number of vehichles in renter occupied houses
Rooms in owner-occupied houses - 1 room (%)
Rooms in owner-occupied houses - 2 rooms (%)
Rooms in owner-occupied houses - 3 rooms (%)
Rooms in owner-occupied houses - 4 rooms (%)
Rooms in owner-occupied houses - 5 rooms (%)
Rooms in owner-occupied houses - 6 rooms (%)
Rooms in owner-occupied houses - 7 rooms (%)
Rooms in owner-occupied houses - 8 rooms (%)
Rooms in owner-occupied houses - 9+ rooms (%)
Rooms in renter-occupied houses - 1 room (%)
Rooms in renter-occupied houses - 2 rooms (%)
Rooms in renter-occupied houses - 3 rooms (%)
Rooms in renter-occupied houses - 4 rooms (%)
Rooms in renter-occupied houses - 5 rooms (%)
Rooms in renter-occupied houses - 6 rooms (%)
Rooms in renter-occupied houses - 7 rooms (%)
Rooms in renter-occupied houses - 8 rooms (%)
Rooms in renter-occupied houses - 9+ rooms (%)
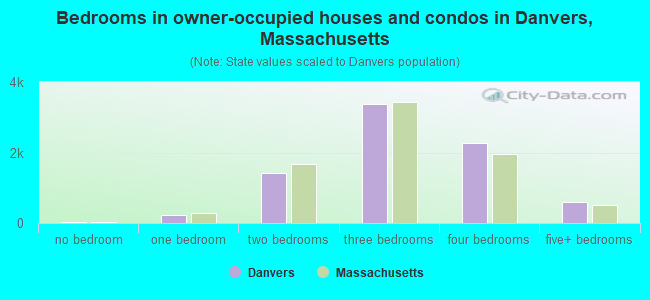
Bedrooms in owner-occupied houses - no bedrooms (%)
Bedrooms in owner-occupied houses - 1 bedroom (%)
Bedrooms in owner-occupied houses - 2 bedrooms (%)
Bedrooms in owner-occupied houses - 3 bedrooms (%)
Bedrooms in owner-occupied houses - 4 bedrooms (%)
Bedrooms in owner-occupied houses - 5+ bedrooms (%)
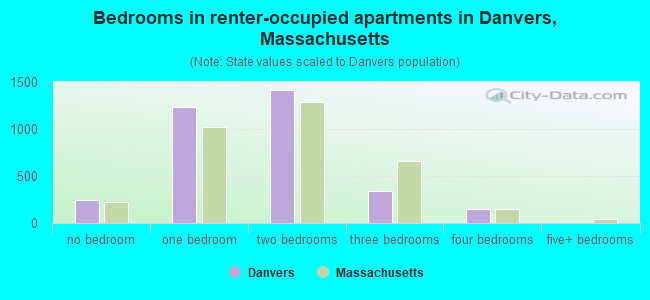
Bedrooms in renter-occupied houses - no bedrooms (%)
Bedrooms in renter-occupied houses - 1 bedroom (%)
Bedrooms in renter-occupied houses - 2 bedrooms (%)
Bedrooms in renter-occupied houses - 3 bedrooms (%)
Bedrooms in renter-occupied houses - 4 bedrooms (%)
Bedrooms in renter-occupied houses - 5+ bedrooms (%)
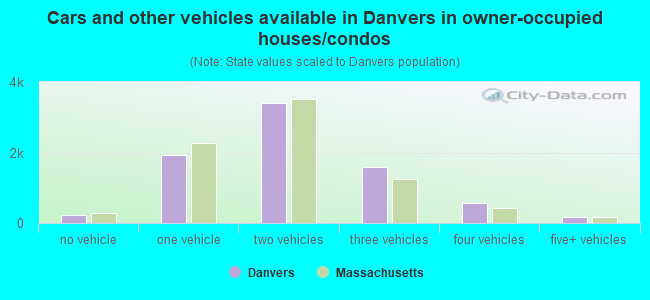
Vehicles available in owner-occupied houses - no vehicle available (%)
Vehicles available in owner-occupied houses - 1 vehicle available(%)
Vehicles available in owner-occupied houses - 2 Vehicles available (%)
Vehicles available in owner-occupied houses - 3 Vehicles available (%)
Vehicles available in owner-occupied houses - 4 Vehicles available (%)
Vehicles available in owner-occupied houses - 5+ Vehicles available (%)
Vehicles available in renter-occupied houses - no vehicle available (%)
Vehicles available in renter-occupied houses - 1 vehicle available (%)
Vehicles available in renter-occupied houses - 2 Vehicles available (%)
Vehicles available in renter-occupied houses - 3 Vehicles available (%)
Vehicles available in renter-occupied houses - 4 Vehicles available (%)
Vehicles available in renter-occupied houses - 5+ Vehicles available (%)
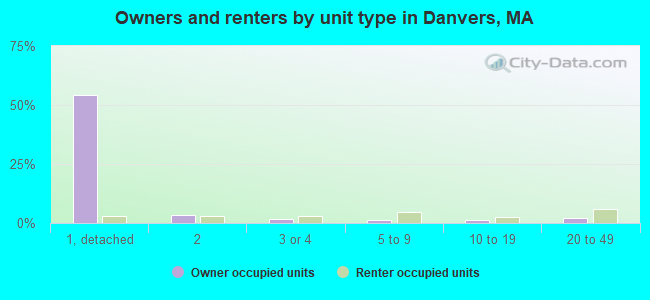
Housing units in structures - 1, detached (%)
Housing units in structures - 1, attached (%)
Housing units in structures - 2 (%)
Housing units in structures - 3 or 4 (%)
Housing units in structures - 5 to 9 (%)
Housing units in structures - 10 to 19 (%)
Housing units in structures - 20 to 49 (%)
Housing units in structures - 50 or more (%)
Housing units in structures - Mobile home (%)
Housing units in structures - Boat, RV, van, etc. (%)
Housing units in structures - Owners - 1, detached (%)
Housing units in structures - Owners - 1, attached (%)
Housing units in structures - Owners - 2 (%)
Housing units in structures - Owners - 3 or 4 (%)
Housing units in structures - Owners - 5 to 9 (%)
Housing units in structures - Owners - 10 to 19 (%)
Housing units in structures - Owners - 20 to 49 (%)
Housing units in structures - Owners - 50 or more (%)
Housing units in structures - Owners - Mobile home (%)
Housing units in structures - Owners - Boat, RV, van, etc. (%)
Housing units in structures - Renters - 1, detached (%)
Housing units in structures - Renters - 1, attached (%)
Housing units in structures - Renters - 2 (%)
Housing units in structures - Renters - 3 or 4 (%)
Housing units in structures - Renters - 5 to 9 (%)
Housing units in structures - Renters - 10 to 19 (%)
Housing units in structures - Renters - 20 to 49 (%)
Housing units in structures - Renters - 50 or more (%)
Housing units in structures - Renters - Mobile home (%)
Housing units in structures - Renters - Boat, RV, van, etc. (%)
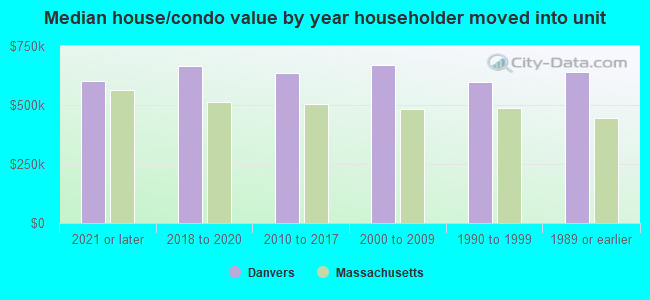
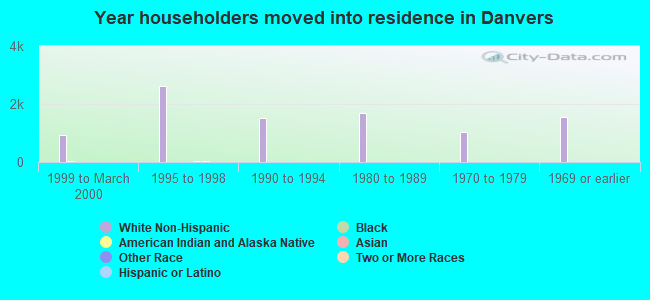
House/condo owner moved in on average (years ago)
Renter moved in on average (years ago)
Year householder moved into unit - Moved in 1999 to March 2000 (%)
Year householder moved into unit - Moved in 1999 to March 2000 (%) - White
Year householder moved into unit - Moved in 1999 to March 2000 (%) - Black or African American
Year householder moved into unit - Moved in 1999 to March 2000 (%) - Asian
Year householder moved into unit - Moved in 1999 to March 2000 (%) - Hispanic or Latino
Year householder moved into unit - Moved in 1999 to March 2000 (%) - American Indian and Alaska Native
Year householder moved into unit - Moved in 1999 to March 2000 (%) - Multirace
Year householder moved into unit - Moved in 1999 to March 2000 (%) - Other Race
Year householder moved into unit - Moved in 1995 to 1998 (%)
Year householder moved into unit - Moved in 1995 to 1998 (%) - White
Year householder moved into unit - Moved in 1995 to 1998 (%) - Black or African American
Year householder moved into unit - Moved in 1995 to 1998 (%) - Asian
Year householder moved into unit - Moved in 1995 to 1998 (%) - Hispanic or Latino
Year householder moved into unit - Moved in 1995 to 1998 (%) - American Indian and Alaska Native
Year householder moved into unit - Moved in 1995 to 1998 (%) - Multirace
Year householder moved into unit - Moved in 1995 to 1998 (%) - Other Race
Year householder moved into unit - Moved in 1990 to 1994 (%)
Year householder moved into unit - Moved in 1990 to 1994 (%) - White
Year householder moved into unit - Moved in 1990 to 1994 (%) - Black or African American
Year householder moved into unit - Moved in 1990 to 1994 (%) - Asian
Year householder moved into unit - Moved in 1990 to 1994 (%) - Hispanic or Latino
Year householder moved into unit - Moved in 1990 to 1994 (%) - American Indian and Alaska Native
Year householder moved into unit - Moved in 1990 to 1994 (%) - Multirace
Year householder moved into unit - Moved in 1990 to 1994 (%) - Other Race
Year householder moved into unit - Moved in 1980 to 1989 (%)
Year householder moved into unit - Moved in 1980 to 1989 (%) - White
Year householder moved into unit - Moved in 1980 to 1989 (%) - Black or African American
Year householder moved into unit - Moved in 1980 to 1989 (%) - Asian
Year householder moved into unit - Moved in 1980 to 1989 (%) - Hispanic or Latino
Year householder moved into unit - Moved in 1980 to 1989 (%) - American Indian and Alaska Native
Year householder moved into unit - Moved in 1980 to 1989 (%) - Multirace
Year householder moved into unit - Moved in 1980 to 1989 (%) - Other Race
Year householder moved into unit - Moved in 1970 to 1979 (%)
Year householder moved into unit - Moved in 1970 to 1979 (%) - White
Year householder moved into unit - Moved in 1970 to 1979 (%) - Black or African American
Year householder moved into unit - Moved in 1970 to 1979 (%) - Asian
Year householder moved into unit - Moved in 1970 to 1979 (%) - Hispanic or Latino
Year householder moved into unit - Moved in 1970 to 1979 (%) - American Indian and Alaska Native
Year householder moved into unit - Moved in 1970 to 1979 (%) - Multirace
Year householder moved into unit - Moved in 1970 to 1979 (%) - Other Race
Year householder moved into unit - Moved in 1969 or earlier (%)
Year householder moved into unit - Moved in 1969 or earlier (%) - White
Year householder moved into unit - Moved in 1969 or earlier (%) - Black or African American
Year householder moved into unit - Moved in 1969 or earlier (%) - Asian
Year householder moved into unit - Moved in 1969 or earlier (%) - Hispanic or Latino
Year householder moved into unit - Moved in 1969 or earlier (%) - American Indian and Alaska Native
Year householder moved into unit - Moved in 1969 or earlier (%) - Multirace
Year householder moved into unit - Moved in 1969 or earlier (%) - Other Race
Housing units lacking complete plumbing facilities (%)
Housing units lacking complete kitchen facilities (%)
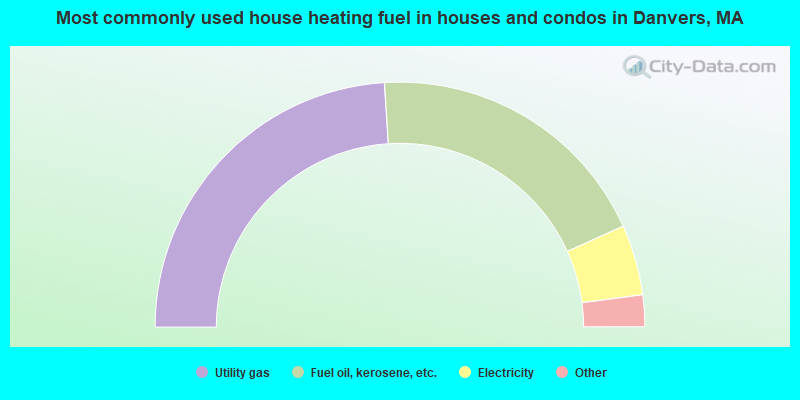
House heating fuel used in houses and condos - Utility gas (%)
House heating fuel used in houses and condos - Bottled, tank, or LP gas (%)
House heating fuel used in houses and condos - Electricity (%)
House heating fuel used in houses and condos - Fuel oil, kerosene, etc. (%)
House heating fuel used in houses and condos - Coal or coke (%)
House heating fuel used in houses and condos - Wood (%)
House heating fuel used in houses and condos - Solar energy (%)
House heating fuel used in houses and condos - Other fuel (%)
House heating fuel used in houses and condos - No fuel used (%)
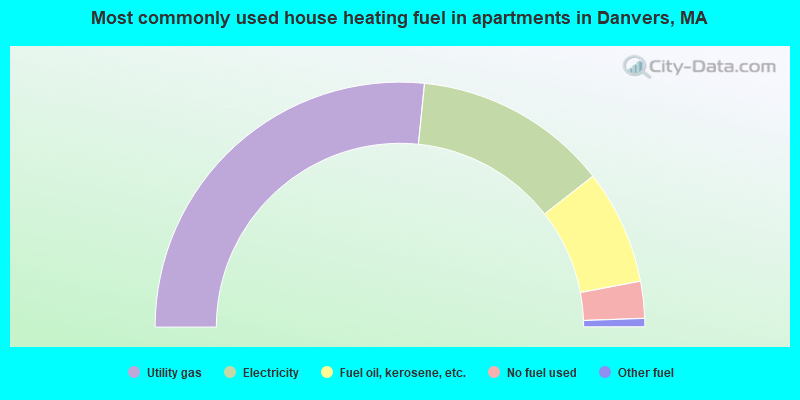
House heating fuel used in apartments - Utility gas (%)
House heating fuel used in apartments - Bottled, tank, or LP gas (%)
House heating fuel used in apartments - Electricity (%)
House heating fuel used in apartments - Fuel oil, kerosene, etc. (%)
House heating fuel used in apartments - Coal or coke (%)
House heating fuel used in apartments - Wood (%)
House heating fuel used in apartments - Solar energy (%)
House heating fuel used in apartments - Other fuel (%)
House heating fuel used in apartments - No fuel used (%)
Latest news about housing in Danvers, MA collected exclusively by city-data.com from local newspapers, TV, and radio stations
Median year house/condo built: 1961Median year apartment built: 1976Household type by relationship:
Households: 27,932
Male householders: 5,007 (1,099 living alone ), Female householders: 6,149 (1,940 living alone )6,015 spouses (5,948 opposite-sex spouses ), 747 unmarried partners , (738 opposite-sex unmarried partners ), 7,220 children (6,647 natural , 443 adopted , 130 stepchildren ), 250 grandchildren , 260 brothers or sisters , 362 parents , 32 foster children , 558 other relatives , 498 non-relatives In group quarters: 830
Size of family households: 3,263 2-persons , 1,685 3-persons , 1,466 4-persons , 519 5-persons , 220 6-persons , 83 7-or-more-persons .
Size of nonfamily households: 3,276 1-person , 676 2-persons , 67 3-persons .
3,538 married couples with children. single-parent households (166 men , 620 women ).
86.7% of residents of Danvers speak English at home. of residents speak Spanish at home (69% speak English very well , 10% speak English well , 16% speak English not well , 5% don't speak English at all ).of residents speak other Indo-European language at home (68% speak English very well , 19% speak English well , 11% speak English not well , 3% don't speak English at all ).of residents speak Asian or Pacific Island language at home (71% speak English very well , 8% speak English well , 21% speak English not well ).of residents speak other language at home (74% speak English very well , 5% speak English well , 21% speak English not well ).
Foreign born population: 2,736 (9.8%)of them are naturalized citizens )
Median number of rooms in houses and condos:
Median number of rooms in apartments
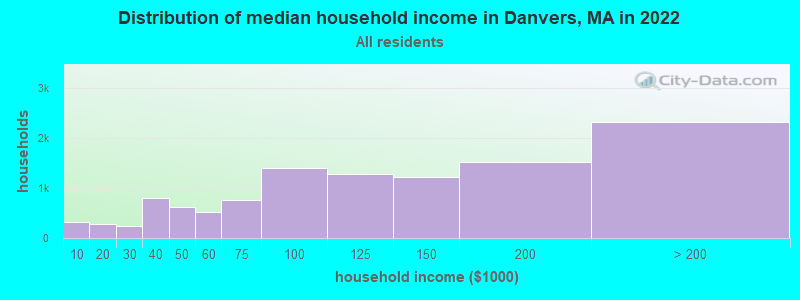
Danvers, MA household income distribution 326 Less than $10,000276 $10,000 to $19,999250 $20,000 to $29,999792 $30,000 to $39,999620 $40,000 to $49,999517 $50,000 to $59,999754 $60,000 to $74,9991,405 $75,000 to $99,9991,277 $100,000 to $124,9991,218 $125,000 to $149,9991,529 $150,000 to $199,9992,320 $200,000 or more
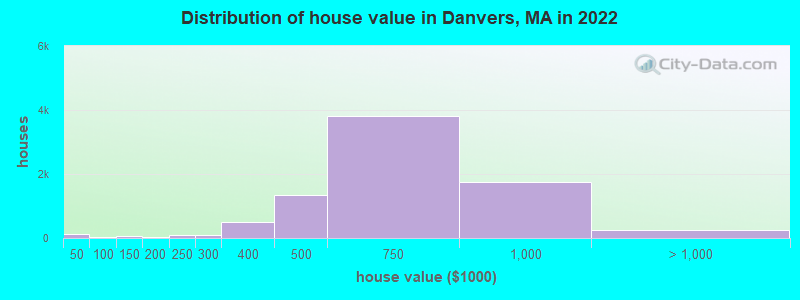
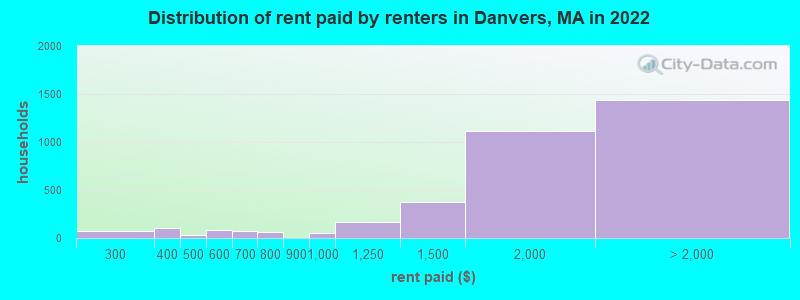
Home value of owner - occupied houses in 2022 in Danvers, MA 90 Less than $10,00011 $10,000 to $14,9993 $30,000 to $34,99910 $35,000 to $39,99912 $40,000 to $49,99915 $50,000 to $59,9991 $80,000 to $89,99965 $100,000 to $124,99917 $150,000 to $174,99923 $175,000 to $199,99982 $200,000 to $249,99982 $250,000 to $299,999515 $300,000 to $399,9991,343 $400,000 to $499,9993,824 $500,000 to $749,9991,764 $750,000 to $999,999130 $1,000,000 to $1,499,99980 $1,500,000 to $1,999,99936 $2,000,000 or moreRent paid by renters in 2022 in Danvers, MA 58 $200 to $24919 $250 to $29969 $300 to $34934 $350 to $39912 $400 to $44915 $450 to $49969 $500 to $54910 $550 to $59937 $600 to $64939 $650 to $69918 $700 to $74946 $750 to $79956 $900 to $999165 $1,000 to $1,249374 $1,250 to $1,4991,117 $1,500 to $1,999958 $2,000 to $2,499254 $2,500 to $2,99931 $3,000 to $3,499101 $3,500 or more90 No cash rent
Percentage of workers working in this county: 71.8%Number of people working at home: 3,569 (22.3% of all workers )
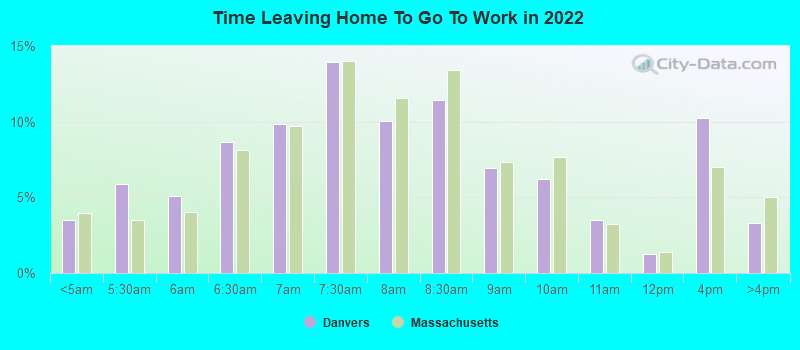
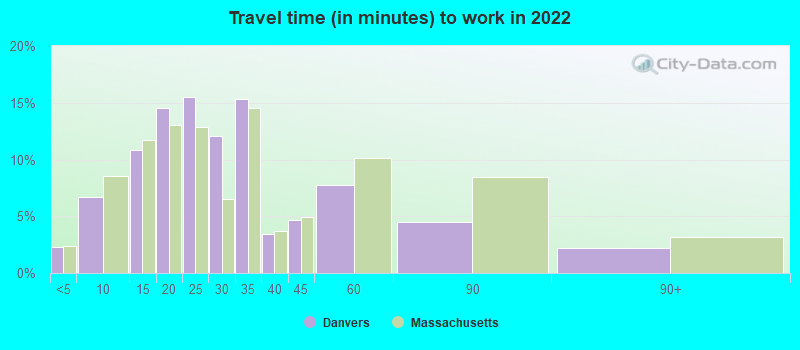
Travel time to work (commute)
Less than 5 minutes: 6435 to 9 minutes: 1,19110 to 14 minutes: 1,57215 to 19 minutes: 1,88920 to 24 minutes: 1,46525 to 29 minutes: 80930 to 34 minutes: 1,96135 to 39 minutes: 36240 to 44 minutes: 30345 to 59 minutes: 1,16060 to 89 minutes: 94490 or more minutes: 393
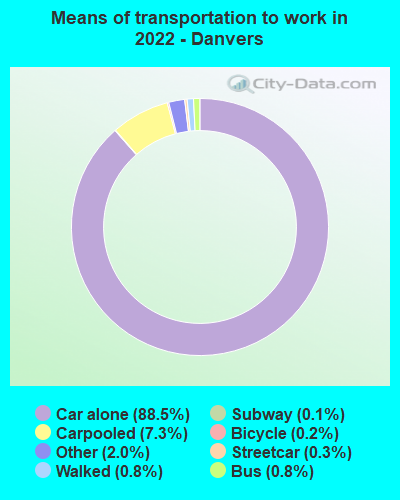
Means of transportation to work:
Drove a car alone: 17,953 (75.1%)Carpooled: 1,129 (4.7%)Bus : 129 (0.5%)Subway or elevated rail : 47 (0.2%)Long-distance train or commuter rail : 22 (0.1%)Taxi: 622 (2.6%)Bicycle: 56 (0.2%)Walked: 150 (0.6%)Worked at home: 3,569 (14.9%)
Unemployment by race in 2022
Unemployment rate for White non-Hispanic residents 3.1% Males2.2% FemalesUnemployment rate for Asian residents 8.3% FemalesUnemployment rate for two or more race residents 1.7% FemalesUnemployment rate for Hispanic or Latino residents 18.4% Males7.3% Females
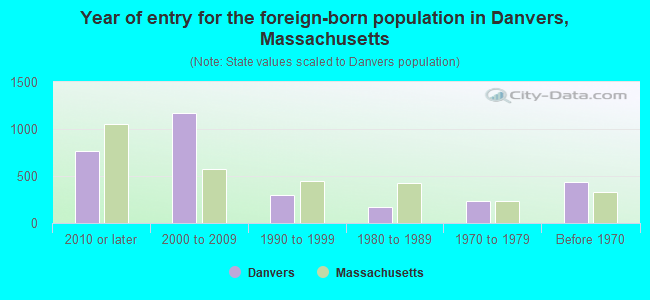
Year of entry for the foreign-born population in Danvers, Massachusetts
763 2010 or later 1,166 2000 to 2009 294 1990 to 1999 168 1980 to 1989 236 1970 to 1979 433 Before 1970
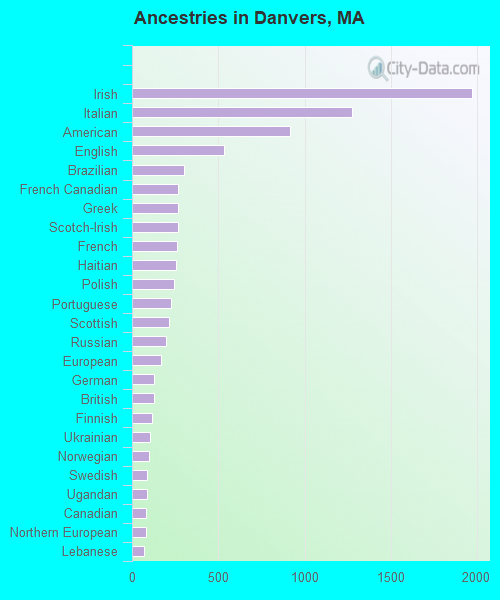
First ancestries reported:
Irish: 1,971 (18.2%)
Italian: 1,276 (11.8%)
American: 916 (8.5%)
English: 531 (4.9%)
Brazilian: 302 (2.8%)
French Canadian: 268 (2.5%)
Greek: 268 (2.5%)
Scotch-Irish: 267 (2.5%)
French: 260 (2.4%)
Haitian: 257 (2.4%)
Polish: 244 (2.3%)
Portuguese: 226 (2.1%)
Scottish: 213 (2.0%)
Russian: 199 (1.8%)
European: 171 (1.6%)
German: 130 (1.2%)
British: 126 (1.2%)
Finnish: 115 (1.1%)
Ukrainian: 102 (0.9%)
Norwegian: 98 (0.9%)
Swedish: 88 (0.8%)
Ugandan: 86 (0.8%)
Canadian: 83 (0.8%)
Northern European: 80 (0.7%)
Lebanese: 71 (0.7%)
Iraqi: 69 (0.6%)
Czechoslovakian: 49 (0.5%)
Jordanian: 34 (0.3%)
Albanian: 32 (0.3%)
Swiss: 19 (0.2%)
Slovene: 16 (0.1%)
Israeli: 15 (0.1%)
Kenyan: 14 (0.1%)
Welsh: 14 (0.1%)
Eastern European: 13 (0.1%)
Armenian: 10 (0.09%)
Belgian: 9 (0.08%)
West Indian: 6 (0.06%)
Lithuanian: 4 (0.04%)
Hungarian: 1 (0.01%) Most common places of birth for foreign-born residents (%): Brazil Danvers:
14.8% (392)Massachusetts:
7.6% (92,959)
Colombia Danvers:
10.3% (272)Massachusetts:
2.3% (27,810)
Mexico Danvers:
8.5% (225)Massachusetts:
1.1% (13,065)
Chile Danvers:
8.2% (216)Massachusetts:
0.2% (2,809)
Russia Danvers:
7.1% (187)Massachusetts:
1.5% (18,278)
China, excluding Hong Kong and Taiwan Danvers:
5.2% (138)Massachusetts:
8.4% (103,233)
Philippines Danvers:
3.9% (102)Massachusetts:
0.9% (10,810)
Nepal Danvers:
3.6% (96)Massachusetts:
0.6% (6,789)
Peru Danvers:
3.6% (95)Massachusetts:
0.6% (7,349)
Canada Danvers:
3.6% (94)Massachusetts:
2.3% (28,158)
Ukraine Danvers:
3.3% (88)Massachusetts:
0.9% (10,808)
Iraq Danvers:
3.3% (86)Massachusetts:
0.4% (4,735)
Haiti Danvers:
3.3% (86)Massachusetts:
4.9% (60,432)
Italy Danvers:
3.1% (83)Massachusetts:
1.4% (16,886)
United Kingdom, excluding England and Scotland Danvers:
1.7% (46)Massachusetts:
1.0% (12,709)
Japan Danvers:
1.6% (41)Massachusetts:
0.6% (7,301)
Other Eastern Africa Danvers:
1.6% (41)Massachusetts:
0.1% (1,829)
Place of birth for U.S.-born residents:
This state: 21,024Other state: 3,743Northeast: 2,129Midwest: 529South: 537West: 549 88.7% of Danvers residents lived in the same house 1 years ago.
Out of people who lived in different houses, 38.3% lived in this county.
Out of people who lived in different counties, 77.6% lived in Massachusetts.
Danvers:
88.7%State average:
87.7%
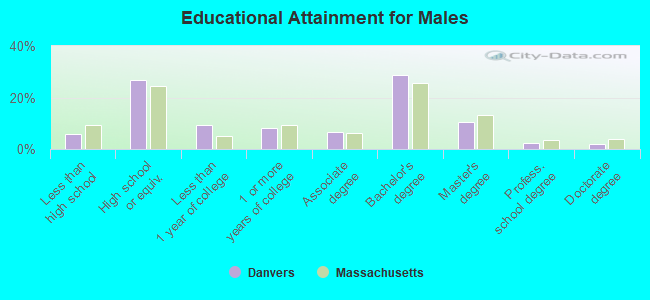
Education attainment for males 25 years and older:
No schooling: 66Nursery to 4th grade: 05th and 6th grade: 57th and 8th grade: 09th grade: 9510th grade: 10411th grade: 12212th grade, no diploma: 185High school graduate (or equivalency): 2,598Less than 1 year of college: 925Some college more than 1 year, no degree: 779Associate degree: 632Bachelor's degree: 2,798Master's degree: 1,005Professional school degree: 222Doctorate degree: 193
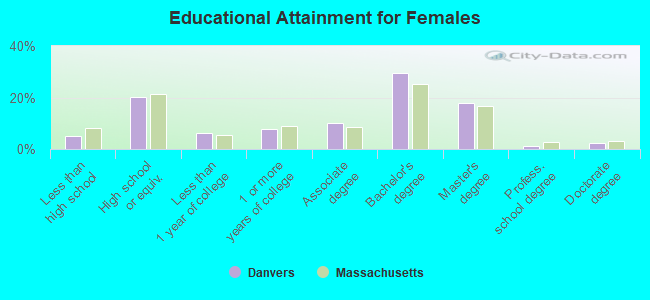
Education attainment for females 25 years and older:
No schooling: 137Nursery to 4th grade: 145th and 6th grade: 287th and 8th grade: 879th grade: 510th grade: 7411th grade: 11712th grade, no diploma: 121High school graduate (or equivalency): 2,274Less than 1 year of college: 719Some college more than 1 year, no degree: 865Associate degree: 1,150Bachelor's degree: 3,327Master's degree: 2,000Professional school degree: 112Doctorate degree: 276
Housing units in structures:
One, detached: 6,760One, attached: 729Two: 7263 or 4: 5015 to 9: 74910 to 19: 44320 to 49: 90850 or more: 703Mobile homes: 116Boats, RVs, vans, etc.: 28Housing units lacking complete plumbing facilities in 2022: 0.2%Housing units lacking complete kitchen facilities in 2022: 1.5%House/condo owner moved in on average 17 years ago
Renter moved in on average 1 years ago
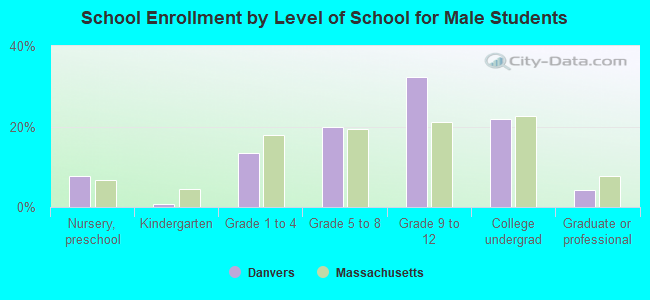
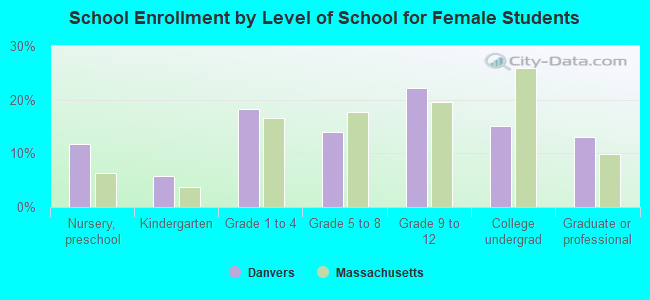
Private vs. public school enrollment:
Students in private schools in grades 1 to 8 (elementary and middle school): 331 Here:
17.3%Massachusetts:
10.3%
Students in private schools in grades 9 to 12 (high school): 108 Here:
6.9%Massachusetts:
12.3%
Students in private undergraduate colleges: 565 Here:
52.1%Massachusetts:
51.2%