Darien, CT (Connecticut) Houses and Residents
| Darien: | $1,516,135 |
| Connecticut: | $347,200 |
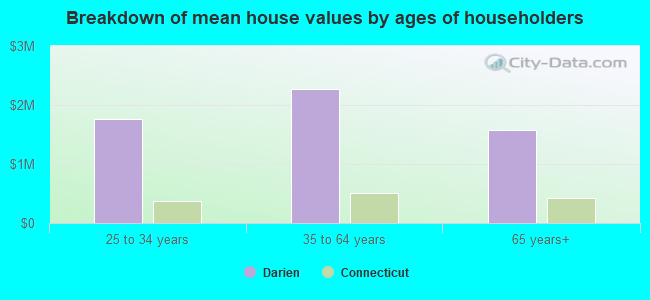
Mean price in 2022:
Detached houses: $2,346,046
Here: $2,346,046 State: $503,946 Townhouses or other attached units: $1,047,130
Here: $1,047,130 State: $304,959 In 2-unit structures: $909,079
Here: $909,079 State: $304,133 In 5-or-more-unit structures: $1,658,670
Here: $1,658,670 State: $249,308
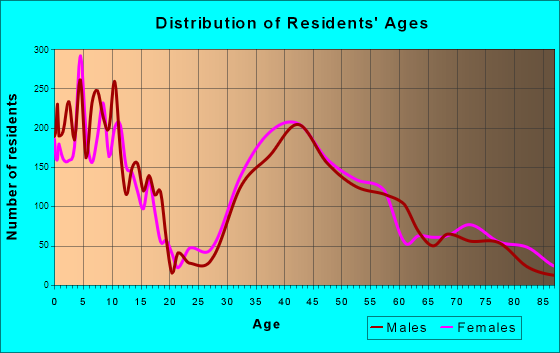
Total population: 20,732 (Urban population: 19,607, Rural population: 0)
Houses: 7,403 (7,014 occupied: 6,149 owner occupied, 949 renter occupied)
| % of renters here: | 13% |
| State: | 34% |
Housing density: 576 houses/condos per square mile
Median price asked for vacant for-sale houses and condos in 2022: $2,169,371.
Median contract rent in 2022: over $2,000 (lower quartile is $1,550, upper quartile is over $2,000)
Median rent asked for vacant for-rent units in 2022: $5,618
Median gross rent in Darien, CT in 2022: over $2,000
Housing units in Darien with a mortgage: 4,168 (21 second mortgage, 909 home equity loan, 8 both second mortgage and home equity loan)
Houses without a mortgage: 1,703
Median household income for houses/condos with a mortgage: $294,469
Median household income for apartments without a mortgage: $203,832
Median monthly housing costs: $4,187
Compare current foreclosures near Darien, CT:
| Photo | Address | Area | Beds / Baths | Price | Details |
|---|---|---|---|---|---|

|
#1
Talmadge Hill Rd
Darien, CT 06820
|
- sq. feet
|
4 baths 5 beds |
$2,395,000
|
show details |

|
#2
Olcott Way # 122
Ridgefield, CT 06877
|
920 sq. feet
|
1 baths 1 beds |
$364,900
|
show details |

|
#3
6th Ave Apt A
Huntington Station, NY 11746
|
3,300 sq. feet
|
4 baths 7 beds |
$999,900
|
show details |

|
#4
Riverdale Ave
Port Chester, NY 10573
|
1,616 sq. feet
|
1 baths 3 beds |
$659,900
|
show details |

|
#5
Brightside Ave
East Northport, NY 11731
|
1,250 sq. feet
|
2 baths 2 beds |
$339,900
|
show details |

|
#6
Sandy Hill Rd
Oyster Bay, NY 11771
|
9,672 sq. feet
|
6 baths 9 beds |
$1,394,900
|
show details |

|
#7
Limerick St
Stamford, CT 06902
|
1,382 sq. feet
|
4 baths 5 beds |
$919,900
|
show details |

|
#8
Crane Ave
White Plains, NY 10603
|
2,400 sq. feet
|
2 baths 4 beds |
$724,900
|
show details |

|
#9
Sasco Hill Rd
Fairfield, CT 06824
|
- sq. feet
|
4 baths 5 beds |
$6,700,000
|
show details |

|
#10
Vista St
Stamford, CT 06902
|
2,240 sq. feet
|
3 baths 7 beds |
show details |
| Photo | Address | Area | Beds / Baths | Price | Details |
|---|---|---|---|---|---|

|
#11
Patricia Rd Unit B
Bridgeport, CT 06606
|
1,275 sq. feet
|
1 baths 2 beds |
show details | |

|
#12
Wildwood Rd Apt B6
Hartsdale, NY 10530
|
950 sq. feet
|
1 baths 2 beds |
show details | |

|
#13
Park Ave
Huntington, NY 11743
|
2,200 sq. feet
|
2 baths 4 beds |
show details | |

|
#14
Briar Oak Dr
Weston, CT 06883
|
2,634 sq. feet
|
3 baths 4 beds |
show details | |

|
#15
Lenox Rd
Huntington Station, NY 11746
|
1,250 sq. feet
|
1 baths 3 beds |
show details | |

|
#16
Stornowaye St
Chappaqua, NY 10514
|
5,023 sq. feet
|
4 baths 4 beds |
show details | |

|
#17
Renaissance Sq
White Plains, NY 10601
|
1,658 sq. feet
|
3 baths 2 beds |
show details | |

|
#18
Daniel Ct
Westport, CT 06880
|
4,566 sq. feet
|
4 baths 4 beds |
show details | |

|
#19
Chestnut Hill Rd
Wilton, CT 06897
|
4,630 sq. feet
|
4 baths 5 beds |
show details | |

|
#20
Buttery Rd
New Canaan, CT 06840
|
1,986 sq. feet
|
2 baths 4 beds |
show details |
| Photo | Address | Area | Beds / Baths | Price | Details |
|---|---|---|---|---|---|

|
#21
Harris St
Norwalk, CT 06850
|
1,176 sq. feet
|
2 baths 3 beds |
show details | |

|
#22
Madison Ave
Bridgeport, CT 06606
|
1,100 sq. feet
|
1 baths 3 beds |
show details | |

|
#23
Carrington Dr
East Northport, NY 11731
|
1,500 sq. feet
|
2 baths 4 beds |
show details | |

|
#24
Wyndover Ln
Stamford, CT 06902
|
4,398 sq. feet
|
3 baths 3 beds |
show details | |

|
#25
James Ct
Port Chester, NY 10573
|
1,420 sq. feet
|
3 baths 2 beds |
show details | |

|
#26
Beacon Ln
Port Chester, NY 10573
|
2,650 sq. feet
|
2 baths 4 beds |
show details | |

|
#27
Lexington Ave Apt 203
Bridgeport, CT 06604
|
715 sq. feet
|
1 baths 1 beds |
show details | |

|
#28
Mountain View Dr
Weston, CT 06883
|
4,687 sq. feet
|
3 baths 4 beds |
show details | |

|
#29
High Meadow Rd
Southport, CT 06890
|
3,566 sq. feet
|
3 baths 4 beds |
show details | |

|
#30
Midland Ave
Rye, NY 10580
|
1,621 sq. feet
|
1 baths 3 beds |
show details |
| Photo | Address | Area | Beds / Baths | Price | Details |
|---|---|---|---|---|---|

|
#31
82 Herkimer St
Bridgeport, CT 06604
|
- sq. feet
|
3 baths 5 beds |
show details | |

|
#32
Depot Rd
Huntington Station, NY 11746
|
1,550 sq. feet
|
1 baths 4 beds |
show details | |

|
#33
Rennell St
Bridgeport, CT 06604
|
1,419 sq. feet
|
1 baths 3 beds |
show details | |

|
#34
Granada Crescent Aka 4 Granada Crescent, Apt. 15
White Plains, NY 10603
|
1,300 sq. feet
|
2 baths 3 beds |
show details | |

|
#35
Park Ave Unit 22
Bridgeport, CT 06604
|
2,296 sq. feet
|
2 baths 2 beds |
show details | |

|
#36
Beechwood Ave
Bridgeport, CT 06604
|
2,167 sq. feet
|
2 baths 3 beds |
show details | |

|
#37
Westview Ave
White Plains, NY 10603
|
1,513 sq. feet
|
3 baths 5 beds |
show details | |

|
#38
S Broadway
White Plains, NY 10605
|
3,606 sq. feet
|
2 baths 7 beds |
show details | |

|
#39
Railroad St
Greenlawn, NY 11740
|
2,000 sq. feet
|
2 baths 4 beds |
show details | |

|
#40
Pulaski Rd
Kings Park, NY 11754
|
3,224 sq. feet
|
3 baths 4 beds |
show details |
| Photo | Address | Area | Beds / Baths | Price | Details |
|---|---|---|---|---|---|

|
#41
Lockwood Rd
Fairfield, CT 06825
|
3,635 sq. feet
|
2 baths 5 beds |
show details | |

|
#42
Northill St Apt 2x
Stamford, CT 06907
|
1,076 sq. feet
|
2 baths 2 beds |
show details | |

|
#43
Soundview Ave Unit 60
Stamford, CT 06902
|
2,189 sq. feet
|
1 baths 3 beds |
show details | |

|
#44
Courtland Ave Apt 2w
Stamford, CT 06902
|
1,032 sq. feet
|
2 baths 2 beds |
show details | |

|
#45
Upland Ct
Norwalk, CT 06854
|
1,368 sq. feet
|
1 baths 4 beds |
show details | |

|
#46
Ellsworth St
Bridgeport, CT 06605
|
1,700 sq. feet
|
2 baths 2 beds |
show details | |

|
#47
Soundview Ave
Stamford, CT 06902
|
2,600 sq. feet
|
3 baths 6 beds |
show details | |

|
#48
Deer Run Rd
Wilton, CT 06897
|
2,117 sq. feet
|
2 baths 3 beds |
show details | |

|
#49
Poplar St # 257
Bridgeport, CT 06605
|
3,658 sq. feet
|
3 baths 8 beds |
show details | |

|
Check over 1 million property listings on Foreclosure.com!
|
browse all offers | |||

Latest news about housing in Darien, CT collected exclusively by city-data.com from local newspapers, TV, and radio stations

Median year apartment built: 1973
Household type by relationship:
Households: 21,948- Male householders: 3,646 (472 living alone), Female householders: 3,314 (666 living alone)
5,155 spouses (5,155 opposite-sex spouses), 19 unmarried partners, (19 opposite-sex unmarried partners), 8,971 children (8,748 natural, 162 adopted, 60 stepchildren), 69 grandchildren, 30 brothers or sisters, 241 parents, 0 foster children, 214 other relatives, 238 non-relatives
- In group quarters: 48
Size of family households: 1,750 2-persons, 1,362 3-persons, 1,518 4-persons, 871 5-persons, 251 6-persons, 103 7-or-more-persons.
Size of nonfamily households: 1,207 1-person, 63 2-persons.
6,302 married couples with children.
637 single-parent households (264 men, 373 women).
84.3% of residents of Darien speak English at home.
3.8% of residents speak Spanish at home (84% speak English very well, 13% speak English well, 3% speak English not well).
8.2% of residents speak other Indo-European language at home (86% speak English very well, 11% speak English well, 2% speak English not well, 1% don't speak English at all).
2.5% of residents speak Asian or Pacific Island language at home (66% speak English very well, 14% speak English well, 15% speak English not well, 5% don't speak English at all).
0.3% of residents speak other language at home (86% speak English very well, 14% speak English well).
Foreign born population: 2,789 (12.7%)
(69.7% of them are naturalized citizens)
| Here: | 10.0 |
| State: | 6.5 |
| Here: | 4.1 |
| State: | 4.0 |
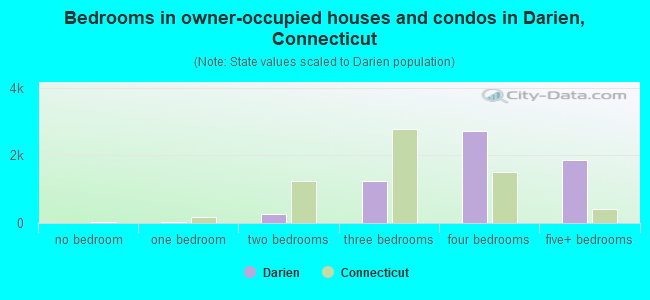
- Bedrooms in owner-occupied houses and condos in Darien, Connecticut
- 8no bedroom
- 391 bedroom
- 2652 bedrooms
- 1,2553 bedrooms
- 2,7094 bedrooms
- 1,8745+ bedrooms
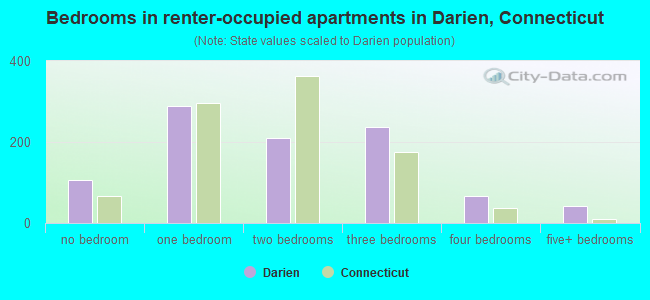
- Bedrooms in renter-occupied apartments in Darien, Connecticut
- 105no bedroom
- 2891 bedroom
- 2102 bedrooms
- 2373 bedrooms
- 664 bedrooms
- 425+ bedrooms
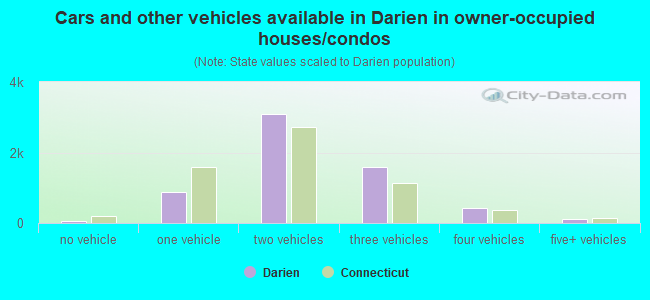
- Cars and other vehicles available in Darien in owner-occupied houses/condos
- 50no vehicle
- 8831 vehicle
- 3,1042 vehicles
- 1,5763 vehicles
- 4184 vehicles
- 1175+ vehicles
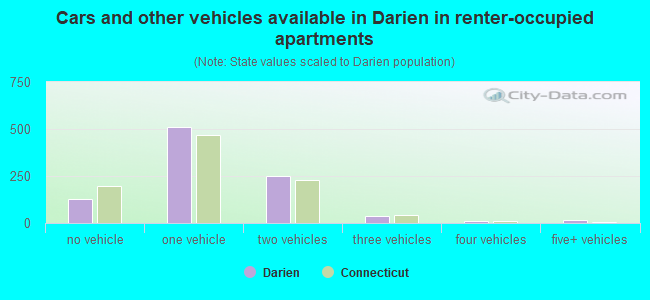
- Cars and other vehicles available in Darien in renter-occupied apartments
- 126no vehicle
- 5101 vehicle
- 2512 vehicles
- 383 vehicles
- 94 vehicles
- 155+ vehicles
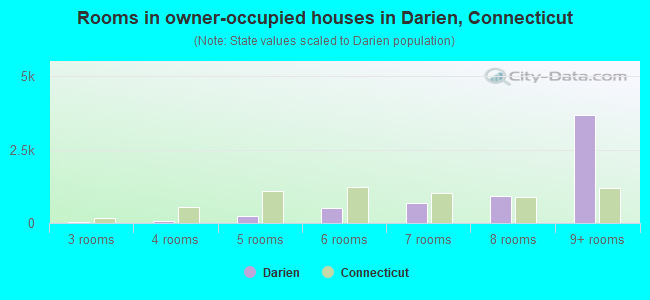
- Rooms in owner-occupied houses in Darien, Connecticut
- 81 room
- 02 rooms
- 433 rooms
- 734 rooms
- 2495 rooms
- 4966 rooms
- 6867 rooms
- 9158 rooms
- 3,6799+ rooms
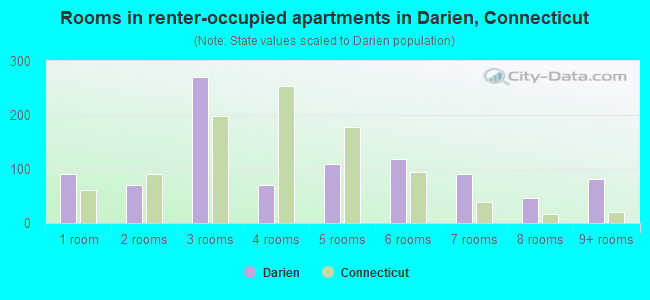
- Rooms in renter-occupied apartments in Darien, Connecticut
- 911 room
- 712 rooms
- 2703 rooms
- 704 rooms
- 1095 rooms
- 1186 rooms
- 917 rooms
- 478 rooms
- 829+ rooms
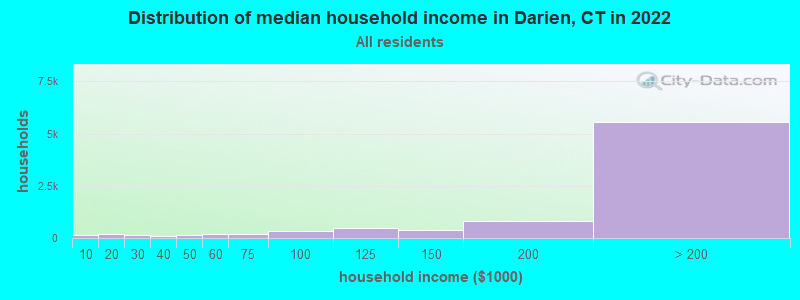
Darien, CT household income distribution

- 125Less than $10,000
- 174$10,000 to $19,999
- 163$20,000 to $29,999
- 92$30,000 to $39,999
- 140$40,000 to $49,999
- 197$50,000 to $59,999
- 211$60,000 to $74,999
- 320$75,000 to $99,999
- 461$100,000 to $124,999
- 406$125,000 to $149,999
- 821$150,000 to $199,999
- 5,553$200,000 or more
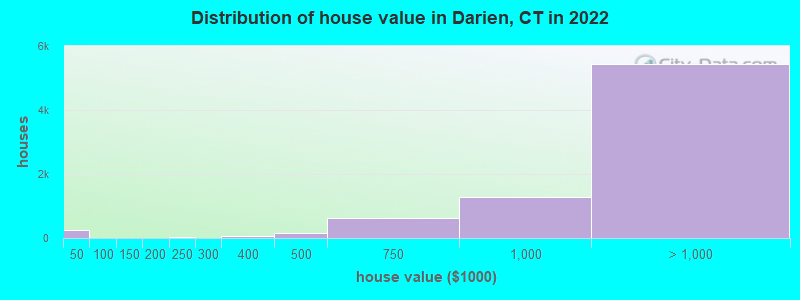
Home value of owner - occupied houses in 2022 in Darien, CT
-
- 241Less than $10,000
- 5$80,000 to $89,999
- 12$100,000 to $124,999
- 30$200,000 to $249,999
- 11$250,000 to $299,999
- 51$300,000 to $399,999
- 145$400,000 to $499,999
- 629$500,000 to $749,999
- 1,282$750,000 to $999,999
- 1,767$1,000,000 to $1,499,999
- 1,602$1,500,000 to $1,999,999
- 2,072$2,000,000 or more
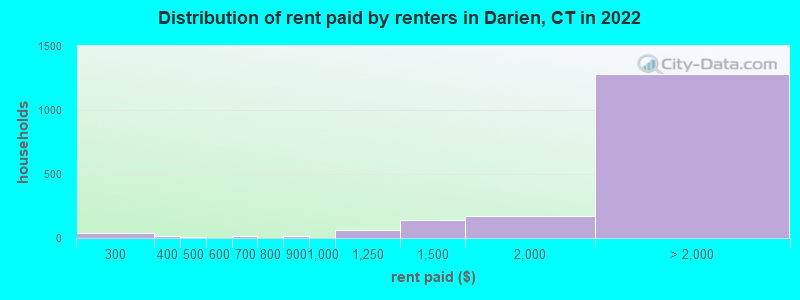
Rent paid by renters in 2022 in Darien, CT
-
- 38$250 to $299
- 18$350 to $399
- 6$450 to $499
- 17$600 to $649
- 13$800 to $899
- 58$1,000 to $1,249
- 138$1,250 to $1,499
- 168$1,500 to $1,999
- 280$2,000 to $2,499
- 155$2,500 to $2,999
- 92$3,000 to $3,499
- 726$3,500 or more
- 27No cash rent
Percentage of workers working in this county: 57.7%
Number of people working at home: 2,011 (22.2% of all workers)
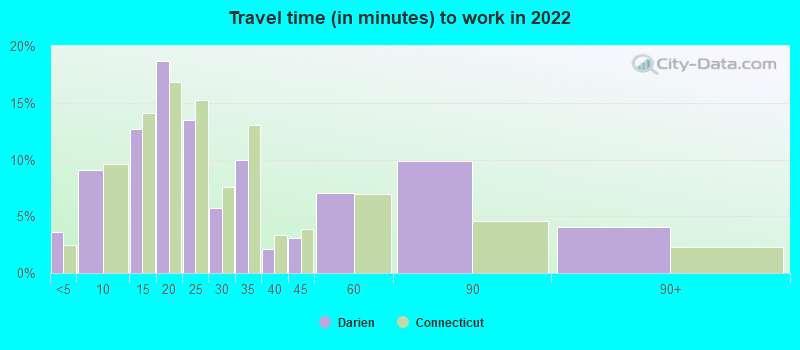
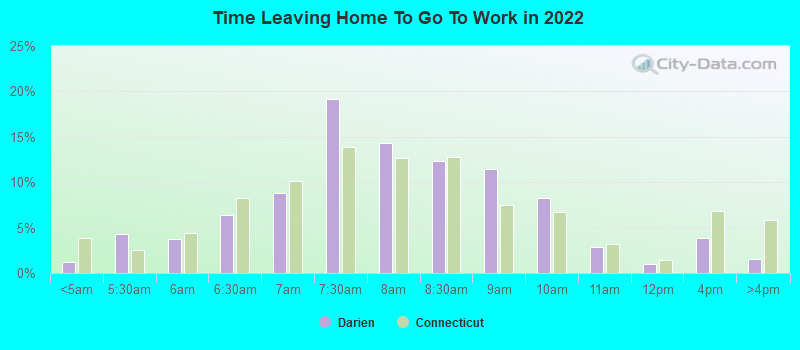
Travel time to work (commute)
- Less than 5 minutes: 314
- 5 to 9 minutes: 837
- 10 to 14 minutes: 821
- 15 to 19 minutes: 869
- 20 to 24 minutes: 777
- 25 to 29 minutes: 167
- 30 to 34 minutes: 564
- 35 to 39 minutes: 77
- 40 to 44 minutes: 84
- 45 to 59 minutes: 388
- 60 to 89 minutes: 1,621
- 90 or more minutes: 923
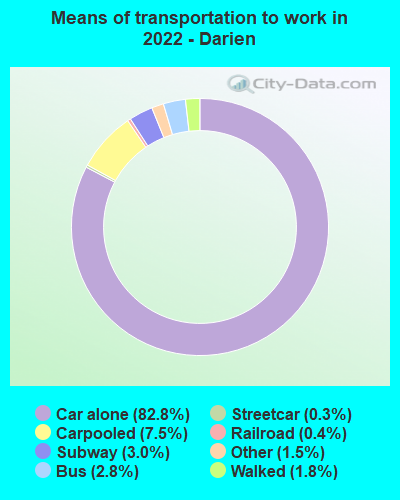
Means of transportation to work:
- Drove a car alone: 6,874 (69.8%)
- Carpooled: 607 (6.2%)
- Bus: 167 (1.7%)
- Subway or elevated rail: 53 (0.5%)
- Long-distance train or commuter rail: 175 (1.8%)
- Light rail, streetcar or trolley: 82 (0.8%)
- Taxi: 165 (1.7%)
- Walked: 168 (1.7%)
- Worked at home: 2,062 (20.9%)
- Unemployment by race in 2022
- Unemployment rate for White non-Hispanic residents
- 4.8%Males
- 3.4%Females
- Unemployment rate for Black residents
- 10.8%Females
- Unemployment rate for Asian residents
- 9.3%Females
- Unemployment rate for two or more race residents
- 3.0%Males
- Unemployment rate for Hispanic or Latino residents
- 23.9%Females
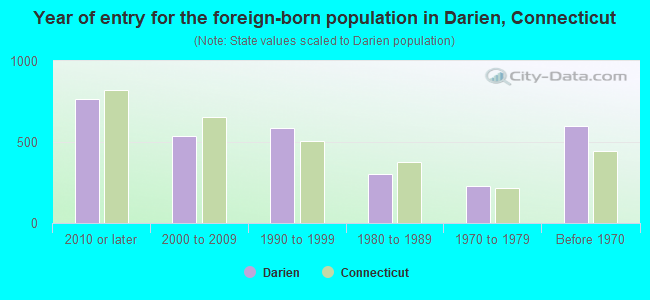
- Year of entry for the foreign-born population in Darien, Connecticut
- 7662010 or later
- 5392000 to 2009
- 5851990 to 1999
- 3021980 to 1989
- 2281970 to 1979
- 600Before 1970
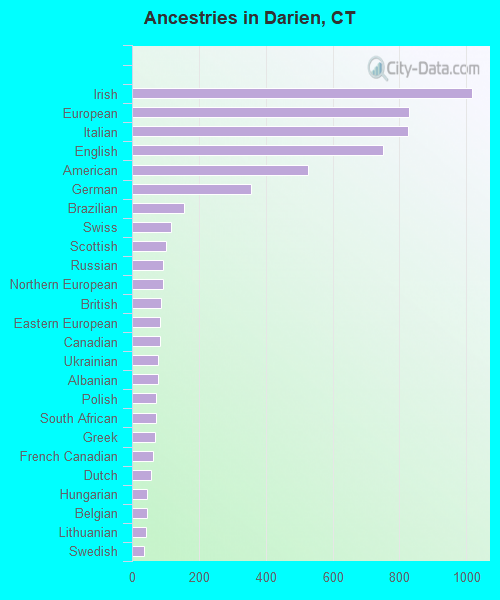
First ancestries reported:
- Irish: 1,017 (12.8%)
- European: 829 (10.4%)
- Italian: 827 (10.4%)
- English: 750 (9.4%)
- American: 525 (6.6%)
- German: 356 (4.5%)
- Brazilian: 157 (2.0%)
- Swiss: 117 (1.5%)
- Scottish: 101 (1.3%)
- Russian: 94 (1.2%)
- Northern European: 92 (1.2%)
- British: 87 (1.1%)
- Eastern European: 83 (1.0%)
- Canadian: 83 (1.0%)
- Ukrainian: 79 (1.0%)
- Albanian: 77 (1.0%)
- Polish: 72 (0.9%)
- South African: 71 (0.9%)
- Greek: 69 (0.9%)
- French Canadian: 63 (0.8%)
- Dutch: 57 (0.7%)
- Hungarian: 45 (0.6%)
- Belgian: 44 (0.6%)
- Lithuanian: 41 (0.5%)
- Swedish: 37 (0.5%)
- Norwegian: 35 (0.4%)
- Cypriot: 34 (0.4%)
- Scandinavian: 34 (0.4%)
- Portuguese: 33 (0.4%)
- Moroccan: 33 (0.4%)
- Romanian: 33 (0.4%)
- Slovak: 32 (0.4%)
- French: 31 (0.4%)
- Zimbabwean: 30 (0.4%)
- Austrian: 28 (0.4%)
- Estonian: 26 (0.3%)
- Scotch-Irish: 23 (0.3%)
- Croatian: 23 (0.3%)
- Latvian: 20 (0.3%)
- Danish: 20 (0.3%)
- Haitian: 20 (0.3%)
- Syrian: 17 (0.2%)
- Welsh: 16 (0.2%)
- Czech: 14 (0.2%)
- Slavic: 13 (0.2%)
- Bermudan: 12 (0.2%)
- Lebanese: 11 (0.1%)
- Finnish: 9 (0.1%)
- Czechoslovakian: 7 (0.09%)
- Serbian: 7 (0.09%)
- Armenian: 6 (0.08%)
- Australian: 4 (0.05%)
Most common places of birth for foreign-born residents (%):
| Darien: | 10.6% (279) |
| Connecticut: | 100.0% (-1) |
| Darien: | 7.4% (193) |
| Connecticut: | 100.0% (-1) |
| Darien: | 6.4% (168) |
| Connecticut: | 100.0% (-1) |
| Darien: | 5.7% (150) |
| Connecticut: | 100.0% (-1) |
| Darien: | 5.3% (140) |
| Connecticut: | 100.0% (-1) |
| Darien: | 4.1% (107) |
| Connecticut: | 100.0% (-1) |
| Darien: | 3.9% (101) |
| Connecticut: | 100.0% (-1) |
| Darien: | 3.3% (87) |
| Connecticut: | 100.0% (-1) |
| Darien: | 3.3% (86) |
| Connecticut: | 100.0% (-1) |
| Darien: | 3.2% (85) |
| Connecticut: | 100.0% (-1) |
| Darien: | 2.6% (68) |
| Connecticut: | 100.0% (-1) |
| Darien: | 2.5% (66) |
| Connecticut: | 100.0% (-1) |
| Darien: | 2.5% (65) |
| Connecticut: | 100.0% (-1) |
| Darien: | 2.4% (63) |
| Connecticut: | 100.0% (-1) |
| Darien: | 2.4% (62) |
| Connecticut: | 100.0% (-1) |
| Darien: | 2.0% (52) |
| Connecticut: | 100.0% (-1) |
| Darien: | 1.8% (47) |
| Connecticut: | 100.0% (-1) |
| Darien: | 1.7% (45) |
| Connecticut: | 100.0% (-1) |
| Darien: | 1.6% (41) |
| Connecticut: | 100.0% (-1) |
| Darien: | 1.6% (41) |
| Connecticut: | 100.0% (-1) |
Place of birth for U.S.-born residents:
- This state: 7,314
- Other state: 11,302
- Northeast: 7,879
- Midwest: 1,717
- South: 892
- West: 915
93.4% of Darien residents lived in the same house 1 years ago.
Out of people who lived in different houses, 30.7% lived in this county.
Out of people who lived in different counties, 5.3% lived in Connecticut.
| Darien: | 93.4% |
| State average: | 88.4% |
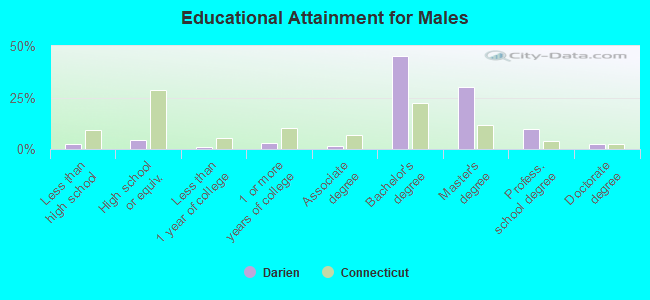
Education attainment for males 25 years and older:
- No schooling: 1
- Nursery to 4th grade: 17
- 5th and 6th grade: 6
- 7th and 8th grade: 1
- 9th grade: 0
- 10th grade: 16
- 11th grade: 25
- 12th grade, no diploma: 115
- High school graduate (or equivalency): 282
- Less than 1 year of college: 80
- Some college more than 1 year, no degree: 212
- Associate degree: 103
- Bachelor's degree: 3,071
- Master's degree: 2,039
- Professional school degree: 675
- Doctorate degree: 164
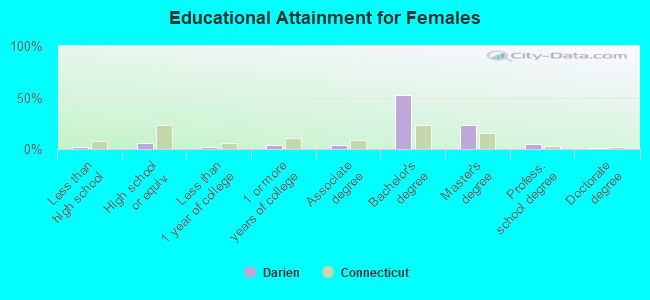
Education attainment for females 25 years and older:
- No schooling: 15
- Nursery to 4th grade: 14
- 5th and 6th grade: 22
- 7th and 8th grade: 32
- 9th grade: 0
- 10th grade: 14
- 11th grade: 0
- 12th grade, no diploma: 28
- High school graduate (or equivalency): 453
- Less than 1 year of college: 140
- Some college more than 1 year, no degree: 291
- Associate degree: 256
- Bachelor's degree: 3,754
- Master's degree: 1,713
- Professional school degree: 381
- Doctorate degree: 90
Housing units in structures:
- One, detached: 6,449
- One, attached: 276
- Two: 165
- 3 or 4: 148
- 5 to 9: 135
- 10 to 19: 40
- 20 to 49: 98
- 50 or more: 88
Median worth of mobile homes: $965,728
Housing units lacking complete kitchen facilities in 2022: 1.0%
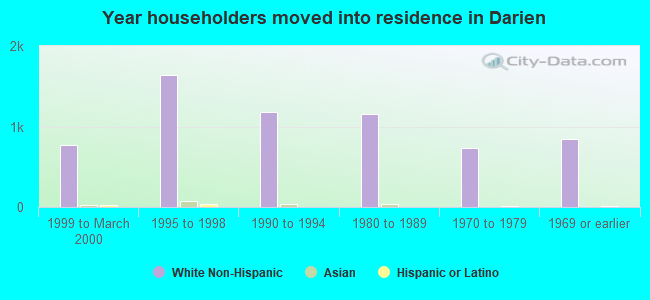
House/condo owner moved in on average 12 years ago
Renter moved in on average 2 years ago
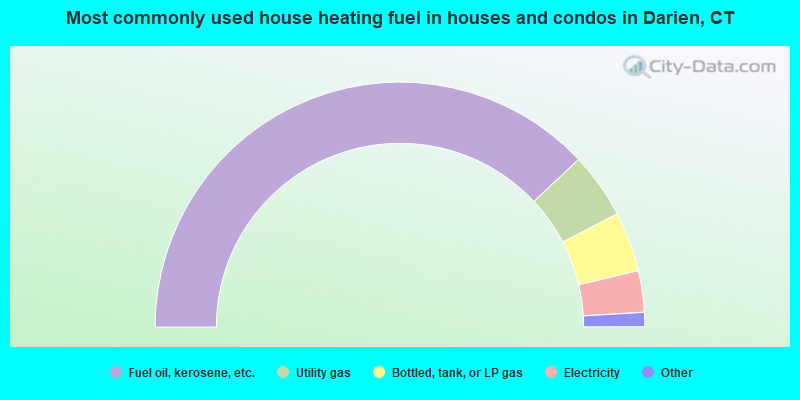
- 76.1%Fuel oil, kerosene, etc.
- 8.7%Utility gas
- 7.9%Bottled, tank, or LP gas
- 5.5%Electricity
- 1.5%Other fuel
- 0.4%No fuel used
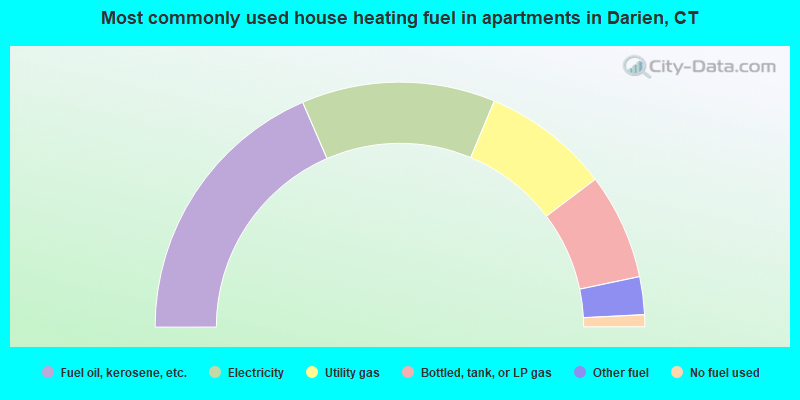
- 37.0%Fuel oil, kerosene, etc.
- 25.6%Electricity
- 16.8%Utility gas
- 14.0%Bottled, tank, or LP gas
- 5.0%Other fuel
- 1.6%No fuel used
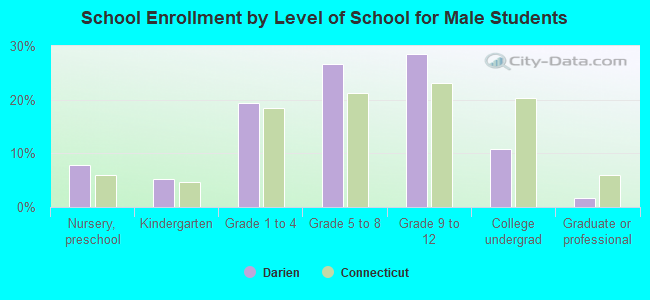
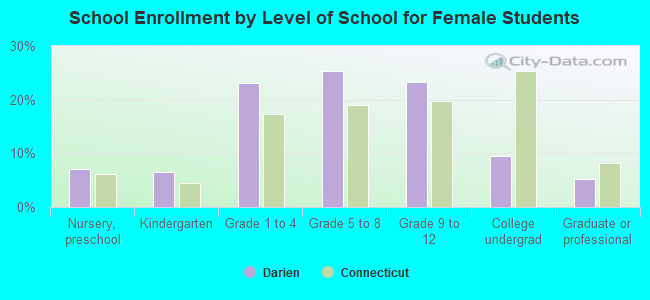
Private vs. public school enrollment:
| Here: | 13.4% |
| Connecticut: | 9.5% |
| Here: | 23.2% |
| Connecticut: | 12.9% |
| Here: | 53.8% |
| Connecticut: | 35.5% |