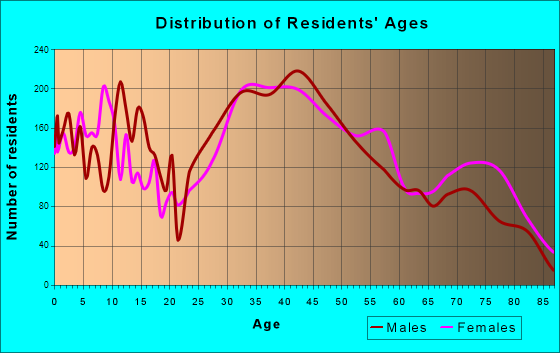
Dedham, MA (Massachusetts) Houses and Residents
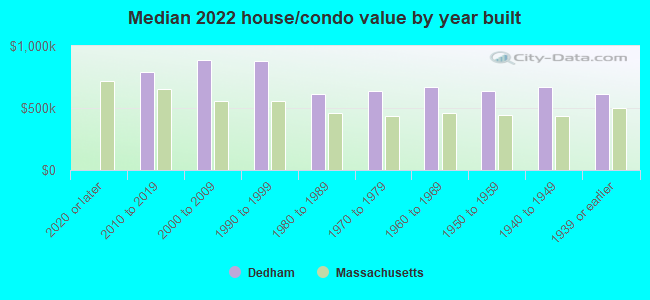
| Dedham: | $639,939 |
| Massachusetts: | $534,700 |
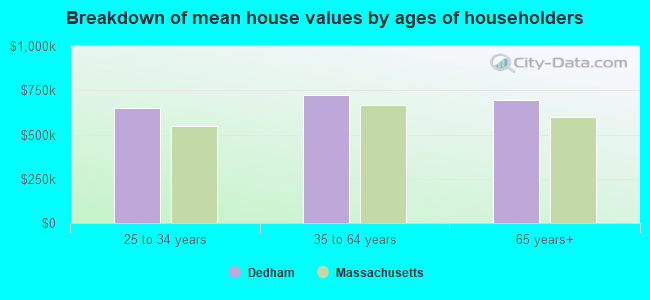
Mean price in 2022:
Detached houses: $783,306
Here: $783,306 State: $651,570 Townhouses or other attached units: $587,500
Here: $587,500 State: $617,749 In 2-unit structures: $787,110
Here: $787,110 State: $594,808 In 3-to-4-unit structures: $781,241
Here: $781,241 State: $601,912 In 5-or-more-unit structures: $529,502
Here: $529,502 State: $555,768 Mobile homes: $221,614
Here: $221,614 State: $170,209
Total population: 24,729 (Urban population: 23,221, Rural population: 289 (all nonfarm))
Houses: 11,049 (10,584 occupied: 7,417 owner occupied, 3,111 renter occupied)
| % of renters here: | 30% |
| State: | 38% |
Housing density: 1,057 houses/condos per square mile
Median price asked for vacant for-sale houses and condos in 2022: $954,098.
Median contract rent in 2022: $1,870 (lower quartile is $1,351, upper quartile is over $2,000)
Median rent asked for vacant for-rent units in 2022: $2,894
Median gross rent in Dedham, MA in 2022: over $2,000
Housing units in Dedham with a mortgage: 4,955 (673 second mortgage, 7 home equity loan, 583 both second mortgage and home equity loan)
Houses without a mortgage: 146
Median household income for houses/condos with a mortgage: $172,643
Median household income for apartments without a mortgage: $74,645
Median monthly housing costs: $2,192
Compare current foreclosures near Dedham, MA:
| Photo | Address | Area | Beds / Baths | Price | Details |
|---|---|---|---|---|---|

|
#1
Congress Pl
Dedham, MA 02026
|
1,966 sq. feet
|
2 baths 4 beds |
show details | |

|
#2
Stivaletta Dr
Dedham, MA 02026
|
1,148 sq. feet
|
1 baths 3 beds |
show details | |

|
#3
Congress Pl
Dedham, MA 02026
|
2,747 sq. feet
|
2 baths 3 beds |
show details | |

|
#4
Alden St
Dedham, MA 02026
|
732 sq. feet
|
1 baths 1 beds |
show details | |

|
#5
Holmes Rd
Dedham, MA 02026
|
1,008 sq. feet
|
1 baths 2 beds |
show details | |

|
#6
Violet Ave
Dedham, MA 02026
|
857 sq. feet
|
1 baths 3 beds |
show details | |

|
#7
Coronation Dr
Dedham, MA 02026
|
1,581 sq. feet
|
1 baths 3 beds |
show details | |

|
#8
Cedar St
Dedham, MA 02026
|
1,448 sq. feet
|
1 baths 4 beds |
show details | |

|
#9
Belknap St
Dedham, MA 02026
|
1,114 sq. feet
|
1 baths 4 beds |
show details | |

|
#10
Bussey St
Dedham, MA 02026
|
1,004 sq. feet
|
1 baths 3 beds |
show details |
| Photo | Address | Area | Beds / Baths | Price | Details |
|---|---|---|---|---|---|

|
#11
Sprague St
Dedham, MA 02026
|
884 sq. feet
|
1 baths 2 beds |
show details | |

|
#12
Greenlodge St # 1
Dedham, MA 02026
|
1,248 sq. feet
|
1 baths 3 beds |
show details | |

|
#13
Country Club Rd
Dedham, MA 02026
|
2,942 sq. feet
|
3 baths 4 beds |
show details | |

|
#14
Curve St
Dedham, MA 02026
|
864 sq. feet
|
1 baths 3 beds |
show details | |

|
#15
Milton St
Dedham, MA 02026
|
- sq. feet
|
- baths - beds |
show details | |

|
#16
Stafford St
Dedham, MA 02026
|
- sq. feet
|
- baths - beds |
show details | |

|
#17
Oneil Dr Apt 101
Dedham, MA 02026
|
- sq. feet
|
- baths - beds |
show details | |

|
#18
Boyd St
Boston, MA 02124
|
3,970 sq. feet
|
3 baths 9 beds |
$650,000
|
show details |

|
#19
Johnson Rd
North Weymouth, MA 02191
|
748 sq. feet
|
1 baths 2 beds |
$365,000
|
show details |

|
#20
Tall Oaks Dr Unit 508
South Weymouth, MA 02190
|
1,300 sq. feet
|
2 baths 2 beds |
$285,000
|
show details |
| Photo | Address | Area | Beds / Baths | Price | Details |
|---|---|---|---|---|---|

|
#21
Porrazzo Rd # 2
Hull, MA 02045
|
1,203 sq. feet
|
2 baths 2 beds |
$329,900
|
show details |

|
#22
Park Ave Apt 614
Hull, MA 02045
|
1,109 sq. feet
|
2 baths 2 beds |
$350,000
|
show details |

|
#23
Stillman St
Framingham, MA 01702
|
1,122 sq. feet
|
1 baths 2 beds |
$418,000
|
show details |

|
#24
Kendrick Ave Apt 307
Quincy, MA 02169
|
1,234 sq. feet
|
2 baths 2 beds |
show details | |

|
#25
Church St
Boston, MA 02122
|
3,663 sq. feet
|
3 baths 6 beds |
show details | |

|
#26
Gordon St
Allston, MA 02134
|
3,246 sq. feet
|
2 baths 5 beds |
show details | |

|
#27
Ballou St
Quincy, MA 02169
|
1,758 sq. feet
|
1 baths 3 beds |
show details | |

|
#28
Cappys Way
Brockton, MA 02302
|
2,128 sq. feet
|
2 baths 4 beds |
show details | |

|
#29
Garden St
Milton, MA 02186
|
1,878 sq. feet
|
1 baths 3 beds |
show details | |

|
#30
Baker St
West Roxbury, MA 02132
|
2,614 sq. feet
|
3 baths 4 beds |
show details |
| Photo | Address | Area | Beds / Baths | Price | Details |
|---|---|---|---|---|---|

|
#31
Twin Oaks Dr
Brockton, MA 02302
|
1,400 sq. feet
|
1 baths 3 beds |
show details | |

|
#32
Mallard Dr
Medway, MA 02053
|
2,024 sq. feet
|
2 baths 5 beds |
show details | |

|
#33
Gay St
Quincy, MA 02169
|
1,330 sq. feet
|
1 baths 4 beds |
show details | |

|
#34
Emily Jeffers Rd # L
Randolph, MA 02368
|
1,350 sq. feet
|
1 baths 3 beds |
show details | |

|
#35
Forest St
Boston, MA 02119
|
1,540 sq. feet
|
1 baths 3 beds |
show details | |

|
#36
Sunnybank Ave
Rockland, MA 02370
|
963 sq. feet
|
1 baths 2 beds |
show details | |

|
#37
Gallivan Blvd
Boston, MA 02124
|
1,620 sq. feet
|
1 baths 4 beds |
show details | |

|
#38
Magnolia St
Boston, MA 02125
|
3,654 sq. feet
|
3 baths 6 beds |
show details | |

|
#39
Thompson Ave
Brockton, MA 02301
|
1,775 sq. feet
|
2 baths 3 beds |
show details | |

|
#40
Savin Hill Avenue, Unit 2 190 Savin Hill Avenue Condominium
Boston, MA 02125
|
1,022 sq. feet
|
1 baths 2 beds |
show details |
| Photo | Address | Area | Beds / Baths | Price | Details |
|---|---|---|---|---|---|

|
#41
Ridgehill Rd
Canton, MA 02021
|
1,196 sq. feet
|
1 baths 3 beds |
show details | |

|
#42
S Franklin St
Holbrook, MA 02343
|
940 sq. feet
|
2 baths 2 beds |
show details | |

|
#43
Laarhoven Ter
Stoughton, MA 02072
|
1,034 sq. feet
|
1 baths 3 beds |
show details | |

|
#44
Bower St
Medford, MA 02155
|
2,323 sq. feet
|
2 baths 4 beds |
show details | |

|
#45
Mill St
Foxboro, MA 02035
|
1,584 sq. feet
|
2 baths 3 beds |
show details | |

|
#46
Victoria Cir
Norwood, MA 02062
|
2,980 sq. feet
|
3 baths 5 beds |
show details | |

|
#47
Iroquois St
Boston, MA 02120
|
2,524 sq. feet
|
1 baths 4 beds |
show details | |

|
#48
Cora St
Winthrop, MA 02152
|
1,452 sq. feet
|
1 baths 2 beds |
show details | |

|
#49
Lincoln Ave
Saugus, MA 01906
|
1,080 sq. feet
|
1 baths 3 beds |
show details | |

|
Check over 1 million property listings on Foreclosure.com!
|
browse all offers | |||

Latest news about housing in Dedham, MA collected exclusively by city-data.com from local newspapers, TV, and radio stations

 | How Much Massachusetts Households Make Per Year: Census Data (37 replies) |
| 2023 Real Estate Observations (5278 replies) |
| Dedham (79 replies) |
| Buying Pulte Homes in Westwood (19 replies) |
| Dedham or Westwood? (10 replies) |
| People are leaving Massachusetts in droves. Who are they? (290 replies) |
Median year apartment built: 1981
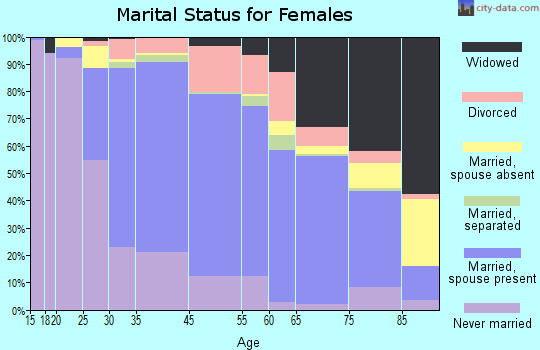
Household type by relationship:
Households: 25,269- Male householders: 4,504 (1,051 living alone), Female householders: 5,972 (2,108 living alone)
5,136 spouses (5,068 opposite-sex spouses), 531 unmarried partners, (505 opposite-sex unmarried partners), 6,918 children (6,683 natural, 136 adopted, 98 stepchildren), 134 grandchildren, 157 brothers or sisters, 237 parents, 12 foster children, 318 other relatives, 601 non-relatives
- In group quarters: 744
Size of family households: 2,791 2-persons, 1,522 3-persons, 1,500 4-persons, 387 5-persons, 100 6-persons, 56 7-or-more-persons.
Size of nonfamily households: 3,299 1-person, 821 2-persons, 64 3-persons.
3,711 married couples with children.
620 single-parent households (119 men, 501 women).
81.5% of residents of Dedham speak English at home.
6.1% of residents speak Spanish at home (74% speak English very well, 18% speak English well, 5% speak English not well, 3% don't speak English at all).
8.6% of residents speak other Indo-European language at home (56% speak English very well, 21% speak English well, 18% speak English not well, 6% don't speak English at all).
1.7% of residents speak Asian or Pacific Island language at home (84% speak English very well, 16% speak English well).
2.0% of residents speak other language at home (70% speak English very well, 19% speak English well, 11% speak English not well).
Foreign born population: 3,670 (14.5%)
(61.1% of them are naturalized citizens)
| Here: | 6.6 |
| State: | 6.5 |
| Here: | 3.9 |
| State: | 4.0 |
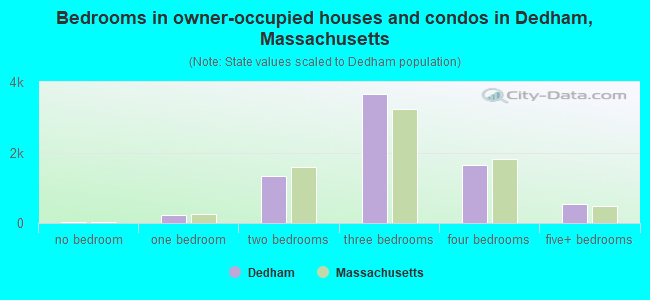
- Bedrooms in owner-occupied houses and condos in Dedham, Massachusetts
- 30no bedroom
- 2201 bedroom
- 1,3312 bedrooms
- 3,6653 bedrooms
- 1,6354 bedrooms
- 5375+ bedrooms
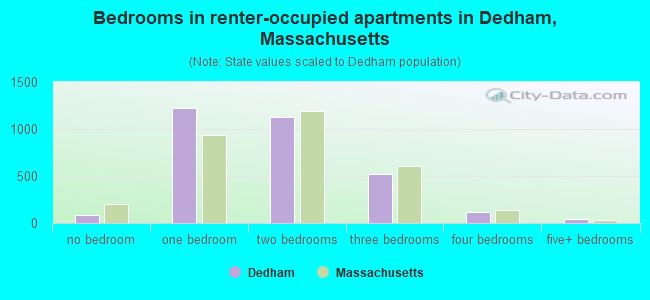
- Bedrooms in renter-occupied apartments in Dedham, Massachusetts
- 83no bedroom
- 1,2251 bedroom
- 1,1252 bedrooms
- 5163 bedrooms
- 1164 bedrooms
- 465+ bedrooms
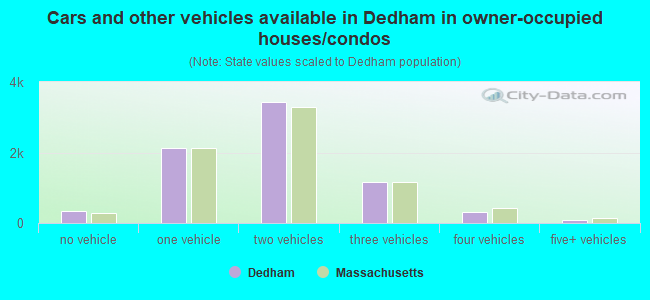
- Cars and other vehicles available in Dedham in owner-occupied houses/condos
- 332no vehicle
- 2,1311 vehicle
- 3,4202 vehicles
- 1,1523 vehicles
- 2984 vehicles
- 855+ vehicles
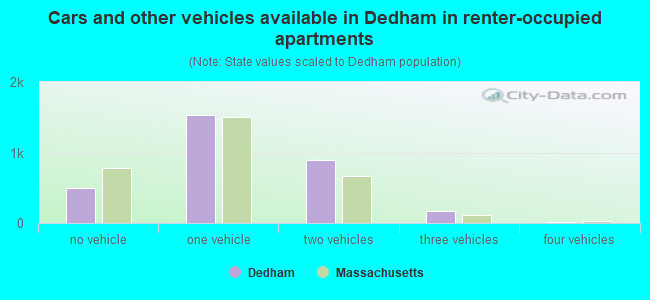
- Cars and other vehicles available in Dedham in renter-occupied apartments
- 492no vehicle
- 1,5261 vehicle
- 8902 vehicles
- 1743 vehicles
- 214 vehicles
- 95+ vehicles
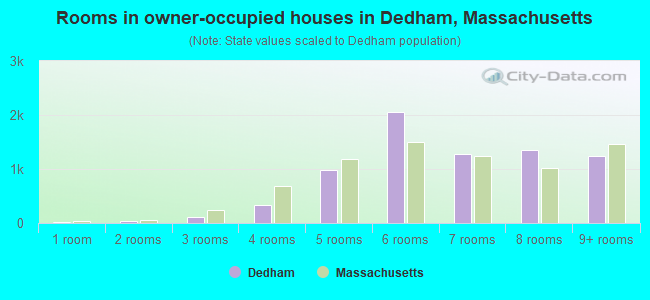
- Rooms in owner-occupied houses in Dedham, Massachusetts
- 271 room
- 352 rooms
- 1183 rooms
- 3404 rooms
- 9765 rooms
- 2,0616 rooms
- 1,2807 rooms
- 1,3448 rooms
- 1,2359+ rooms
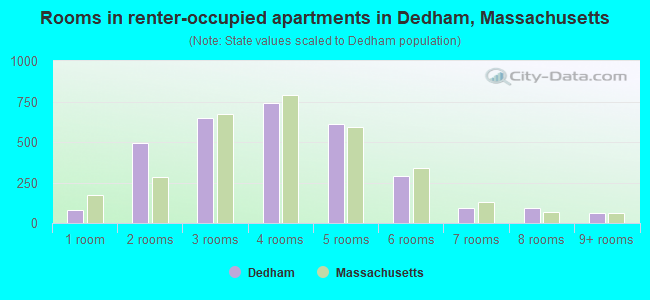
- Rooms in renter-occupied apartments in Dedham, Massachusetts
- 831 room
- 4962 rooms
- 6483 rooms
- 7394 rooms
- 6125 rooms
- 2936 rooms
- 907 rooms
- 908 rooms
- 619+ rooms
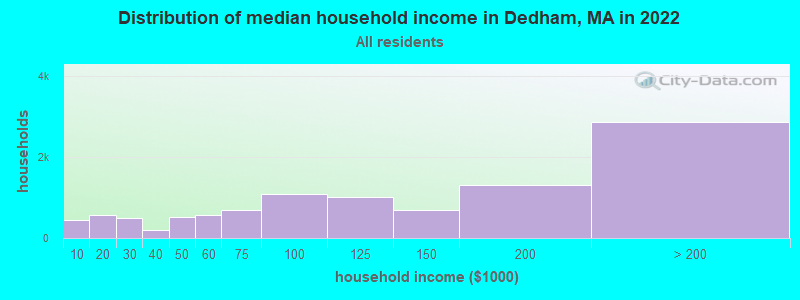
Dedham, MA household income distribution

- 455Less than $10,000
- 576$10,000 to $19,999
- 495$20,000 to $29,999
- 206$30,000 to $39,999
- 518$40,000 to $49,999
- 558$50,000 to $59,999
- 687$60,000 to $74,999
- 1,087$75,000 to $99,999
- 1,022$100,000 to $124,999
- 688$125,000 to $149,999
- 1,306$150,000 to $199,999
- 2,870$200,000 or more
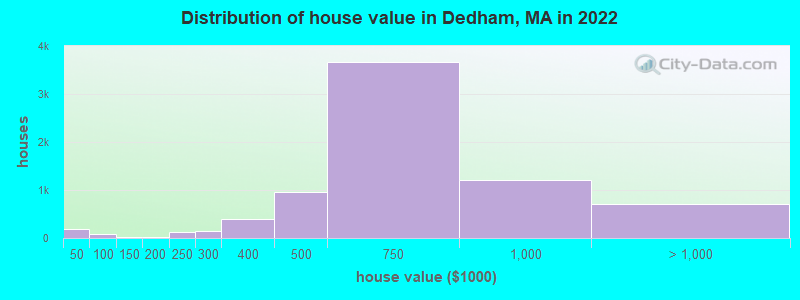
Home value of owner - occupied houses in 2022 in Dedham, MA
-
- 120Less than $10,000
- 48$10,000 to $14,999
- 12$30,000 to $34,999
- 5$40,000 to $49,999
- 34$50,000 to $59,999
- 35$60,000 to $69,999
- 12$70,000 to $79,999
- 30$100,000 to $124,999
- 18$150,000 to $174,999
- 134$200,000 to $249,999
- 143$250,000 to $299,999
- 398$300,000 to $399,999
- 962$400,000 to $499,999
- 3,658$500,000 to $749,999
- 1,212$750,000 to $999,999
- 395$1,000,000 to $1,499,999
- 132$1,500,000 to $1,999,999
- 172$2,000,000 or more
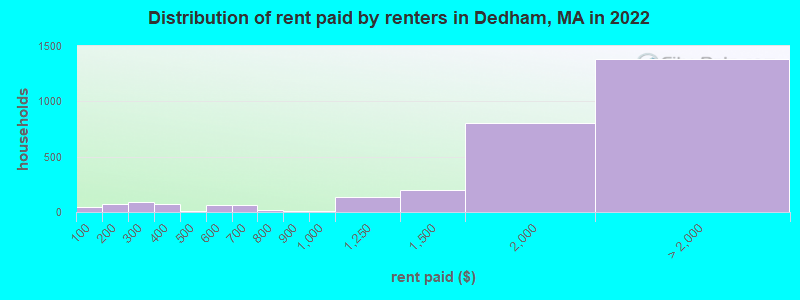
Rent paid by renters in 2022 in Dedham, MA
-
- 48Less than $100
- 30$100 to $149
- 40$150 to $199
- 88$250 to $299
- 7$300 to $349
- 68$350 to $399
- 11$450 to $499
- 37$500 to $549
- 21$550 to $599
- 11$600 to $649
- 54$650 to $699
- 16$700 to $749
- 10$800 to $899
- 7$900 to $999
- 133$1,000 to $1,249
- 196$1,250 to $1,499
- 800$1,500 to $1,999
- 520$2,000 to $2,499
- 163$2,500 to $2,999
- 240$3,000 to $3,499
- 245$3,500 or more
- 209No cash rent
Percentage of workers working in this county: 54.4%
Number of people working at home: 2,791 (19.5% of all workers)
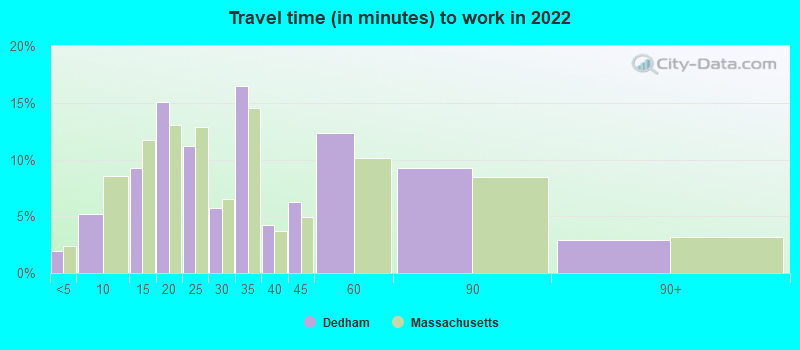
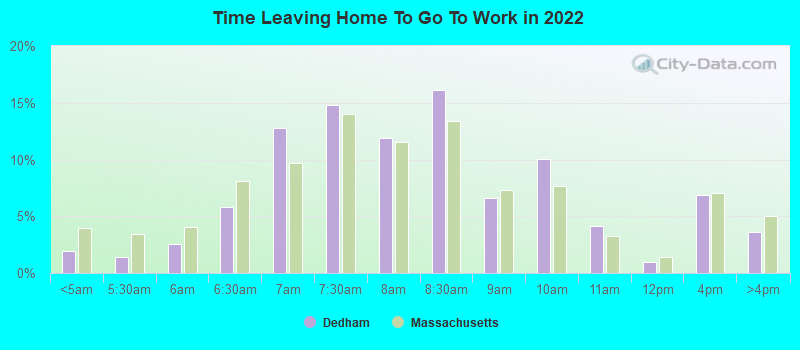
Travel time to work (commute)
- Less than 5 minutes: 180
- 5 to 9 minutes: 816
- 10 to 14 minutes: 1,180
- 15 to 19 minutes: 1,088
- 20 to 24 minutes: 1,747
- 25 to 29 minutes: 675
- 30 to 34 minutes: 1,738
- 35 to 39 minutes: 477
- 40 to 44 minutes: 544
- 45 to 59 minutes: 1,832
- 60 to 89 minutes: 844
- 90 or more minutes: 289
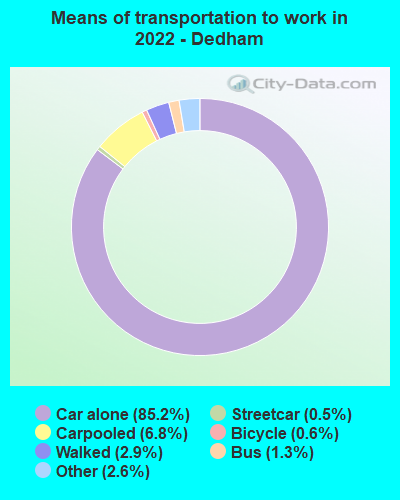
Means of transportation to work:
- Drove a car alone: 12,148 (70.5%)
- Carpooled: 956 (5.5%)
- Bus: 144 (0.8%)
- Subway or elevated rail: 69 (0.4%)
- Long-distance train or commuter rail: 11 (0.1%)
- Light rail, streetcar or trolley: 4 (0.0%)
- Taxi: 400 (2.3%)
- Bicycle: 52 (0.3%)
- Walked: 385 (2.2%)
- Worked at home: 2,791 (16.2%)
- Unemployment by race in 2022
- Unemployment rate for White non-Hispanic residents
- 6.0%Males
- 2.0%Females
- Unemployment rate for Black residents
- 0.7%Males
- 4.6%Females
- Unemployment rate for Asian residents
- 7.7%Females
- Unemployment rate for other race residents
- 15.0%Males
- Unemployment rate for two or more race residents
- 1.3%Males
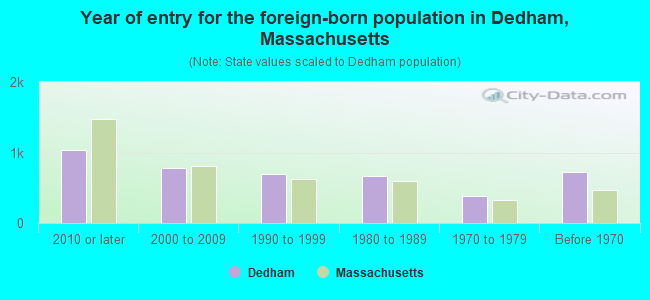
- Year of entry for the foreign-born population in Dedham, Massachusetts
- 1,0352010 or later
- 7772000 to 2009
- 6901990 to 1999
- 6721980 to 1989
- 3841970 to 1979
- 728Before 1970
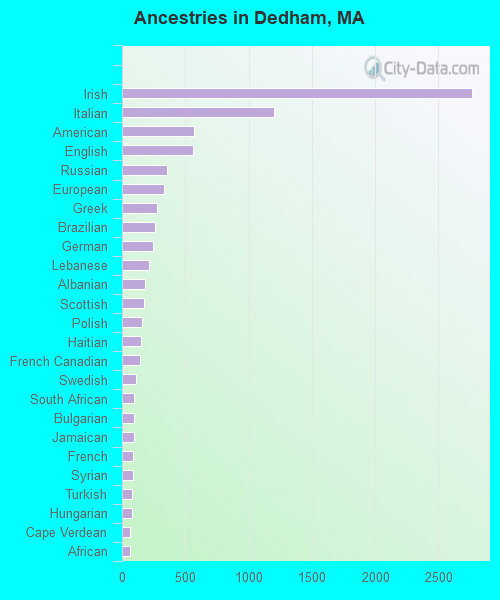
First ancestries reported:
- Irish: 2,761 (24.9%)
- Italian: 1,199 (10.8%)
- American: 566 (5.1%)
- English: 557 (5.0%)
- Russian: 359 (3.2%)
- European: 335 (3.0%)
- Greek: 274 (2.5%)
- Brazilian: 260 (2.3%)
- German: 248 (2.2%)
- Lebanese: 215 (1.9%)
- Albanian: 178 (1.6%)
- Scottish: 170 (1.5%)
- Polish: 157 (1.4%)
- Haitian: 149 (1.3%)
- French Canadian: 142 (1.3%)
- Swedish: 111 (1.0%)
- South African: 98 (0.9%)
- Bulgarian: 97 (0.9%)
- Jamaican: 92 (0.8%)
- French: 86 (0.8%)
- Syrian: 85 (0.8%)
- Turkish: 80 (0.7%)
- Hungarian: 78 (0.7%)
- Cape Verdean: 64 (0.6%)
- African: 60 (0.5%)
- Guyanese: 52 (0.5%)
- Nigerian: 45 (0.4%)
- Portuguese: 45 (0.4%)
- Israeli: 31 (0.3%)
- Ukrainian: 27 (0.2%)
- Canadian: 26 (0.2%)
- Scotch-Irish: 25 (0.2%)
- Eastern European: 24 (0.2%)
- Romanian: 24 (0.2%)
- British: 23 (0.2%)
- Armenian: 22 (0.2%)
- Austrian: 20 (0.2%)
- Moroccan: 19 (0.2%)
- Dutch: 15 (0.1%)
- Finnish: 12 (0.1%)
- Norwegian: 12 (0.1%)
- Scandinavian: 11 (0.10%)
- Welsh: 11 (0.10%)
- Lithuanian: 10 (0.09%)
- Trinidadian and Tobagonian: 10 (0.09%)
- Czech: 9 (0.08%)
- Iranian: 9 (0.08%)
- Latvian: 9 (0.08%)
- Northern European: 9 (0.08%)
- New Zealander: 8 (0.07%)
Most common places of birth for foreign-born residents (%):
| Dedham: | 8.4% (306) |
| Massachusetts: | 7.6% (92,959) |
| Dedham: | 8.0% (293) |
| Massachusetts: | 1.5% (18,278) |
| Dedham: | 5.9% (216) |
| Massachusetts: | 1.4% (16,886) |
| Dedham: | 5.3% (193) |
| Massachusetts: | 4.9% (60,432) |
| Dedham: | 5.3% (192) |
| Massachusetts: | 1.1% (13,076) |
| Dedham: | 4.5% (164) |
| Massachusetts: | 1.7% (21,468) |
| Dedham: | 4.4% (159) |
| Massachusetts: | 0.8% (10,043) |
| Dedham: | 3.9% (144) |
| Massachusetts: | 8.4% (103,233) |
| Dedham: | 3.9% (144) |
| Massachusetts: | 1.1% (13,065) |
| Dedham: | 3.2% (115) |
| Massachusetts: | 1.1% (13,446) |
| Dedham: | 3.0% (108) |
| Massachusetts: | 0.6% (7,064) |
| Dedham: | 2.5% (92) |
| Massachusetts: | 2.3% (27,810) |
| Dedham: | 2.0% (73) |
| Massachusetts: | 0.4% (5,208) |
| Dedham: | 1.9% (69) |
| Massachusetts: | 0.2% (2,335) |
| Dedham: | 1.8% (65) |
| Massachusetts: | 2.3% (28,158) |
| Dedham: | 1.8% (64) |
| Massachusetts: | 0.1% (1,122) |
| Dedham: | 1.7% (61) |
| Massachusetts: | 0.9% (10,808) |
| Dedham: | 1.6% (60) |
| Massachusetts: | 0.4% (4,618) |
Place of birth for U.S.-born residents:
- This state: 16,697
- Other state: 4,352
- Northeast: 2,638
- Midwest: 489
- South: 732
- West: 427
88.5% of Dedham residents lived in the same house 1 years ago.
Out of people who lived in different houses, 23.8% lived in this county.
Out of people who lived in different counties, 78.7% lived in Massachusetts.
| Dedham: | 88.5% |
| State average: | 87.7% |
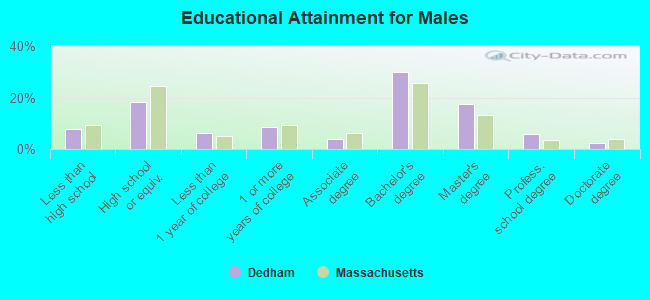
Education attainment for males 25 years and older:
- No schooling: 162
- Nursery to 4th grade: 38
- 5th and 6th grade: 30
- 7th and 8th grade: 18
- 9th grade: 18
- 10th grade: 126
- 11th grade: 101
- 12th grade, no diploma: 167
- High school graduate (or equivalency): 1,581
- Less than 1 year of college: 553
- Some college more than 1 year, no degree: 754
- Associate degree: 352
- Bachelor's degree: 2,584
- Master's degree: 1,530
- Professional school degree: 492
- Doctorate degree: 189
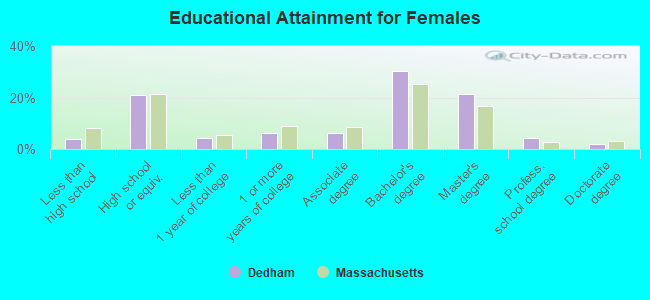
Education attainment for females 25 years and older:
- No schooling: 76
- Nursery to 4th grade: 6
- 5th and 6th grade: 37
- 7th and 8th grade: 8
- 9th grade: 73
- 10th grade: 10
- 11th grade: 72
- 12th grade, no diploma: 94
- High school graduate (or equivalency): 2,102
- Less than 1 year of college: 443
- Some college more than 1 year, no degree: 624
- Associate degree: 637
- Bachelor's degree: 3,000
- Master's degree: 2,126
- Professional school degree: 433
- Doctorate degree: 209
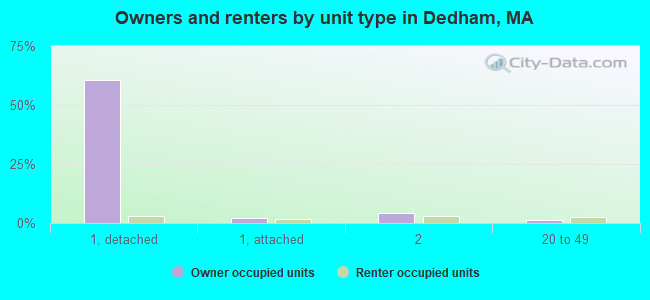
Housing units in structures:
- One, detached: 7,041
- One, attached: 522
- Two: 819
- 3 or 4: 484
- 5 to 9: 341
- 10 to 19: 351
- 20 to 49: 408
- 50 or more: 1,063
- Mobile homes: 18
Housing units lacking complete kitchen facilities in 2022: 2.9%
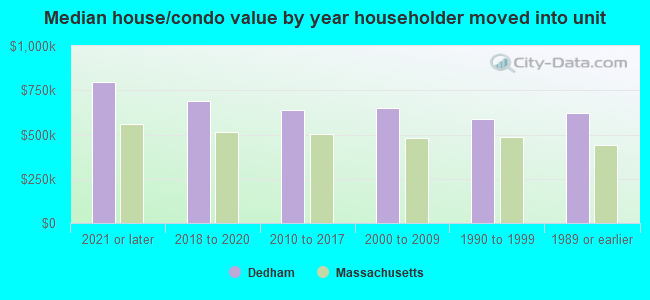
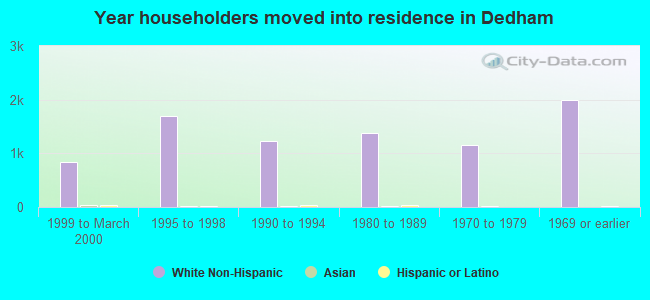
House/condo owner moved in on average 16 years ago
Renter moved in on average 3 years ago
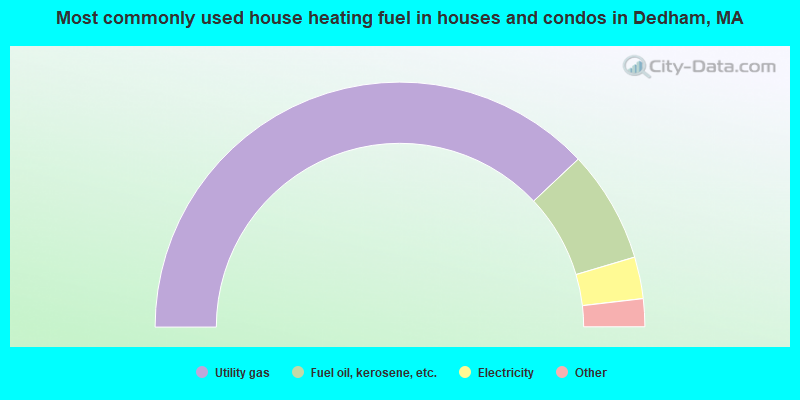
- 75.9%Utility gas
- 14.8%Fuel oil, kerosene, etc.
- 5.5%Electricity
- 2.8%Bottled, tank, or LP gas
- 0.6%Wood
- 0.4%Solar energy
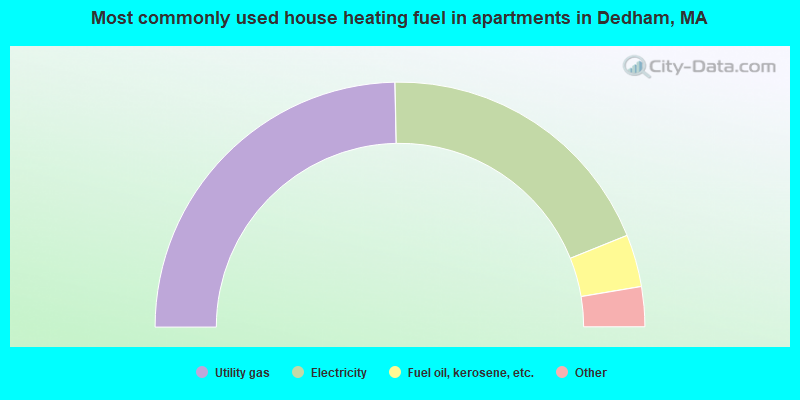
- 49.4%Utility gas
- 38.5%Electricity
- 6.9%Fuel oil, kerosene, etc.
- 2.0%Bottled, tank, or LP gas
- 1.1%Other fuel
- 1.1%No fuel used
- 1.0%Coal or coke
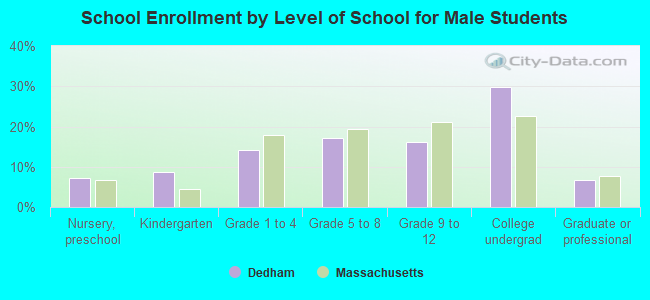
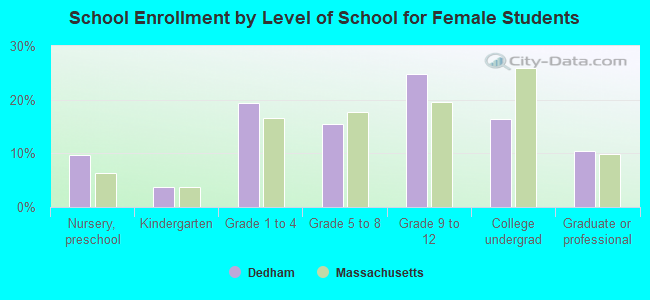
Private vs. public school enrollment:
| Here: | 14.4% |
| Massachusetts: | 10.3% |
| Here: | 23.6% |
| Massachusetts: | 12.3% |
| Here: | 45.4% |
| Massachusetts: | 51.2% |