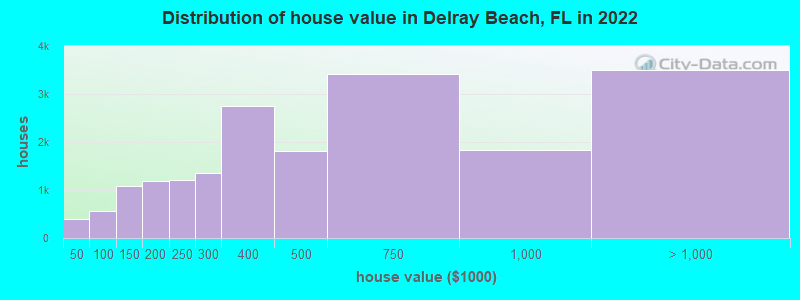
Delray Beach, FL (Florida) Houses and Residents
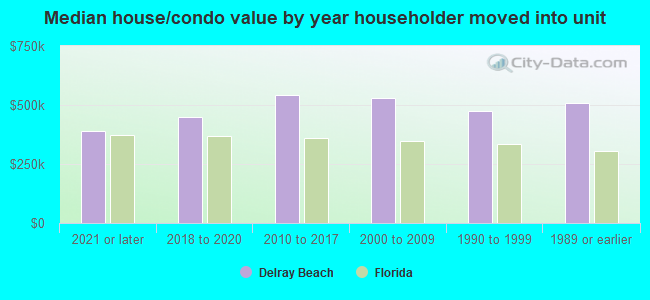
| Delray Beach: | $475,600 |
| Florida: | $354,100 |
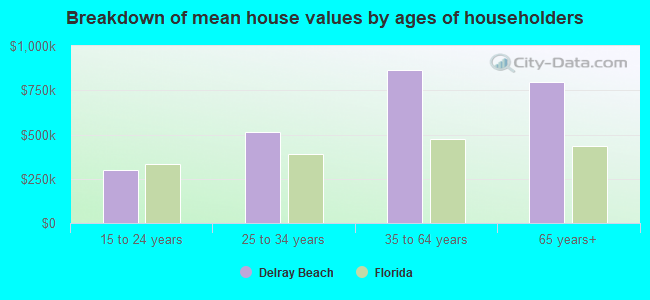
Mean price in 2022:
Detached houses: $948,151
Here: $948,151 State: $500,941 Townhouses or other attached units: $561,147
Here: $561,147 State: $370,869 In 2-unit structures: $1,949,070
Here: $1,949,070 State: $423,188 In 3-to-4-unit structures: $269,474
Here: $269,474 State: $309,944 In 5-or-more-unit structures: $474,392
Here: $474,392 State: $447,145 Mobile homes: $145,831
Here: $145,831 State: $113,202
Total population: 65,055 (Urban population: 59,941, Rural population: 0)
Houses: 33,726 (26,688 occupied: 17,100 owner occupied, 9,588 renter occupied)
| % of renters here: | 36% |
| State: | 33% |
Housing density: 2,195 houses/condos per square mile
Median price asked for vacant for-sale houses and condos in 2022: $1,006,613.
Median contract rent in 2022: $1,622 (lower quartile is $1,263, upper quartile is over $2,000)
Median rent asked for vacant for-rent units in 2022: $3,647
Median gross rent in Delray Beach, FL in 2022: $1,769
Housing units in Delray Beach with a mortgage: 9,282 (764 second mortgage, 177 home equity loan, 360 both second mortgage and home equity loan)
Houses without a mortgage: 221
Median household income for houses/condos with a mortgage: $111,847
Median household income for apartments without a mortgage: $74,132
Median monthly housing costs: $1,591
Compare current foreclosures in Delray Beach, FL:
| Photo | Address | Area | Beds / Baths | Price | Details |
|---|---|---|---|---|---|

|
#1
Poppy Pl 52-B
Delray Beach, FL 33484
|
1,220 sq. feet
|
2 baths 2 beds |
$193,800
|
show details |

|
#2
Red Hibiscus Blvd Apt D
Delray Beach, FL 33445
|
1,167 sq. feet
|
2 baths 2 beds |
show details | |

|
#3
SW 11th Ave
Delray Beach, FL 33444
|
1,196 sq. feet
|
2 baths 3 beds |
show details | |

|
#4
Burgundy O
Delray Beach, FL 33484
|
907 sq. feet
|
2 baths 2 beds |
show details | |

|
#5
Monaco C
Delray Beach, FL 33446
|
883 sq. feet
|
2 baths 2 beds |
show details | |

|
#6
Normandy H
Delray Beach, FL 33484
|
872 sq. feet
|
2 baths 2 beds |
show details | |

|
#7
Hammock Cir
Delray Beach, FL 33445
|
1,567 sq. feet
|
2 baths 3 beds |
show details | |

|
#8
Overland Pl
Delray Beach, FL 33484
|
1,527 sq. feet
|
2 baths 2 beds |
show details | |

|
#9
Mansfield Hollow Rd
Delray Beach, FL 33446
|
1,829 sq. feet
|
2 baths 2 beds |
show details | |

|
#10
SW 4th Ave
Delray Beach, FL 33444
|
1,440 sq. feet
|
1 baths 3 beds |
show details |
| Photo | Address | Area | Beds / Baths | Price | Details |
|---|---|---|---|---|---|

|
#11
Rio Del Paz
Delray Beach, FL 33446
|
7,767 sq. feet
|
3 baths 4 beds |
show details | |

|
#12
Capri A
Delray Beach, FL 33484
|
904 sq. feet
|
2 baths 2 beds |
show details | |

|
#13
SW 29th Ave
Delray Beach, FL 33445
|
1,193 sq. feet
|
2 baths 2 beds |
show details | |

|
#14
Capri H
Delray Beach, FL 33484
|
883 sq. feet
|
2 baths 2 beds |
show details | |

|
#15
Lakes Of Delray Blvd Apt 104
Delray Beach, FL 33484
|
1,000 sq. feet
|
2 baths 2 beds |
show details | |

|
#16
NW 15th St
Delray Beach, FL 33445
|
1,393 sq. feet
|
2 baths 3 beds |
show details | |

|
#17
Flanders A
Delray Beach, FL 33484
|
718 sq. feet
|
1 baths 1 beds |
show details | |

|
#18
Bristol Pointe Dr
Delray Beach, FL 33446
|
4,731 sq. feet
|
5 baths 7 beds |
show details | |

|
#19
Burgundy C
Delray Beach, FL 33484
|
883 sq. feet
|
2 baths 2 beds |
show details | |

|
#20
Homewood Blvd Apt E201
Delray Beach, FL 33445
|
1,246 sq. feet
|
2 baths 2 beds |
show details |
| Photo | Address | Area | Beds / Baths | Price | Details |
|---|---|---|---|---|---|

|
#21
Via De La Plata Cir
Delray Beach, FL 33484
|
2,300 sq. feet
|
3 baths 4 beds |
show details | |

|
#22
Bal Moral Ln Apt 206
Delray Beach, FL 33446
|
1,103 sq. feet
|
2 baths 2 beds |
show details | |

|
#23
Bedford Dr Apt 401
Delray Beach, FL 33446
|
990 sq. feet
|
2 baths 2 beds |
show details | |

|
#24
Brittany N
Delray Beach, FL 33446
|
726 sq. feet
|
1 baths 1 beds |
show details | |

|
#25
Forsythia Cir
Delray Beach, FL 33484
|
875 sq. feet
|
2 baths 1 beds |
show details | |

|
#26
Bridlewood Cir
Delray Beach, FL 33445
|
6,337 sq. feet
|
6 baths 5 beds |
show details | |

|
#27
Breton Ln
Delray Beach, FL 33446
|
1,600 sq. feet
|
2 baths 3 beds |
show details | |

|
#28
Palm Forest Dr N
Delray Beach, FL 33445
|
1,342 sq. feet
|
2 baths 3 beds |
show details | |

|
#29
Burgundy C
Delray Beach, FL 33484
|
726 sq. feet
|
1 baths 1 beds |
show details | |

|
#30
Huntington Ln Apt 306
Delray Beach, FL 33446
|
990 sq. feet
|
2 baths 2 beds |
show details |
| Photo | Address | Area | Beds / Baths | Price | Details |
|---|---|---|---|---|---|

|
#31
Via Vesta
Delray Beach, FL 33484
|
1,527 sq. feet
|
2 baths 2 beds |
show details | |

|
#32
Sterling Ave
Delray Beach, FL 33444
|
1,448 sq. feet
|
2 baths 4 beds |
show details | |

|
#33
Stanley Ln
Delray Beach, FL 33484
|
1,527 sq. feet
|
2 baths 2 beds |
show details | |

|
#34
Fenton Dr
Delray Beach, FL 33445
|
2,761 sq. feet
|
2 baths 3 beds |
show details | |

|
#35
Saxony K
Delray Beach, FL 33446
|
883 sq. feet
|
2 baths 2 beds |
show details | |

|
#36
Piedmont G # 311
Delray Beach, FL 33484
|
726 sq. feet
|
1 baths 1 beds |
show details | |

|
#37
Monterey Ln
Delray Beach, FL 33484
|
3,007 sq. feet
|
3 baths 3 beds |
show details | |

|
#38
Michelangelo Blvd Apt 204
Delray Beach, FL 33446
|
1,145 sq. feet
|
2 baths 2 beds |
show details | |

|
#39
Willowbrook Ln Apt 108
Delray Beach, FL 33446
|
1,005 sq. feet
|
2 baths 2 beds |
show details | |

|
#40
Brittany E
Delray Beach, FL 33446
|
883 sq. feet
|
2 baths 2 beds |
show details |
| Photo | Address | Area | Beds / Baths | Price | Details |
|---|---|---|---|---|---|

|
#41
Royale Sabal Ct
Delray Beach, FL 33484
|
1,669 sq. feet
|
2 baths 3 beds |
show details | |

|
#42
NW 22nd Ave
Delray Beach, FL 33445
|
1,245 sq. feet
|
2 baths 2 beds |
show details | |

|
#43
Saxony H
Delray Beach, FL 33446
|
883 sq. feet
|
2 baths 2 beds |
show details | |

|
#44
Isles Cay Dr
Delray Beach, FL 33446
|
2,297 sq. feet
|
2 baths 3 beds |
show details | |

|
#45
Red Hibiscus Blvd 34-D
Delray Beach, FL 33445
|
1,167 sq. feet
|
2 baths 2 beds |
show details | |

|
#46
N Seacrest Cir
Delray Beach, FL 33444
|
1,552 sq. feet
|
2 baths 4 beds |
show details | |

|
#47
Lindell Blvd Apt 3305
Delray Beach, FL 33444
|
1,175 sq. feet
|
2 baths 2 beds |
show details | |

|
#48
Linton Blvd Apt 216d
Delray Beach, FL 33445
|
1,085 sq. feet
|
2 baths 2 beds |
show details | |

|
#49
Monaco M
Delray Beach, FL 33446
|
726 sq. feet
|
1 baths 1 beds |
show details | |

|
Check over 1 million property listings on Foreclosure.com!
|
browse all offers | |||


Median year apartment built: 1987
Household type by relationship:
Households: 67,035- Male householders: 12,189 (3,787 living alone), Female householders: 14,499 (5,027 living alone)
11,543 spouses (11,318 opposite-sex spouses), 1,391 unmarried partners, (1,249 opposite-sex unmarried partners), 16,291 children (15,322 natural, 38 adopted, 931 stepchildren), 1,280 grandchildren, 2,214 brothers or sisters, 2,075 parents, 0 foster children, 1,150 other relatives, 3,663 non-relatives
- In group quarters: 740
Size of family households: 8,761 2-persons, 2,563 3-persons, 2,162 4-persons, 1,137 5-persons, 437 6-persons, 668 7-or-more-persons.
Size of nonfamily households: 8,814 1-person, 1,862 2-persons, 163 3-persons, 56 5-persons, 65 7-or-more-persons.
4,630 married couples with children.
2,275 single-parent households (333 men, 1,942 women).
68.8% of residents of Delray Beach speak English at home.
9.1% of residents speak Spanish at home (62% speak English very well, 17% speak English well, 13% speak English not well, 7% don't speak English at all).
21.1% of residents speak other Indo-European language at home (48% speak English very well, 19% speak English well, 24% speak English not well, 8% don't speak English at all).
1.3% of residents speak Asian or Pacific Island language at home (59% speak English very well, 20% speak English well, 16% speak English not well, 5% don't speak English at all).
0.5% of residents speak other language at home (89% speak English very well, 11% speak English well).
Foreign born population: 17,362 (25.9%)
(53.6% of them are naturalized citizens)
| Here: | 5.3 |
| State: | 5.9 |
| Here: | 3.9 |
| State: | 4.2 |
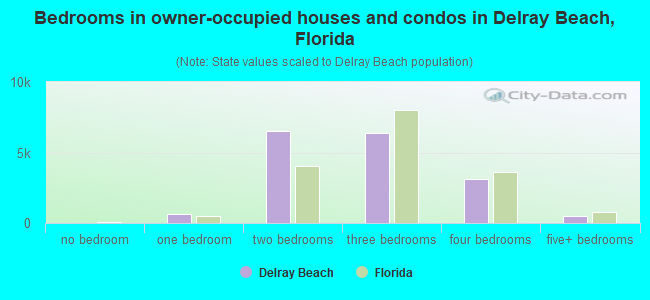
- Bedrooms in owner-occupied houses and condos in Delray Beach, Florida
- 0no bedroom
- 6211 bedroom
- 6,5102 bedrooms
- 6,3703 bedrooms
- 3,0914 bedrooms
- 5085+ bedrooms
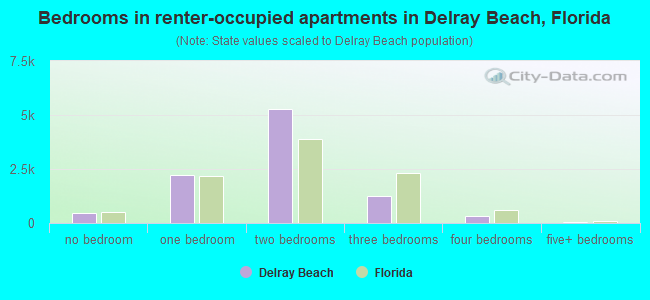
- Bedrooms in renter-occupied apartments in Delray Beach, Florida
- 463no bedroom
- 2,2031 bedroom
- 5,2712 bedrooms
- 1,2683 bedrooms
- 3294 bedrooms
- 545+ bedrooms
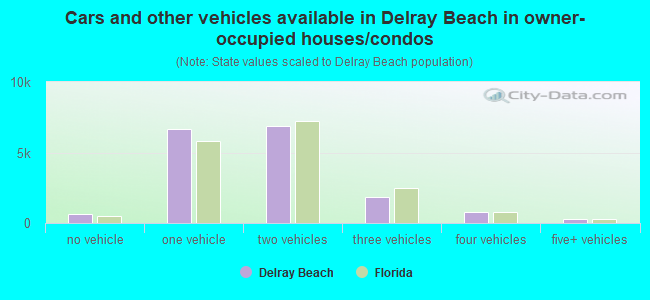
- Cars and other vehicles available in Delray Beach in owner-occupied houses/condos
- 628no vehicle
- 6,6791 vehicle
- 6,8962 vehicles
- 1,8243 vehicles
- 7604 vehicles
- 3135+ vehicles
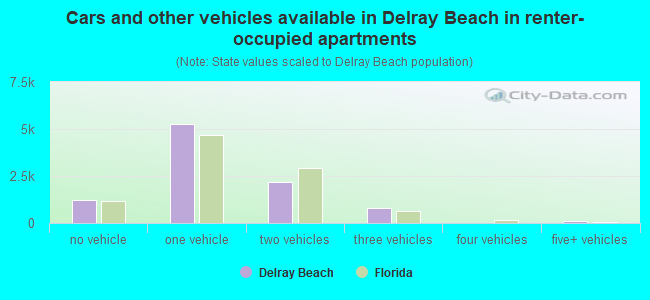
- Cars and other vehicles available in Delray Beach in renter-occupied apartments
- 1,208no vehicle
- 5,2511 vehicle
- 2,1972 vehicles
- 8113 vehicles
- 04 vehicles
- 1215+ vehicles
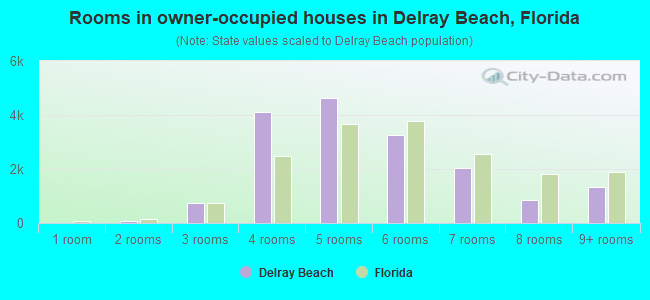
- Rooms in owner-occupied houses in Delray Beach, Florida
- 01 room
- 892 rooms
- 7523 rooms
- 4,1254 rooms
- 4,6445 rooms
- 3,2576 rooms
- 2,0417 rooms
- 8568 rooms
- 1,3369+ rooms
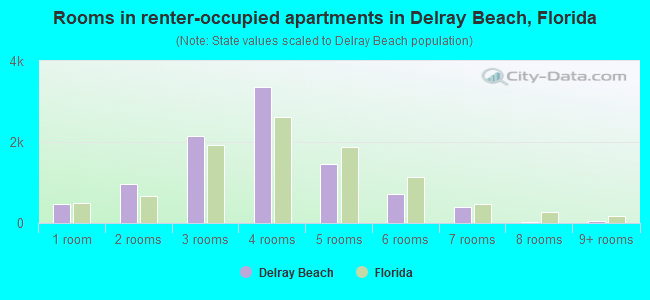
- Rooms in renter-occupied apartments in Delray Beach, Florida
- 4631 room
- 9592 rooms
- 2,1603 rooms
- 3,3544 rooms
- 1,4585 rooms
- 7126 rooms
- 3917 rooms
- 378 rooms
- 549+ rooms
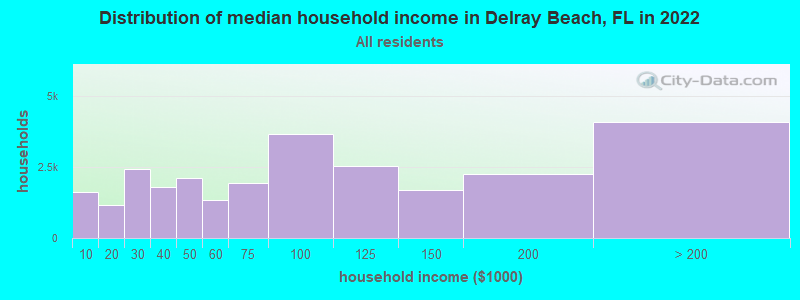
Delray Beach, FL household income distribution

- 1,626Less than $10,000
- 1,159$10,000 to $19,999
- 2,429$20,000 to $29,999
- 1,813$30,000 to $39,999
- 2,122$40,000 to $49,999
- 1,340$50,000 to $59,999
- 1,943$60,000 to $74,999
- 3,675$75,000 to $99,999
- 2,548$100,000 to $124,999
- 1,696$125,000 to $149,999
- 2,252$150,000 to $199,999
- 4,085$200,000 or more
Home value of owner - occupied houses in 2022 in Delray Beach, FL
-
- 123Less than $10,000
- 28$10,000 to $14,999
- 26$15,000 to $19,999
- 37$20,000 to $24,999
- 107$25,000 to $29,999
- 38$30,000 to $34,999
- 7$35,000 to $39,999
- 16$40,000 to $49,999
- 93$50,000 to $59,999
- 59$60,000 to $69,999
- 102$70,000 to $79,999
- 141$80,000 to $89,999
- 140$90,000 to $99,999
- 629$100,000 to $124,999
- 457$125,000 to $149,999
- 673$150,000 to $174,999
- 520$175,000 to $199,999
- 1,201$200,000 to $249,999
- 1,354$250,000 to $299,999
- 2,754$300,000 to $399,999
- 1,820$400,000 to $499,999
- 3,408$500,000 to $749,999
- 1,826$750,000 to $999,999
- 1,337$1,000,000 to $1,499,999
- 837$1,500,000 to $1,999,999
- 1,322$2,000,000 or more
Rent paid by renters in 2022 in Delray Beach, FL
-
- 43Less than $100
- 43$150 to $199
- 107$200 to $249
- 35$250 to $299
- 38$350 to $399
- 77$400 to $449
- 23$450 to $499
- 49$500 to $549
- 85$550 to $599
- 28$600 to $649
- 34$650 to $699
- 146$700 to $749
- 98$750 to $799
- 126$800 to $899
- 162$900 to $999
- 1,180$1,000 to $1,249
- 1,253$1,250 to $1,499
- 2,373$1,500 to $1,999
- 2,384$2,000 to $2,499
- 839$2,500 to $2,999
- 360$3,000 to $3,499
- 707$3,500 or more
- 457No cash rent

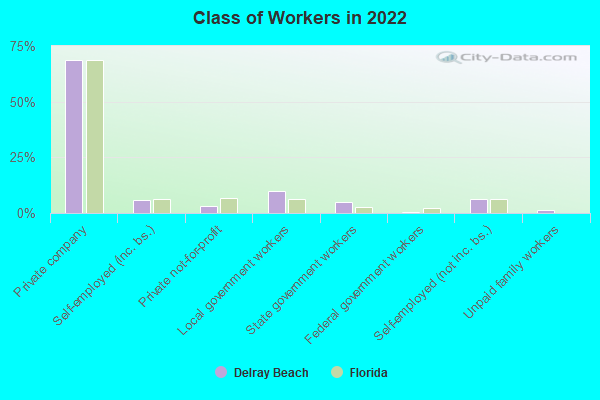
Percentage of workers working in this county: 90.6%
Number of people working at home: 6,813 (20.1% of all workers)
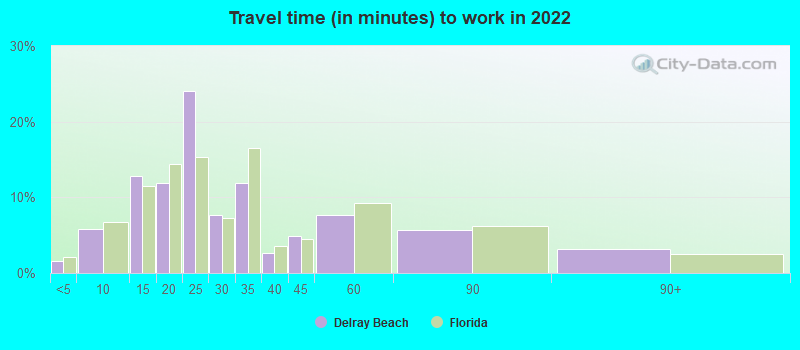
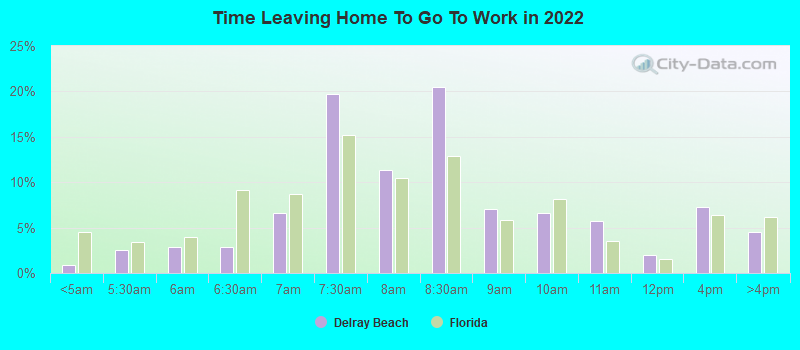
Travel time to work (commute)
- Less than 5 minutes: 212
- 5 to 9 minutes: 2,218
- 10 to 14 minutes: 4,087
- 15 to 19 minutes: 5,595
- 20 to 24 minutes: 5,608
- 25 to 29 minutes: 2,563
- 30 to 34 minutes: 3,015
- 35 to 39 minutes: 352
- 40 to 44 minutes: 505
- 45 to 59 minutes: 1,876
- 60 to 89 minutes: 233
- 90 or more minutes: 321
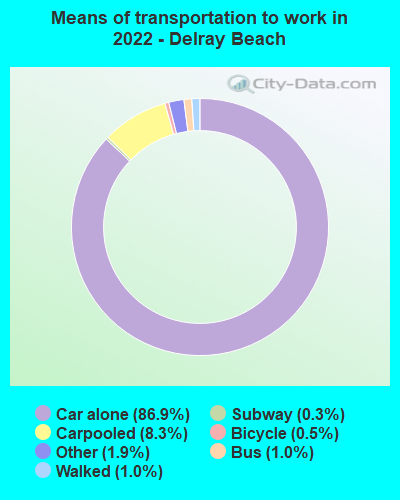
Means of transportation to work:
- Drove a car alone: 34,476 (74.5%)
- Carpooled: 3,136 (6.8%)
- Bus: 276 (0.6%)
- Long-distance train or commuter rail: 154 (0.3%)
- Light rail, streetcar or trolley: 10 (0.0%)
- Taxi: 892 (1.9%)
- Bicycle: 222 (0.5%)
- Walked: 440 (1.0%)
- Worked at home: 6,813 (14.7%)
- Unemployment by race in 2022
- Unemployment rate for White non-Hispanic residents
- 1.6%Males
- 5.5%Females
- Unemployment rate for Black residents
- 5.3%Males
- 9.8%Females
- Unemployment rate for American Indian and Alaska Native residents
- 55.0%Females
- Unemployment rate for Asian residents
- 1.8%Females
- Unemployment rate for other race residents
- 5.9%Males
- 5.0%Females
- Unemployment rate for two or more race residents
- 4.7%Males
- 1.4%Females
- Unemployment rate for Hispanic or Latino residents
- 5.4%Males
- 3.2%Females
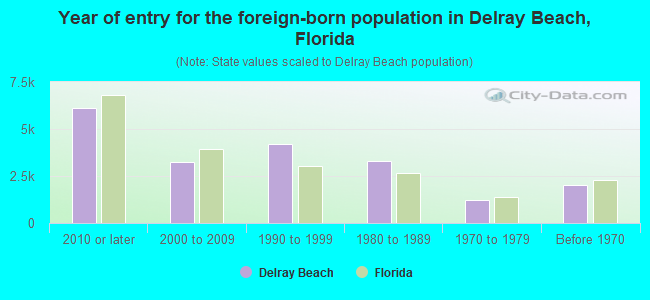
- Year of entry for the foreign-born population in Delray Beach, Florida
- 6,1272010 or later
- 3,2312000 to 2009
- 4,1951990 to 1999
- 3,3041980 to 1989
- 1,2311970 to 1979
- 2,037Before 1970

First ancestries reported:
- Haitian: 9,384 (22.4%)
- Italian: 3,357 (8.0%)
- American: 3,102 (7.4%)
- Irish: 1,846 (4.4%)
- German: 1,186 (2.8%)
- English: 1,145 (2.7%)
- Polish: 1,012 (2.4%)
- Eastern European: 729 (1.7%)
- European: 695 (1.7%)
- Russian: 541 (1.3%)
- Jamaican: 477 (1.1%)
- Brazilian: 435 (1.0%)
- French: 392 (0.9%)
- Portuguese: 330 (0.8%)
- Greek: 221 (0.5%)
- Hungarian: 216 (0.5%)
- French Canadian: 199 (0.5%)
- Norwegian: 187 (0.4%)
- Ukrainian: 187 (0.4%)
- Scotch-Irish: 185 (0.4%)
- Scottish: 169 (0.4%)
- British: 155 (0.4%)
- African: 147 (0.4%)
- Danish: 140 (0.3%)
- Canadian: 101 (0.2%)
- Czech: 94 (0.2%)
- Lithuanian: 93 (0.2%)
- Iranian: 86 (0.2%)
- Israeli: 86 (0.2%)
- Romanian: 83 (0.2%)
- Austrian: 72 (0.2%)
- Lebanese: 58 (0.1%)
- Welsh: 57 (0.1%)
- Finnish: 54 (0.1%)
- Trinidadian and Tobagonian: 52 (0.1%)
- Moroccan: 50 (0.1%)
- Turkish: 48 (0.1%)
- Swedish: 41 (0.10%)
- Serbian: 39 (0.09%)
- Dutch: 36 (0.09%)
- Bulgarian: 36 (0.09%)
- Slovak: 32 (0.08%)
- Egyptian: 30 (0.07%)
- Latvian: 30 (0.07%)
- Armenian: 30 (0.07%)
- Albanian: 29 (0.07%)
- Kenyan: 27 (0.06%)
- Croatian: 26 (0.06%)
- Swiss: 21 (0.05%)
- U.S. Virgin Islander: 21 (0.05%)
- Slovene: 17 (0.04%)
- Northern European: 11 (0.03%)
- Belgian: 11 (0.03%)
- Celtic: 9 (0.02%)
- Macedonian: 8 (0.02%)
- New Zealander: 8 (0.02%)
- Scandinavian: 7 (0.02%)
- Guyanese: 6 (0.01%)
- South African: 6 (0.01%)
- Luxembourger: 5 (0.01%)
- Arab: 4 (0.01%)
Most common places of birth for foreign-born residents (%):
| Delray Beach: | 50.4% (8,718) |
| Florida: | 7.5% (342,375) |
| Delray Beach: | 4.7% (816) |
| Florida: | 5.0% (227,319) |
| Delray Beach: | 4.2% (734) |
| Florida: | 2.7% (122,906) |
| Delray Beach: | 3.9% (679) |
| Florida: | 5.7% (262,042) |
| Delray Beach: | 3.0% (516) |
| Florida: | 2.1% (96,693) |
| Delray Beach: | 2.7% (467) |
| Florida: | 2.4% (109,132) |
| Delray Beach: | 2.4% (415) |
| Florida: | 6.5% (298,669) |
| Delray Beach: | 2.2% (380) |
| Florida: | 5.6% (257,152) |
| Delray Beach: | 1.8% (305) |
| Florida: | 1.8% (84,403) |
Place of birth for U.S.-born residents:
- This state: 20,424
- Other state: 27,418
- Northeast: 16,415
- Midwest: 4,926
- South: 4,712
- West: 1,365
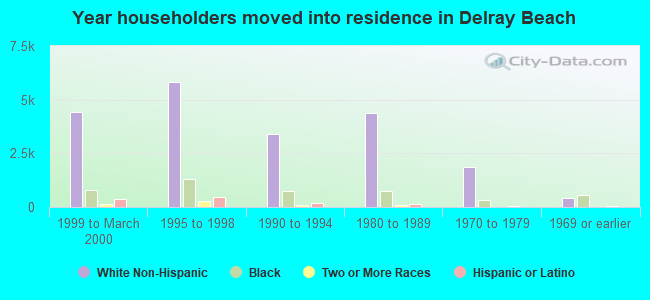
89.5% of Delray Beach residents lived in the same house 1 years ago.
Out of people who lived in different houses, 28.9% lived in this county.
Out of people who lived in different counties, 25.0% lived in Florida.
| Delray Beach: | 89.5% |
| State average: | 86.3% |
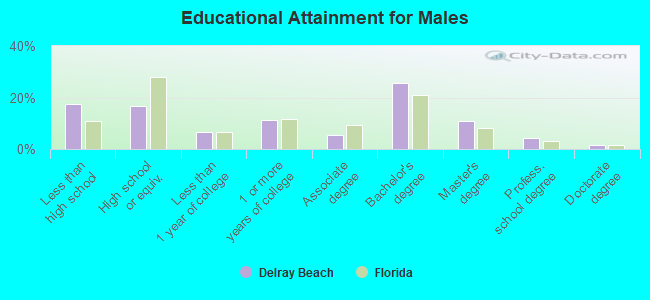
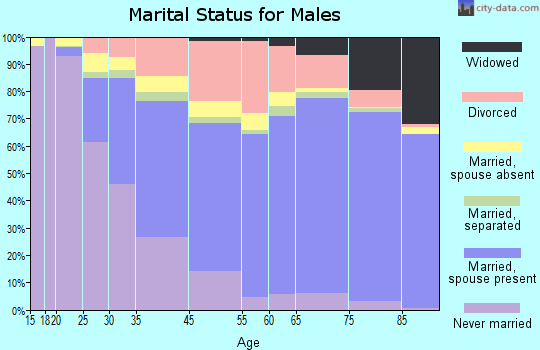
Education attainment for males 25 years and older:
- No schooling: 510
- Nursery to 4th grade: 70
- 5th and 6th grade: 551
- 7th and 8th grade: 268
- 9th grade: 212
- 10th grade: 372
- 11th grade: 338
- 12th grade, no diploma: 2,036
- High school graduate (or equivalency): 4,233
- Less than 1 year of college: 1,649
- Some college more than 1 year, no degree: 2,800
- Associate degree: 1,345
- Bachelor's degree: 6,459
- Master's degree: 2,706
- Professional school degree: 1,117
- Doctorate degree: 426
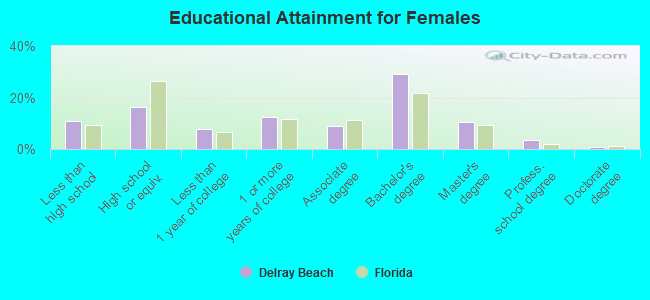
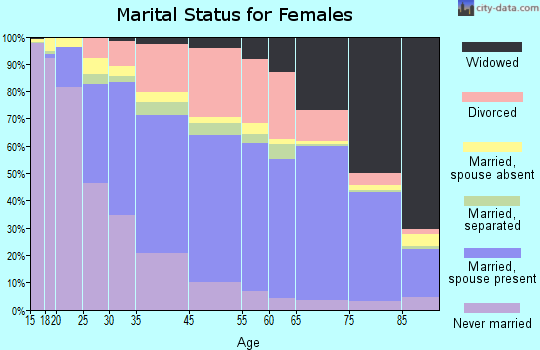
Education attainment for females 25 years and older:
- No schooling: 584
- Nursery to 4th grade: 182
- 5th and 6th grade: 940
- 7th and 8th grade: 0
- 9th grade: 200
- 10th grade: 156
- 11th grade: 783
- 12th grade, no diploma: 189
- High school graduate (or equivalency): 4,463
- Less than 1 year of college: 2,115
- Some college more than 1 year, no degree: 3,372
- Associate degree: 2,429
- Bachelor's degree: 7,973
- Master's degree: 2,864
- Professional school degree: 991
- Doctorate degree: 200
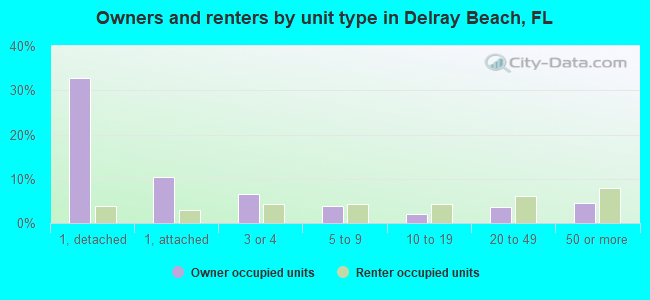
Housing units in structures:
- One, detached: 11,214
- One, attached: 4,639
- Two: 701
- 3 or 4: 3,822
- 5 to 9: 2,785
- 10 to 19: 2,934
- 20 to 49: 3,644
- 50 or more: 3,669
- Mobile homes: 318
Housing units lacking complete kitchen facilities in 2022: 0.6%
House/condo owner moved in on average 8 years ago
Renter moved in on average 3 years ago
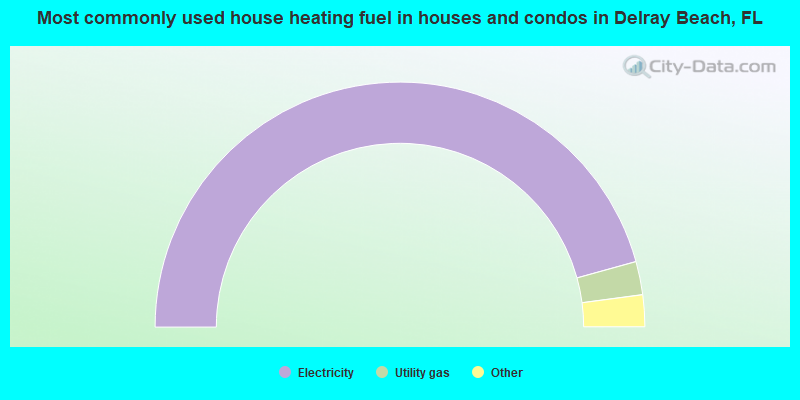
- 91.4%Electricity
- 4.4%Utility gas
- 3.0%No fuel used
- 1.0%Bottled, tank, or LP gas
- 0.2%Solar energy
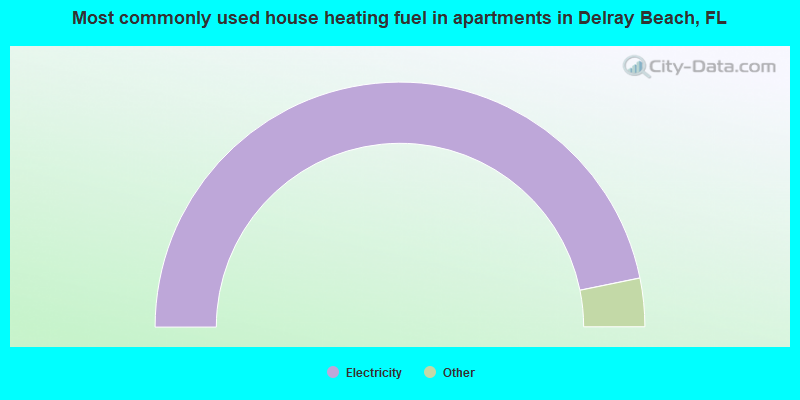
- 93.6%Electricity
- 3.2%Utility gas
- 3.0%No fuel used
- 0.3%Bottled, tank, or LP gas
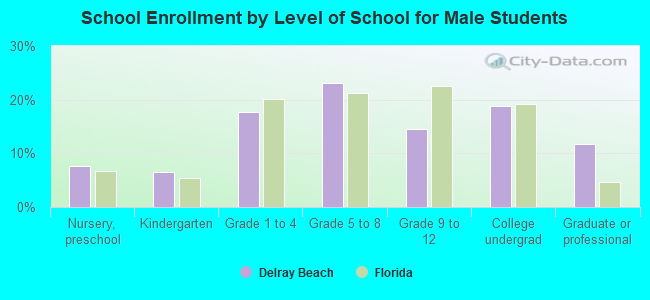
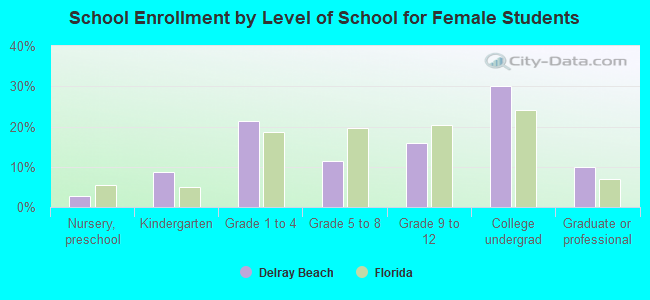
Private vs. public school enrollment:
| Here: | 7.3% |
| Florida: | 15.8% |
| Here: | 22.3% |
| Florida: | 12.9% |
| Here: | 20.5% |
| Florida: | 23.6% |