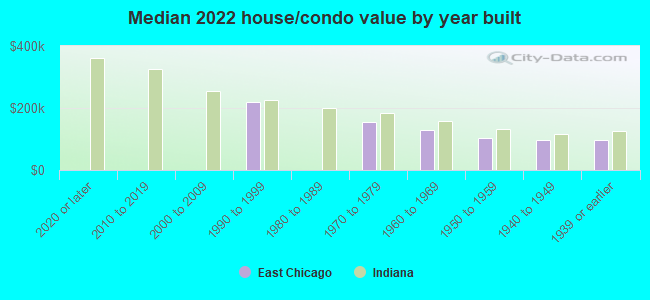
East Chicago, IN (Indiana) Houses and Residents
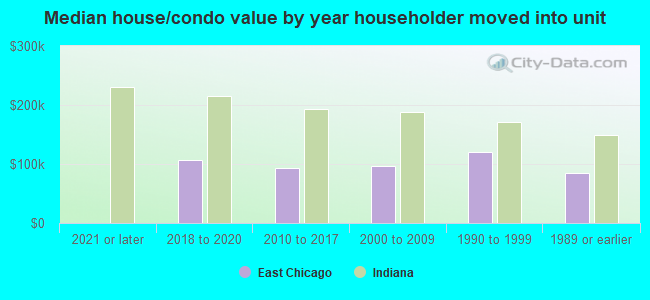
| East Chicago: | $97,998 |
| Indiana: | $208,700 |
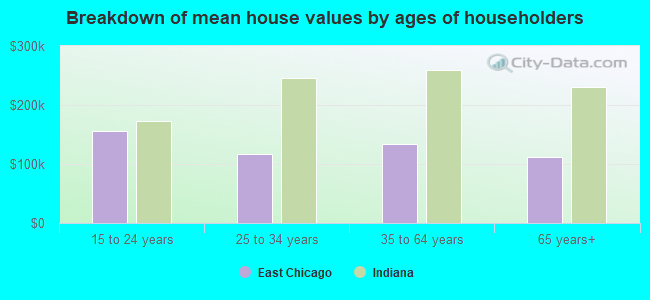
Mean price in 2022:
Detached houses: $136,330
Here: $136,330 State: $257,916 Townhouses or other attached units: $101,493
Here: $101,493 State: $224,114 In 2-unit structures: $126,134
Here: $126,134 State: $175,375 In 3-to-4-unit structures: $134,740
Here: $134,740 State: $151,116 In 5-or-more-unit structures: $196,356
Here: $196,356 State: $200,844
Total population: 28,990 (All urban)
Houses: 12,901 (10,260 occupied: 4,500 owner occupied, 5,768 renter occupied)
| % of renters here: | 56% |
| State: | 29% |
Housing density: 1,077 houses/condos per square mile
Median price asked for vacant for-sale houses and condos in 2022: $127,153.
Median contract rent in 2022: $575 (lower quartile is $403, upper quartile is $740)
Median rent asked for vacant for-rent units in 2022: $454
Median gross rent in East Chicago, IN in 2022: $779
Housing units in East Chicago with a mortgage: 1,789 (124 second mortgage, 0 home equity loan, 49 both second mortgage and home equity loan)
Houses without a mortgage: 107
Median household income for houses/condos with a mortgage: $67,346
Median household income for apartments without a mortgage: $51,197
Median monthly housing costs: $690
Compare current foreclosures in East Chicago, IN:
| Photo | Address | Area | Beds / Baths | Price | Details |
|---|---|---|---|---|---|

|
#1
Homerlee Ave
East Chicago, IN 46312
|
722 sq. feet
|
2 baths 2 beds |
show details | |

|
#2
Catalpa St
East Chicago, IN 46312
|
2,331 sq. feet
|
3 baths 5 beds |
show details | |

|
#3
Parrish Ave
East Chicago, IN 46312
|
840 sq. feet
|
1 baths 2 beds |
show details | |

|
#4
E 141st St
East Chicago, IN 46312
|
1,524 sq. feet
|
1 baths 3 beds |
show details | |

|
#5
Baring Ave
East Chicago, IN 46312
|
3,162 sq. feet
|
1 baths 3 beds |
show details | |

|
#6
Drummond St
East Chicago, IN 46312
|
2,625 sq. feet
|
1 baths 3 beds |
show details | |

|
#7
Block Ave
East Chicago, IN 46312
|
1,680 sq. feet
|
1 baths 3 beds |
show details | |

|
#8
Walsh Ave
East Chicago, IN 46312
|
1,904 sq. feet
|
1 baths 3 beds |
show details | |

|
#9
W 145th St
East Chicago, IN 46312
|
2,107 sq. feet
|
2 baths 3 beds |
show details | |

|
#10
Butternut St
East Chicago, IN 46312
|
2,580 sq. feet
|
2 baths 4 beds |
show details |
| Photo | Address | Area | Beds / Baths | Price | Details |
|---|---|---|---|---|---|

|
#11
Elm St
East Chicago, IN 46312
|
1,518 sq. feet
|
1 baths 3 beds |
show details | |

|
#12
W 151st St
East Chicago, IN 46312
|
1,980 sq. feet
|
4 baths 8 beds |
show details | |

|
#13
Ivy St
East Chicago, IN 46312
|
2,754 sq. feet
|
3 baths 3 beds |
show details | |

|
#14
W Guadalupe Cir
East Chicago, IN 46312
|
1,576 sq. feet
|
1 baths 3 beds |
show details | |

|
#15
Wegg Ave
East Chicago, IN 46312
|
1,680 sq. feet
|
1 baths 3 beds |
show details | |

|
#16
Olcott Ave # 1
East Chicago, IN 46312
|
3,822 sq. feet
|
2 baths 6 beds |
show details | |

|
#17
Mccook Ave
East Chicago, IN 46312
|
740 sq. feet
|
1 baths 2 beds |
show details | |

|
#18
Main St # 1f
East Chicago, IN 46312
|
2,520 sq. feet
|
1 baths 4 beds |
show details | |

|
#19
Beacon St
East Chicago, IN 46312
|
2,964 sq. feet
|
1 baths 3 beds |
show details | |

|
#20
Ivy St
East Chicago, IN 46312
|
2,520 sq. feet
|
1 baths 2 beds |
show details |
| Photo | Address | Area | Beds / Baths | Price | Details |
|---|---|---|---|---|---|

|
#21
Ivy St
East Chicago, IN 46312
|
3,655 sq. feet
|
4 baths 4 beds |
show details | |

|
#22
Euclid Ave
East Chicago, IN 46312
|
2,162 sq. feet
|
1 baths 3 beds |
show details | |

|
#23
Grand Blvd
East Chicago, IN 46312
|
1,632 sq. feet
|
2 baths 3 beds |
show details | |

|
#24
Parrish Ave
East Chicago, IN 46312
|
1,900 sq. feet
|
1 baths 2 beds |
show details | |

|
#25
W 151st St
East Chicago, IN 46312
|
2,829 sq. feet
|
2 baths 6 beds |
show details | |

|
#26
Baring Ave
East Chicago, IN 46312
|
1,015 sq. feet
|
5 baths 6 beds |
show details | |

|
#27
Catalpa St
East Chicago, IN 46312
|
1,632 sq. feet
|
1 baths 3 beds |
show details | |

|
#28
Olcott Ave Apt 1
East Chicago, IN 46312
|
2,693 sq. feet
|
2 baths 4 beds |
show details | |

|
#29
Olcott Ave
East Chicago, IN 46312
|
3,396 sq. feet
|
1 baths 4 beds |
show details | |

|
#30
Magoun Ave
East Chicago, IN 46312
|
2,694 sq. feet
|
1 baths 4 beds |
show details |
| Photo | Address | Area | Beds / Baths | Price | Details |
|---|---|---|---|---|---|

|
#31
Hemlock St
East Chicago, IN 46312
|
2,300 sq. feet
|
1 baths 3 beds |
show details | |

|
#32
Fir St
East Chicago, IN 46312
|
2,550 sq. feet
|
2 baths 4 beds |
show details | |

|
#33
Ivy St
East Chicago, IN 46312
|
2,200 sq. feet
|
1 baths 3 beds |
show details | |

|
#34
Euclid Ave
East Chicago, IN 46312
|
1,632 sq. feet
|
1 baths 2 beds |
show details | |

|
#35
Wegg Ave
East Chicago, IN 46312
|
2,200 sq. feet
|
1 baths 3 beds |
show details | |

|
#36
Baring Ave
East Chicago, IN 46312
|
1,500 sq. feet
|
1 baths 2 beds |
show details | |

|
#37
Tod Ave
East Chicago, IN 46312
|
1,056 sq. feet
|
1 baths 3 beds |
show details | |

|
#38
Riley Rd
East Chicago, IN 46312
|
1,848 sq. feet
|
1 baths 4 beds |
show details | |

|
#39
Fir St # 3s
East Chicago, IN 46312
|
4,956 sq. feet
|
2 baths 4 beds |
show details | |

|
#40
Alder St
East Chicago, IN 46312
|
1,232 sq. feet
|
3 baths 6 beds |
show details |
| Photo | Address | Area | Beds / Baths | Price | Details |
|---|---|---|---|---|---|

|
#41
Drummond St
East Chicago, IN 46312
|
3,171 sq. feet
|
1 baths 4 beds |
show details | |

|
#42
Catalpa St
East Chicago, IN 46312
|
888 sq. feet
|
1 baths 2 beds |
show details | |

|
#43
Euclid Ave
East Chicago, IN 46312
|
2,006 sq. feet
|
1 baths 2 beds |
show details | |

|
#44
Olcott Ave
East Chicago, IN 46312
|
2,820 sq. feet
|
2 baths 6 beds |
show details | |

|
#45
Pennsylvania Ave
East Chicago, IN 46312
|
1,920 sq. feet
|
1 baths 3 beds |
show details | |

|
#46
Kennedy Ave
East Chicago, IN 46312
|
2,359 sq. feet
|
1 baths 3 beds |
show details | |

|
#47
Grand Blvd
East Chicago, IN 46312
|
1,792 sq. feet
|
5 baths 10 beds |
show details | |

|
#48
Dearborn St
East Chicago, IN 46312
|
1,744 sq. feet
|
1 baths 3 beds |
show details | |

|
#49
Indianapolis Blvd
East Chicago, IN 46312
|
2,472 sq. feet
|
1 baths 3 beds |
show details | |

|
Check over 1 million property listings on Foreclosure.com!
|
browse all offers | |||


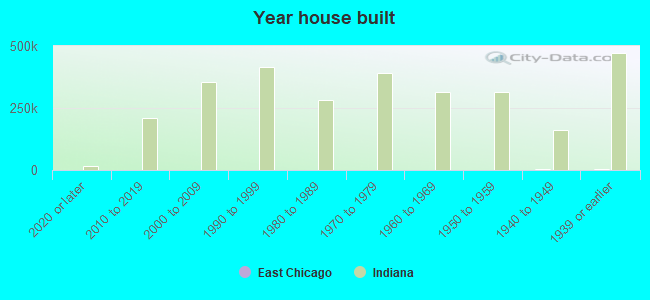
Median year apartment built: 1945
Household type by relationship:
Households: 26,469- Male householders: 4,486 (1,707 living alone), Female householders: 5,701 (2,020 living alone)
2,572 spouses (2,543 opposite-sex spouses), 888 unmarried partners, (877 opposite-sex unmarried partners), 9,380 children (8,710 natural, 307 adopted, 362 stepchildren), 810 grandchildren, 518 brothers or sisters, 546 parents, 11 foster children, 656 other relatives, 781 non-relatives
- In group quarters: 116
Size of family households: 2,123 2-persons, 1,444 3-persons, 1,195 4-persons, 513 5-persons, 416 6-persons, 245 7-or-more-persons.
Size of nonfamily households: 3,820 1-person, 418 2-persons, 104 3-persons, 5 4-persons, 15 5-persons.
1,959 married couples with children.
3,424 single-parent households (497 men, 2,927 women).
60.8% of residents of East Chicago speak English at home.
39.0% of residents speak Spanish at home (63% speak English very well, 20% speak English well, 11% speak English not well, 6% don't speak English at all).
0.3% of residents speak other Indo-European language at home (100% speak English very well).
0.1% of residents speak Asian or Pacific Island language at home (4% speak English very well, 96% speak English well).
0.1% of residents speak other language at home (100% speak English very well).
Foreign born population: 4,303 (16.3%)
(31.9% of them are naturalized citizens)
| Here: | 6.1 |
| State: | 6.6 |
| Here: | 4.3 |
| State: | 4.3 |
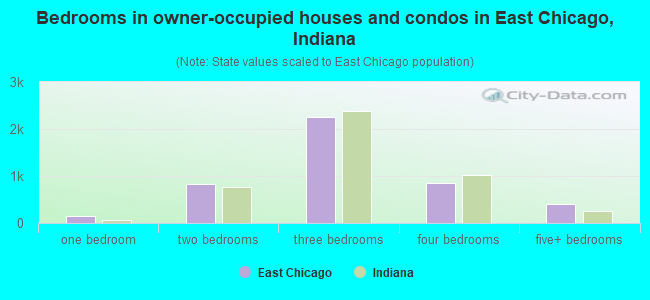
- Bedrooms in owner-occupied houses and condos in East Chicago, Indiana
- 19no bedroom
- 1401 bedroom
- 8272 bedrooms
- 2,2563 bedrooms
- 8514 bedrooms
- 4085+ bedrooms
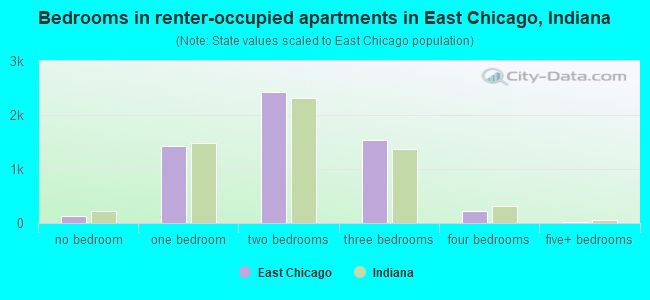
- Bedrooms in renter-occupied apartments in East Chicago, Indiana
- 123no bedroom
- 1,4301 bedroom
- 2,4342 bedrooms
- 1,5323 bedrooms
- 2254 bedrooms
- 245+ bedrooms
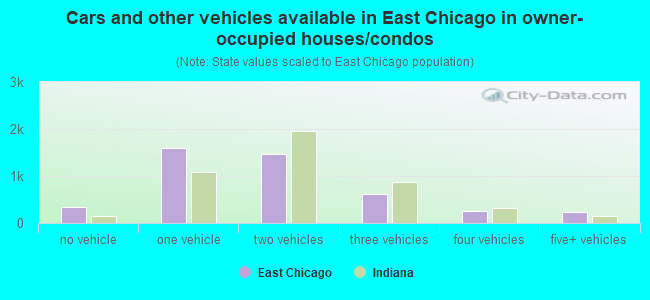
- Cars and other vehicles available in East Chicago in owner-occupied houses/condos
- 347no vehicle
- 1,5861 vehicle
- 1,4632 vehicles
- 6173 vehicles
- 2454 vehicles
- 2425+ vehicles
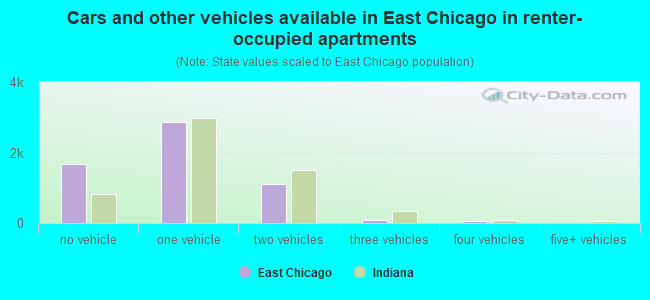
- Cars and other vehicles available in East Chicago in renter-occupied apartments
- 1,669no vehicle
- 2,8691 vehicle
- 1,0952 vehicles
- 853 vehicles
- 474 vehicles
- 45+ vehicles
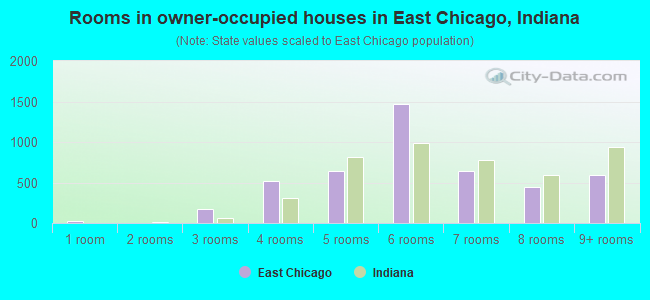
- Rooms in owner-occupied houses in East Chicago, Indiana
- 191 room
- 02 rooms
- 1673 rooms
- 5224 rooms
- 6385 rooms
- 1,4706 rooms
- 6427 rooms
- 4498 rooms
- 5949+ rooms
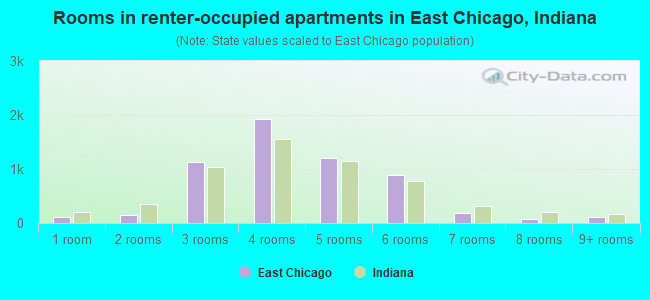
- Rooms in renter-occupied apartments in East Chicago, Indiana
- 1201 room
- 1392 rooms
- 1,1223 rooms
- 1,9284 rooms
- 1,2035 rooms
- 8906 rooms
- 1807 rooms
- 828 rooms
- 1049+ rooms
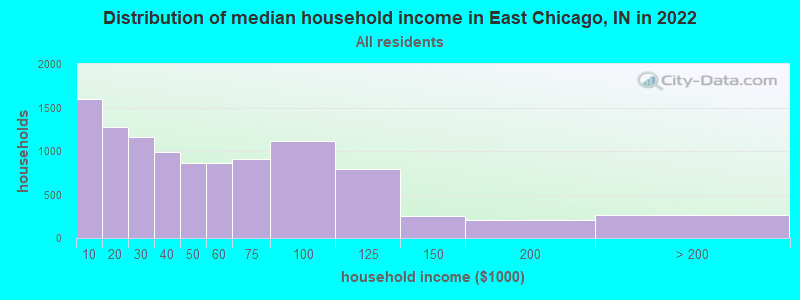
East Chicago, IN household income distribution

- 1,597Less than $10,000
- 1,276$10,000 to $19,999
- 1,161$20,000 to $29,999
- 990$30,000 to $39,999
- 864$40,000 to $49,999
- 864$50,000 to $59,999
- 905$60,000 to $74,999
- 1,111$75,000 to $99,999
- 790$100,000 to $124,999
- 251$125,000 to $149,999
- 212$150,000 to $199,999
- 268$200,000 or more
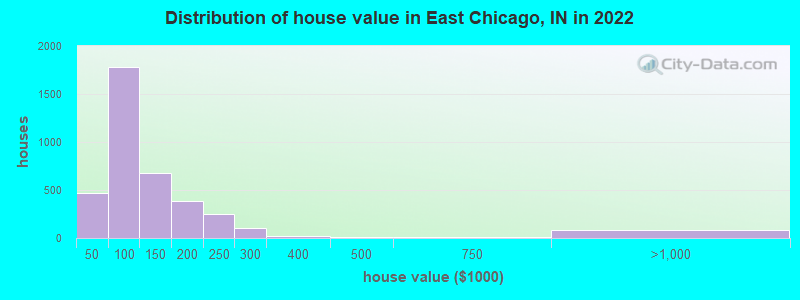
Home value of owner - occupied houses in 2022 in East Chicago, IN
-
- 67Less than $10,000
- 34$10,000 to $14,999
- 47$20,000 to $24,999
- 113$30,000 to $34,999
- 15$35,000 to $39,999
- 187$40,000 to $49,999
- 343$50,000 to $59,999
- 356$60,000 to $69,999
- 351$70,000 to $79,999
- 326$80,000 to $89,999
- 211$90,000 to $99,999
- 440$100,000 to $124,999
- 238$125,000 to $149,999
- 252$150,000 to $174,999
- 128$175,000 to $199,999
- 248$200,000 to $249,999
- 103$250,000 to $299,999
- 16$300,000 to $399,999
- 13$400,000 to $499,999
- 12$500,000 to $749,999
- 69$750,000 to $999,999
- 11$1,500,000 to $1,999,999
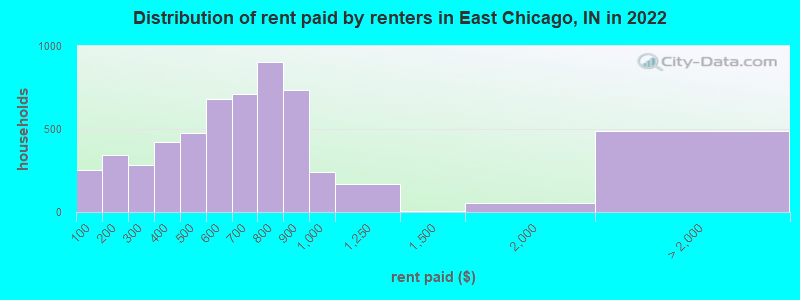
Rent paid by renters in 2022 in East Chicago, IN
-
- 251Less than $100
- 174$100 to $149
- 167$150 to $199
- 56$200 to $249
- 225$250 to $299
- 191$300 to $349
- 228$350 to $399
- 123$400 to $449
- 351$450 to $499
- 177$500 to $549
- 502$550 to $599
- 350$600 to $649
- 359$650 to $699
- 547$700 to $749
- 354$750 to $799
- 735$800 to $899
- 241$900 to $999
- 171$1,000 to $1,249
- 3$1,250 to $1,499
- 55$1,500 to $1,999
- 486No cash rent
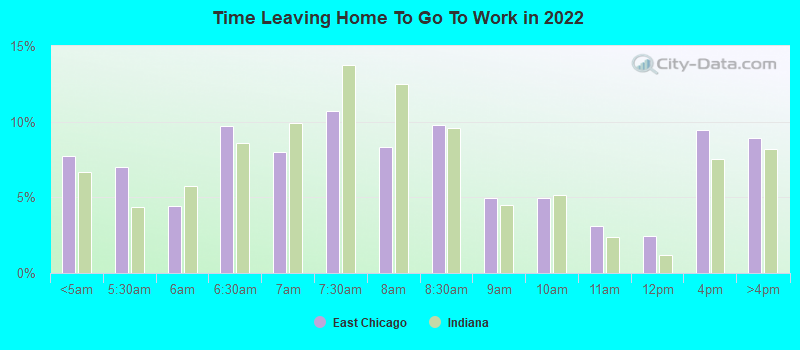
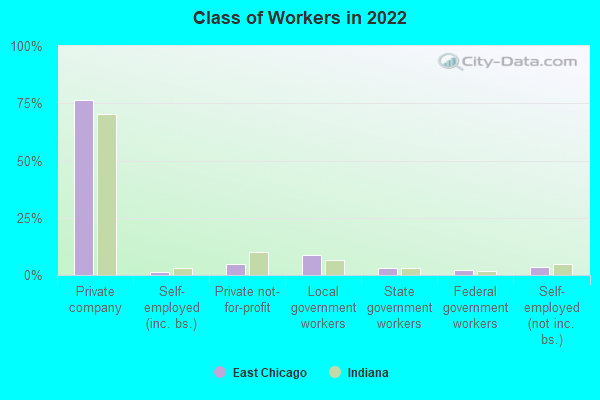
Percentage of workers working in this county: 76.6%
Number of people working at home: 625 (5.8% of all workers)

Travel time to work (commute)
- Less than 5 minutes: 127
- 5 to 9 minutes: 1,773
- 10 to 14 minutes: 1,519
- 15 to 19 minutes: 1,629
- 20 to 24 minutes: 1,355
- 25 to 29 minutes: 372
- 30 to 34 minutes: 1,637
- 35 to 39 minutes: 195
- 40 to 44 minutes: 140
- 45 to 59 minutes: 727
- 60 to 89 minutes: 586
- 90 or more minutes: 66
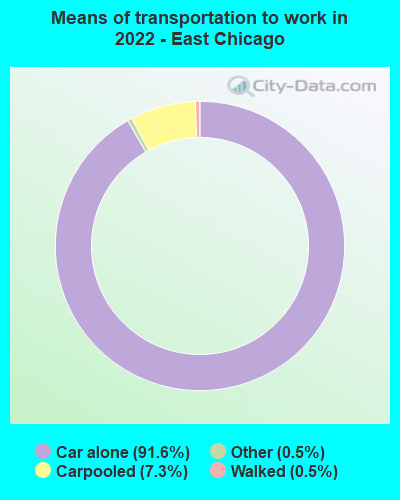
Means of transportation to work:
- Drove a car alone: 12,229 (84.1%)
- Carpooled: 1,152 (7.9%)
- Bus: 5 (0.0%)
- Taxi: 64 (0.4%)
- Bicycle: 18 (0.1%)
- Walked: 72 (0.5%)
- Worked at home: 625 (4.3%)
- Unemployment by race in 2022
- Unemployment rate for White non-Hispanic residents
- 2.6%Males
- 11.0%Females
- Unemployment rate for Black residents
- 9.2%Males
- 3.9%Females
- Unemployment rate for other race residents
- 3.9%Males
- 3.8%Females
- Unemployment rate for two or more race residents
- 5.6%Males
- 7.0%Females
- Unemployment rate for Hispanic or Latino residents
- 4.2%Males
- 5.0%Females
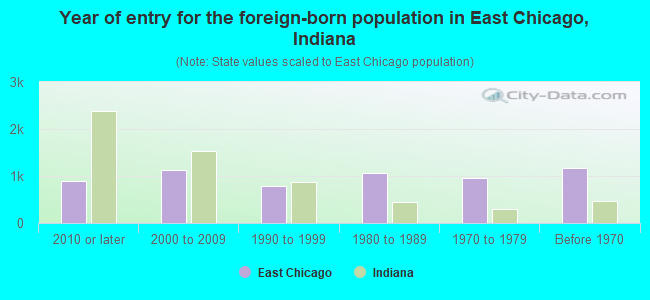
- Year of entry for the foreign-born population in East Chicago, Indiana
- 8982010 or later
- 1,1332000 to 2009
- 7901990 to 1999
- 1,0631980 to 1989
- 9521970 to 1979
- 1,171Before 1970
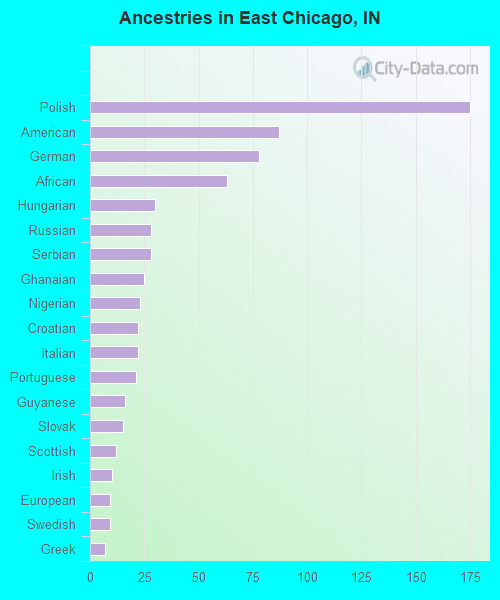
First ancestries reported:
- Polish: 175 (1.2%)
- American: 87 (0.6%)
- German: 78 (0.5%)
- African: 63 (0.4%)
- Hungarian: 30 (0.2%)
- Russian: 28 (0.2%)
- Serbian: 28 (0.2%)
- Ghanaian: 25 (0.2%)
- Nigerian: 23 (0.2%)
- Croatian: 22 (0.2%)
- Italian: 22 (0.2%)
- Portuguese: 21 (0.1%)
- Guyanese: 16 (0.1%)
- Slovak: 15 (0.1%)
- Scottish: 12 (0.08%)
- Irish: 10 (0.07%)
- European: 9 (0.06%)
- Swedish: 9 (0.06%)
- Greek: 7 (0.05%)
Most common places of birth for foreign-born residents (%):
| East Chicago: | 78.8% (3,499) |
| Indiana: | 27.0% (101,996) |
| East Chicago: | 3.7% (166) |
| Indiana: | 1.6% (5,892) |
| East Chicago: | 3.6% (158) |
| Indiana: | 2.2% (8,253) |
| East Chicago: | 3.0% (133) |
| Indiana: | 2.3% (8,656) |
| East Chicago: | 2.2% (99) |
| Indiana: | 0.4% (1,509) |
Place of birth for U.S.-born residents:
- This state: 13,253
- Other state: 8,190
- Northeast: 144
- Midwest: 6,008
- South: 1,709
- West: 192
88.7% of East Chicago residents lived in the same house 1 years ago.
Out of people who lived in different houses, 28.9% lived in this county.
Out of people who lived in different counties, 42.9% lived in Indiana.
| East Chicago: | 88.7% |
| State average: | 87.1% |
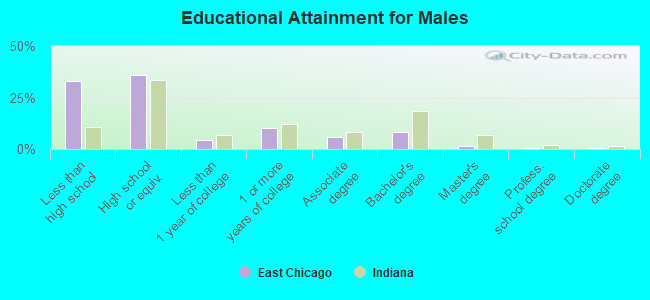
Education attainment for males 25 years and older:
- No schooling: 857
- Nursery to 4th grade: 181
- 5th and 6th grade: 316
- 7th and 8th grade: 231
- 9th grade: 290
- 10th grade: 124
- 11th grade: 117
- 12th grade, no diploma: 631
- High school graduate (or equivalency): 2,977
- Less than 1 year of college: 372
- Some college more than 1 year, no degree: 862
- Associate degree: 487
- Bachelor's degree: 674
- Master's degree: 135
- Professional school degree: 43
- Doctorate degree: 26
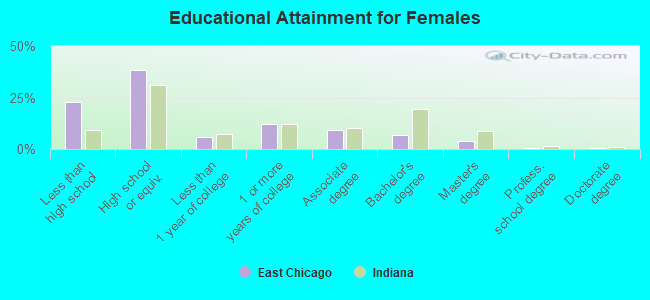
Education attainment for females 25 years and older:
- No schooling: 277
- Nursery to 4th grade: 83
- 5th and 6th grade: 290
- 7th and 8th grade: 246
- 9th grade: 144
- 10th grade: 347
- 11th grade: 316
- 12th grade, no diploma: 358
- High school graduate (or equivalency): 3,454
- Less than 1 year of college: 513
- Some college more than 1 year, no degree: 1,079
- Associate degree: 828
- Bachelor's degree: 612
- Master's degree: 350
- Professional school degree: 43
- Doctorate degree: 31
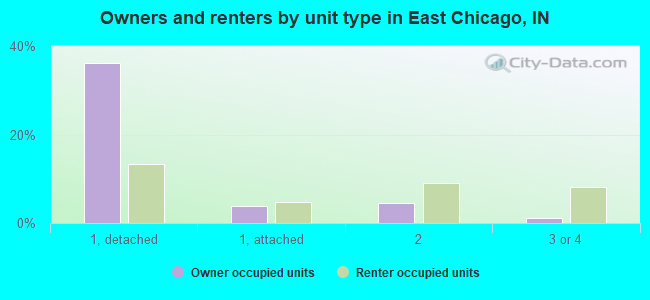
Housing units in structures:
- One, detached: 5,411
- One, attached: 1,013
- Two: 1,678
- 3 or 4: 1,719
- 5 to 9: 1,638
- 10 to 19: 560
- 20 to 49: 185
- 50 or more: 655
- Mobile homes: 39
Housing units lacking complete kitchen facilities in 2022: 7.7%
House/condo owner moved in on average 18 years ago
Renter moved in on average 3 years ago

- 93.8%Utility gas
- 4.7%Electricity
- 1.3%Bottled, tank, or LP gas
- 0.2%No fuel used
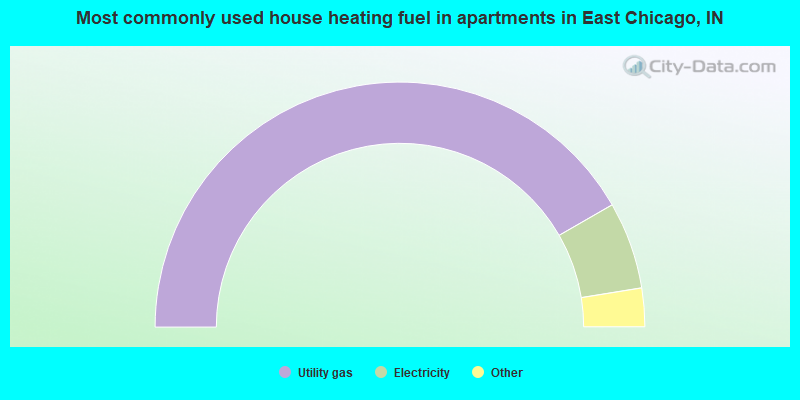
- 83.4%Utility gas
- 11.5%Electricity
- 3.8%No fuel used
- 0.8%Bottled, tank, or LP gas
- 0.3%Fuel oil, kerosene, etc.
- 0.2%Other fuel
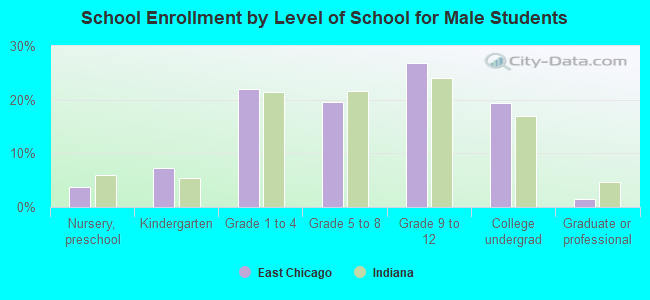
Private vs. public school enrollment:
| Here: | 9.9% |
| Indiana: | 14.9% |
| Here: | 6.7% |
| Indiana: | 11.4% |
| Here: | 42.4% |
| Indiana: | 22.3% |