Housing density: 149 houses/condos per square mile
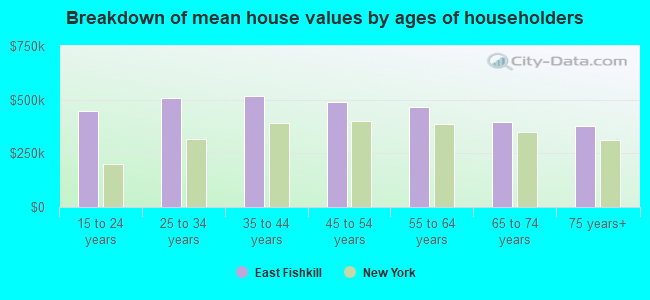
Median price asked for vacant for-sale houses and condos in 2022 in this county: $304,174.
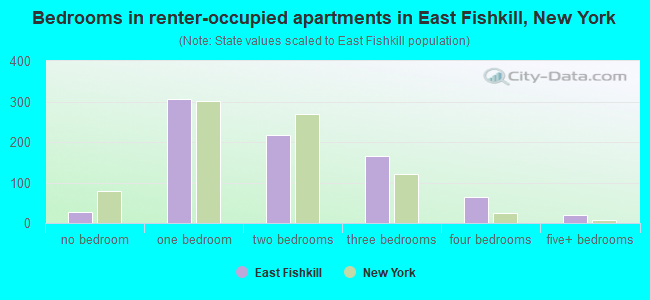
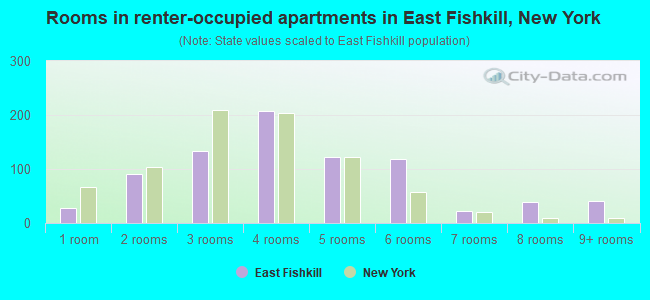
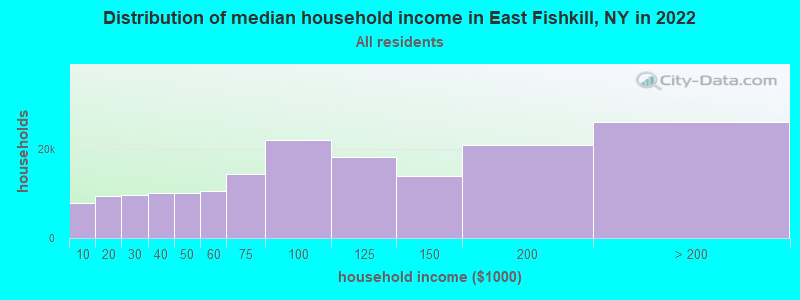
Median contract rent in 2022: $1,319 (lower quartile is $971, upper quartile is $1,911)
Median rent asked for vacant for-rent units in 2022: $1,323
Median gross rent in East Fishkill, NY in 2022: $1,462
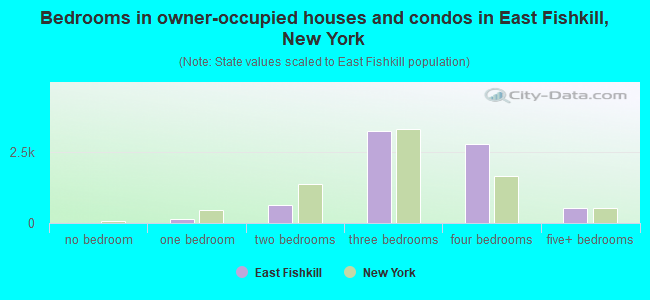
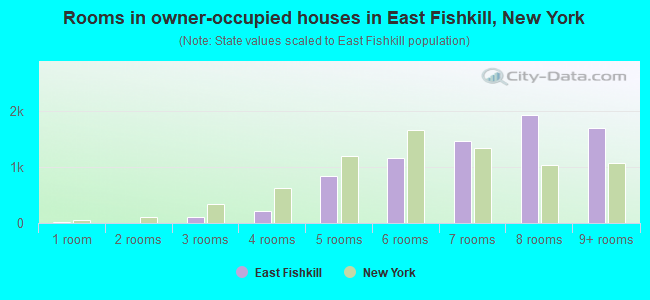
Housing units in East Fishkill with a mortgage: 5,477 (442 second mortgage, 995 home equity loan, 19 both second mortgage and home equity loan) Houses without a mortgage: 1,332
Compare current foreclosures near East Fishkill, NY:
In family households: 233,367 (50,686 male householders, 22,209 female householders)
56,050 spouses, 84,341 children (79,509 natural, 1,840 adopted, 2,992 stepchildren), 4,231 grandchildren, 2,222 brothers or sisters, 2,827 parents, foster children, 2,945 other relatives, 5,949 non-relatives
In nonfamily households: 44,156 (16,442 male householders (12,459 living alone)), 18,628 female householders (15,636 living alone)), 9,086 nonrelatives
In group quarters: 19,965 (8,812 institutionalized population)
50,827 married couples with children.
13,342 single-parent households (2,993 men, 10,349 women).
89.4% of residents of East Fishkill speak English at home.
2.8% of residents speak Spanish at home (72% speak English very well, 18% speak English well, 9% speak English not well, 2% don't speak English at all).
5.7% of residents speak other Indo-European language at home (73% speak English very well, 18% speak English well, 7% speak English not well, 2% don't speak English at all).
1.2% of residents speak Asian or Pacific Island language at home (62% speak English very well, 38% speak English well).
0.8% of residents speak other language at home (69% speak English very well, 29% speak English well, 2% speak English not well).
Foreign born population: 2,777 (10.2%)
(81.4% of them are naturalized citizens)
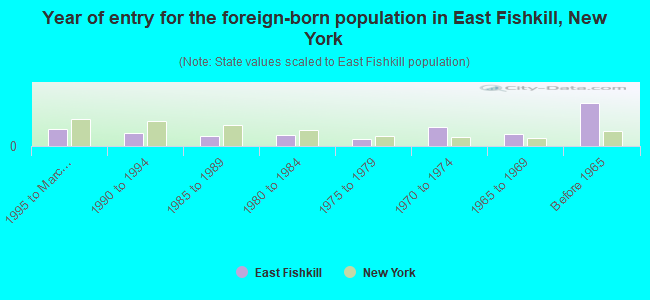
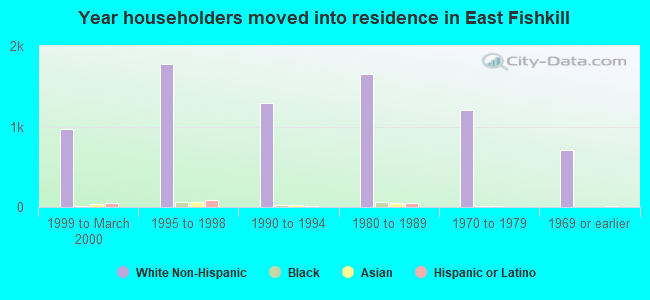
Year of entry for the foreign-born population in East Fishkill, New York
2311995 to March 2000
1771990 to 1994
1361985 to 1989
1491980 to 1984
951975 to 1979
2701970 to 1974
1681965 to 1969
595Before 1965
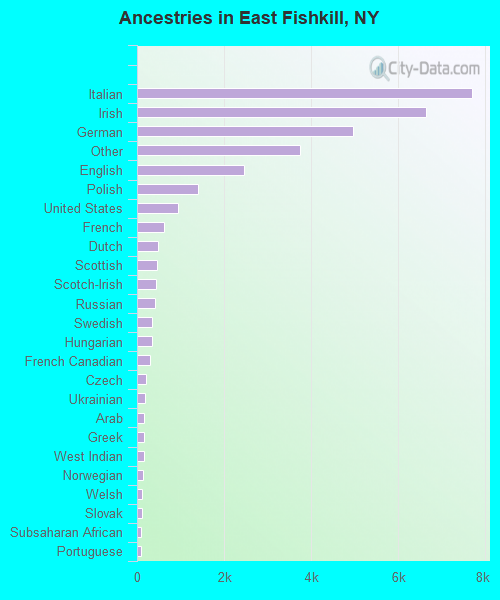
First ancestries reported:
Italian: 7,705 (23.4%)
Irish: 6,640 (20.2%)
German: 4,971 (15.1%)
Other: 3,739 (11.4%)
English: 2,466 (7.5%)
Polish: 1,397 (4.2%)
United States: 953 (2.9%)
French: 615 (1.9%)
Dutch: 486 (1.5%)
Scottish: 457 (1.4%)
Scotch-Irish: 434 (1.3%)
Russian: 412 (1.3%)
Swedish: 354 (1.1%)
Hungarian: 346 (1.1%)
French Canadian: 290 (0.9%)
Czech: 205 (0.6%)
Ukrainian: 187 (0.6%)
Arab: 163 (0.5%)
Greek: 159 (0.5%)
West Indian: 159 (0.5%)
Norwegian: 133 (0.4%)
Welsh: 115 (0.3%)
Slovak: 109 (0.3%)
Subsaharan African: 97 (0.3%)
Portuguese: 89 (0.3%)
Danish: 88 (0.3%)
Lithuanian: 84 (0.3%)
Swiss: 61 (0.2%)
Most common places of birth for foreign-born residents (%):
India
East Fishkill:
13.6% (247)
New York:
3.0% (117,238)
Italy
East Fishkill:
12.8% (233)
New York:
3.8% (147,729)
Germany
East Fishkill:
9.0% (163)
New York:
1.8% (69,327)
United Kingdom
East Fishkill:
7.2% (131)
New York:
1.6% (62,237)
Philippines
East Fishkill:
3.5% (64)
New York:
1.9% (72,408)
Korea
East Fishkill:
3.5% (63)
New York:
2.5% (97,933)
Ireland
East Fishkill:
3.1% (56)
New York:
1.1% (41,934)
Austria
East Fishkill:
2.6% (47)
New York:
0.3% (11,299)
Poland
East Fishkill:
2.3% (42)
New York:
2.4% (93,187)
Other Eastern Africa
East Fishkill:
2.2% (40)
New York:
0.2% (7,442)
Hungary
East Fishkill:
2.1% (38)
New York:
0.4% (17,401)
France
East Fishkill:
2.0% (36)
New York:
0.5% (20,310)
Guyana
East Fishkill:
1.9% (35)
New York:
3.7% (142,154)
Canada
East Fishkill:
1.9% (35)
New York:
1.4% (54,876)
China, excluding Hong Kong and Taiwan
East Fishkill:
1.9% (34)
New York:
6.0% (233,766)
Taiwan
East Fishkill:
1.7% (31)
New York:
0.8% (30,473)
Yugoslavia
East Fishkill:
1.6% (30)
New York:
0.7% (25,688)
Place of birth for U.S.-born residents:
This state: 20,158
Other state: 3,450
Northeast: 1,969
Midwest: 608
South: 625
West: 248
67% of East Fishkill residents lived in the same house 5 years ago. Out of people who lived in different houses, 42% lived in this county. Out of people who lived in different counties, 77% lived in New York.
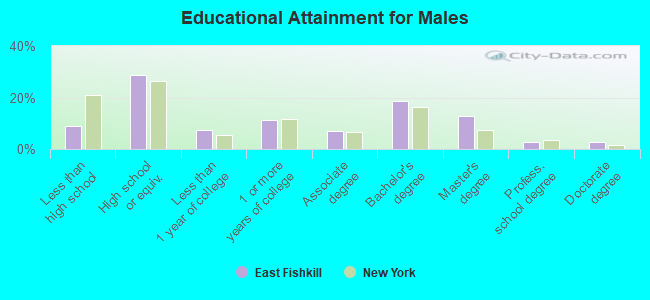
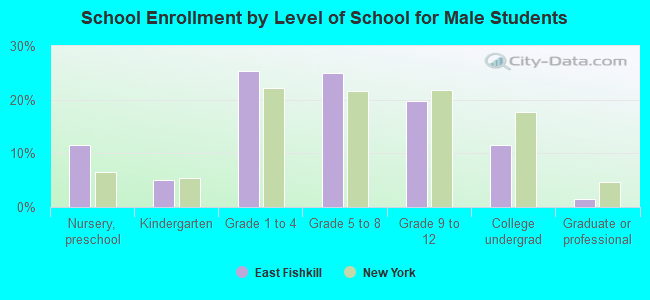
Education attainment for males 25 years and older:
No schooling: 40
Nursery to 4th grade: 22
5th and 6th grade: 43
7th and 8th grade: 92
9th grade: 60
10th grade: 128
11th grade: 161
12th grade, no diploma: 162
High school graduate (or equivalency): 2,318
Less than 1 year of college: 586
Some college more than 1 year, no degree: 897
Associate degree: 558
Bachelor's degree: 1,499
Master's degree: 1,021
Professional school degree: 229
Doctorate degree: 209
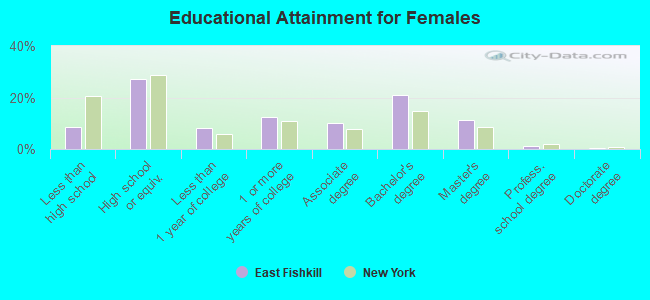
Education attainment for females 25 years and older:
No schooling: 45
Nursery to 4th grade: 25
5th and 6th grade: 24
7th and 8th grade: 98
9th grade: 25
10th grade: 98
11th grade: 209
12th grade, no diploma: 181
High school graduate (or equivalency): 2,284
Less than 1 year of college: 701
Some college more than 1 year, no degree: 1,049
Associate degree: 867
Bachelor's degree: 1,778
Master's degree: 940
Professional school degree: 87
Doctorate degree: 34
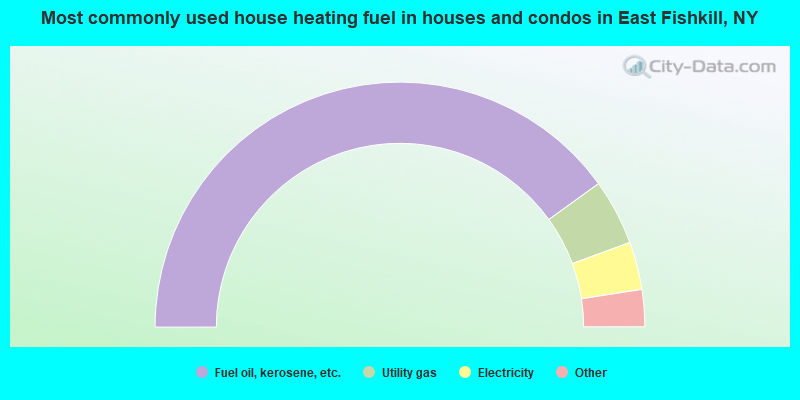
Housing units in structures:
One, detached: 7,753
One, attached: 137
Two: 186
3 or 4: 93
5 to 9: 52
10 to 19: 38
20 to 49: 43
Mobile homes: 165
Median worth of mobile homes: $201,907
Housing units lacking complete plumbing facilities: 0.7%
Housing units lacking complete kitchen facilities: 0.7%