El Lago, TX (Texas) Houses and Residents
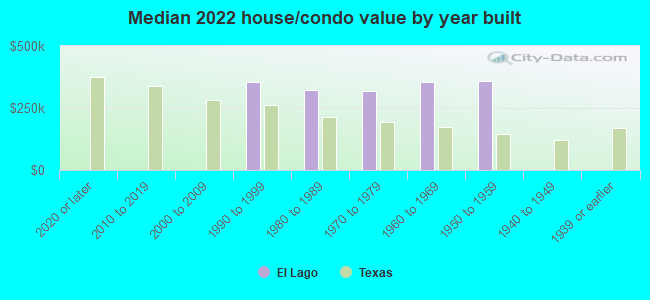
| El Lago: | $333,674 |
| Texas: | $275,400 |
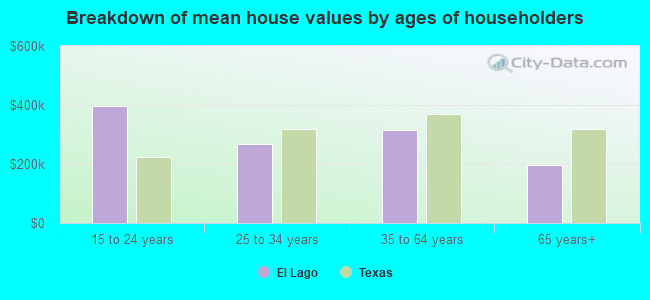
Mean price in 2022:
Detached houses: $406,753
Here: $406,753 State: $369,058 In 5-or-more-unit structures: $200,291
Here: $200,291 State: $413,944
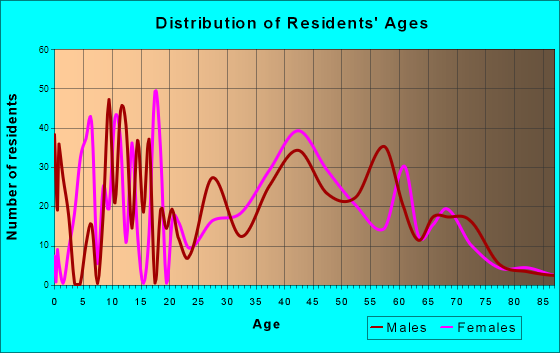
Total population: 2,774 (All urban)
Houses: 1,284 (1,225 occupied: 1,036 owner occupied, 207 renter occupied)
| % of renters here: | 17% |
| State: | 38% |
Housing density: 1,966 houses/condos per square mile
Median price asked for vacant for-sale houses and condos in 2022 in this county: $417,614.
Median contract rent in 2022: $1,335 (lower quartile is $1,105, upper quartile is $1,576)
Median rent asked for vacant for-rent units in 2022: $2,991
Median gross rent in El Lago, TX in 2022: $1,382
Housing units in El Lago with a mortgage: 617 (37 second mortgage, 0 home equity loan, 38 both second mortgage and home equity loan)
Houses without a mortgage: 10
Median household income for houses/condos with a mortgage: $108,904
Median household income for apartments without a mortgage: $68,211
Median monthly housing costs: $1,605
Compare current foreclosures near El Lago, TX:
| Photo | Address | Area | Beds / Baths | Price | Details |
|---|---|---|---|---|---|

|
#1
11th St N
Texas City, TX 77590
|
2,625 sq. feet
|
3 baths 4 beds |
$449,900
|
show details |

|
#2
Creekview Dr
La Porte, TX 77571
|
2,986 sq. feet
|
2 baths 3 beds |
$199,500
|
show details |

|
#3
Stonefair Ln
Houston, TX 77075
|
2,594 sq. feet
|
3 baths 4 beds |
$305,000
|
show details |

|
#4
Black Horse Rd
Baytown, TX 77523
|
3,419 sq. feet
|
3 baths 4 beds |
$589,900
|
show details |

|
#5
Prairie Ave
Pasadena, TX 77506
|
1,978 sq. feet
|
2 baths 3 beds |
show details | |

|
#6
Carlow Ln
La Porte, TX 77571
|
1,668 sq. feet
|
2 baths 3 beds |
show details | |

|
#7
Gulf Stream Ln
Bacliff, TX 77518
|
1,641 sq. feet
|
2 baths 3 beds |
show details | |

|
#8
Sageaspen Ln
Houston, TX 77089
|
1,936 sq. feet
|
2 baths 4 beds |
show details | |

|
#9
Burbank St
Baytown, TX 77520
|
1,248 sq. feet
|
1 baths 3 beds |
show details | |

|
#10
Coronation Dr
Houston, TX 77034
|
4,058 sq. feet
|
3 baths 3 beds |
show details |
| Photo | Address | Area | Beds / Baths | Price | Details |
|---|---|---|---|---|---|

|
#11
Hughes Ranch Rd
Houston, TX 77089
|
1,958 sq. feet
|
2 baths 3 beds |
show details | |

|
#12
Sagewell Dr
Houston, TX 77089
|
3,040 sq. feet
|
3 baths 5 beds |
show details | |

|
#13
Grassington Dr
Channelview, TX 77530
|
1,282 sq. feet
|
2 baths 3 beds |
show details | |

|
#14
Firdale Cir
Channelview, TX 77530
|
1,140 sq. feet
|
2 baths 3 beds |
show details | |

|
#15
Sageberry Dr
Houston, TX 77089
|
1,956 sq. feet
|
2 baths 3 beds |
show details | |

|
#16
Macclesby Ln
Channelview, TX 77530
|
2,562 sq. feet
|
2 baths 4 beds |
show details | |

|
#17
Kirkmeadow Dr
Houston, TX 77089
|
1,842 sq. feet
|
2 baths 3 beds |
show details | |

|
#18
Pine Mill Ct
Pearland, TX 77584
|
3,196 sq. feet
|
4 baths 4 beds |
show details | |

|
#19
Chestnut Springs Ln
Houston, TX 77062
|
2,127 sq. feet
|
2 baths 4 beds |
show details | |

|
#20
Peermont St
Houston, TX 77062
|
2,304 sq. feet
|
2 baths 4 beds |
show details |
| Photo | Address | Area | Beds / Baths | Price | Details |
|---|---|---|---|---|---|

|
#21
Shannon Ridge Rd
Houston, TX 77062
|
2,024 sq. feet
|
2 baths 3 beds |
show details | |

|
#22
Tallow Cove Dr
Baytown, TX 77521
|
2,009 sq. feet
|
2 baths 3 beds |
show details | |

|
#23
Sagecanyon Dr
Houston, TX 77089
|
- sq. feet
|
2 baths 3 beds |
show details | |

|
#24
Lake Landing Dr
League City, TX 77573
|
7,959 sq. feet
|
5 baths 7 beds |
show details | |

|
#25
Blimp Base Road
Hitchcock, TX 77563
|
- sq. feet
|
2 baths 4 beds |
show details | |

|
#26
Chia Valley Ct
Houston, TX 77089
|
2,169 sq. feet
|
2 baths 3 beds |
show details | |

|
#27
Stoneridge Canyon Ct
Houston, TX 77089
|
1,490 sq. feet
|
1 baths 3 beds |
show details | |

|
#28
Tracy Ln
Highlands, TX 77562
|
1,734 sq. feet
|
2 baths 3 beds |
show details | |

|
#29
Valley Tree Ln
Houston, TX 77089
|
- sq. feet
|
2 baths 3 beds |
show details | |

|
#30
Littleport Ln
Channelview, TX 77530
|
870 sq. feet
|
2 baths 3 beds |
show details |
| Photo | Address | Area | Beds / Baths | Price | Details |
|---|---|---|---|---|---|

|
#31
Timber Ridge St
Baytown, TX 77521
|
1,701 sq. feet
|
2 baths 3 beds |
show details | |

|
#32
Overland Trl
Dickinson, TX 77539
|
1,171 sq. feet
|
2 baths 3 beds |
show details | |

|
#33
32nd Ave N
Texas City, TX 77591
|
1,520 sq. feet
|
2 baths 3 beds |
show details | |

|
#34
Silver Landing Ln
Dickinson, TX 77539
|
- sq. feet
|
2 baths 3 beds |
show details | |

|
#35
Regency Dr
Deer Park, TX 77536
|
2,500 sq. feet
|
2 baths 5 beds |
show details | |

|
#36
Robinwood Dr
Deer Park, TX 77536
|
2,621 sq. feet
|
2 baths 3 beds |
show details | |

|
#37
Laura Leigh Dr
Friendswood, TX 77546
|
1,518 sq. feet
|
2 baths 3 beds |
show details | |

|
#38
Edwards Dr
Dickinson, TX 77539
|
1,424 sq. feet
|
3 baths 4 beds |
show details | |

|
#39
Shady Oaks Ln
Friendswood, TX 77546
|
1,873 sq. feet
|
2 baths 3 beds |
show details | |

|
#40
Fairdale St
Pasadena, TX 77505
|
1,952 sq. feet
|
2 baths 3 beds |
show details |
| Photo | Address | Area | Beds / Baths | Price | Details |
|---|---|---|---|---|---|

|
#41
Silver Leaf Dr
League City, TX 77573
|
1,634 sq. feet
|
2 baths 3 beds |
show details | |

|
#42
Wessex Dr
Houston, TX 77089
|
1,769 sq. feet
|
2 baths 3 beds |
show details | |

|
#43
Wildfire St
League City, TX 77573
|
1,375 sq. feet
|
2 baths 3 beds |
show details | |

|
#44
Ardery Meadow Drive
Houston, TX 77048
|
1,827 sq. feet
|
2 baths 3 beds |
show details | |

|
#45
Mammoth Springs Ln
Dickinson, TX 77539
|
1,915 sq. feet
|
2 baths 3 beds |
show details | |

|
#46
Mclean Rd
Pearland, TX 77584
|
1,956 sq. feet
|
2 baths 3 beds |
show details | |

|
#47
Vicksburg St
Houston, TX 77015
|
1,022 sq. feet
|
1 baths 3 beds |
show details | |

|
#48
Ardery Meadow Drive
Houston, TX 77048
|
1,827 sq. feet
|
2 baths 3 beds |
show details | |

|
#49
Little St
La Marque, TX 77568
|
1,265 sq. feet
|
1 baths 3 beds |
show details | |

|
Check over 1 million property listings on Foreclosure.com!
|
browse all offers | |||


 | affordable apartments close to NASA (8 replies) |
| Whatever happened to Galindo chips? (22 replies) |
| Fall in love with a house in a flood-prone neigborhood - Taylor lake village - Seabrook (21 replies) |
| Estates of McKinney, McKinney, Texas (24 replies) |
| Where to find rentals in Clear Lake area? (22 replies) |
| Any El Lago residents? (10 replies) |
Median year apartment built: 1979
Household type by relationship:
Households: 3,074- Male householders: 728 (164 living alone), Female householders: 468 (134 living alone)
707 spouses (707 opposite-sex spouses), 63 unmarried partners, (63 opposite-sex unmarried partners), 860 children (805 natural, 5 adopted, 50 stepchildren), 51 grandchildren, 45 brothers or sisters, 19 parents, 0 foster children, 50 other relatives, 65 non-relatives
- In group quarters: 13
Size of family households: 420 2-persons, 175 3-persons, 207 4-persons, 40 5-persons, 7 6-persons, 15 7-or-more-persons.
Size of nonfamily households: 325 1-person, 48 2-persons, 4 4-persons.
451 married couples with children.
101 single-parent households (20 men, 81 women).
88.1% of residents of El Lago speak English at home.
2.1% of residents speak Spanish at home (85% speak English very well, 13% speak English well, 2% speak English not well).
3.4% of residents speak other Indo-European language at home (80% speak English very well, 20% speak English well).
3.1% of residents speak Asian or Pacific Island language at home (4% speak English very well, 96% speak English well).
2.6% of residents speak other language at home (87% speak English very well, 13% speak English not well).
Foreign born population: 356 (11.6%)
(45.8% of them are naturalized citizens)
| Here: | 6.9 |
| State: | 6.3 |
| Here: | 3.7 |
| State: | 4.0 |
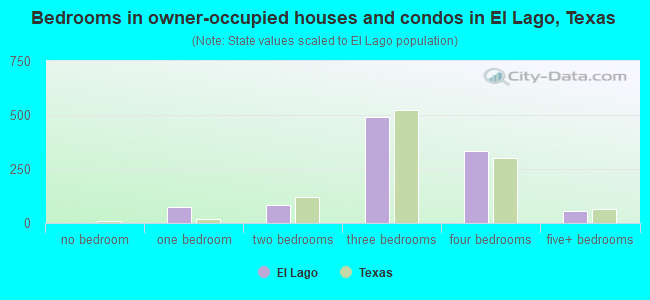
- Bedrooms in owner-occupied houses and condos in El Lago, Texas
- 0no bedroom
- 751 bedroom
- 832 bedrooms
- 4893 bedrooms
- 3344 bedrooms
- 565+ bedrooms
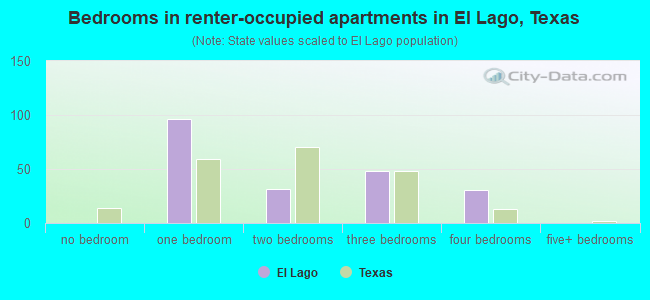
- Bedrooms in renter-occupied apartments in El Lago, Texas
- 0no bedroom
- 971 bedroom
- 322 bedrooms
- 483 bedrooms
- 304 bedrooms
- 05+ bedrooms
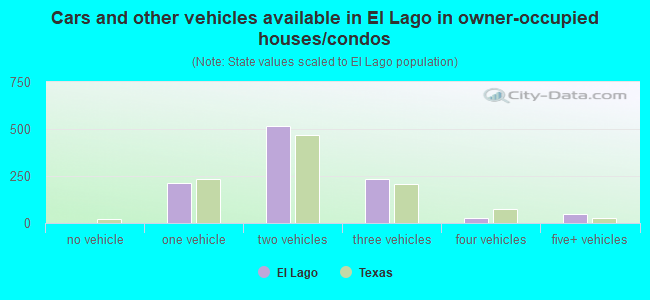
- Cars and other vehicles available in El Lago in owner-occupied houses/condos
- 0no vehicle
- 2121 vehicle
- 5172 vehicles
- 2343 vehicles
- 244 vehicles
- 485+ vehicles
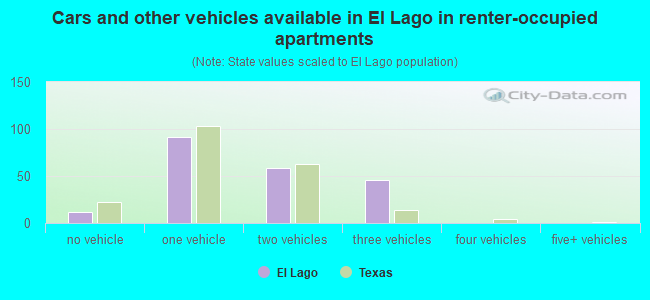
- Cars and other vehicles available in El Lago in renter-occupied apartments
- 12no vehicle
- 911 vehicle
- 582 vehicles
- 463 vehicles
- 04 vehicles
- 05+ vehicles
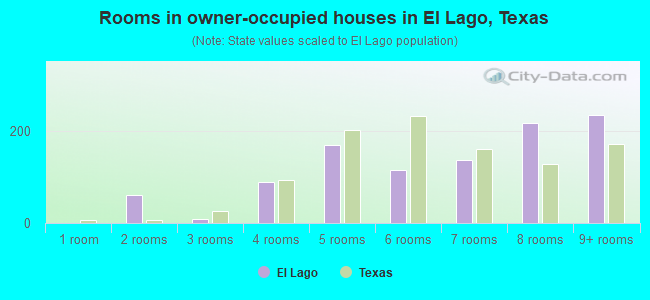
- Rooms in owner-occupied houses in El Lago, Texas
- 01 room
- 612 rooms
- 83 rooms
- 904 rooms
- 1705 rooms
- 1166 rooms
- 1377 rooms
- 2188 rooms
- 2379+ rooms
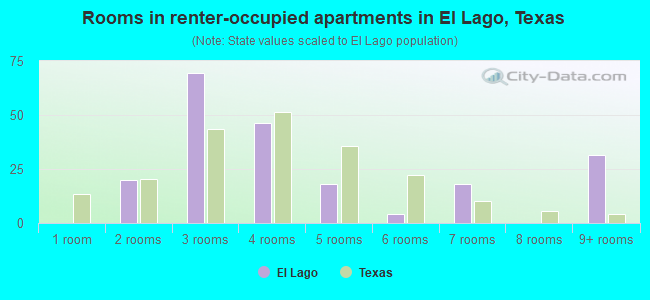
- Rooms in renter-occupied apartments in El Lago, Texas
- 01 room
- 202 rooms
- 693 rooms
- 464 rooms
- 185 rooms
- 46 rooms
- 187 rooms
- 08 rooms
- 329+ rooms
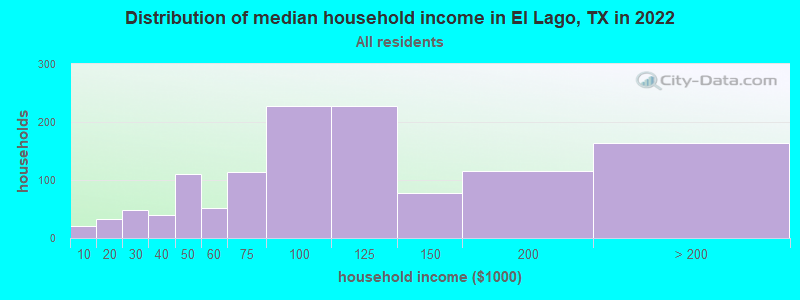
El Lago, TX household income distribution

- 20Less than $10,000
- 32$10,000 to $19,999
- 49$20,000 to $29,999
- 40$30,000 to $39,999
- 110$40,000 to $49,999
- 51$50,000 to $59,999
- 113$60,000 to $74,999
- 227$75,000 to $99,999
- 227$100,000 to $124,999
- 78$125,000 to $149,999
- 116$150,000 to $199,999
- 164$200,000 or more
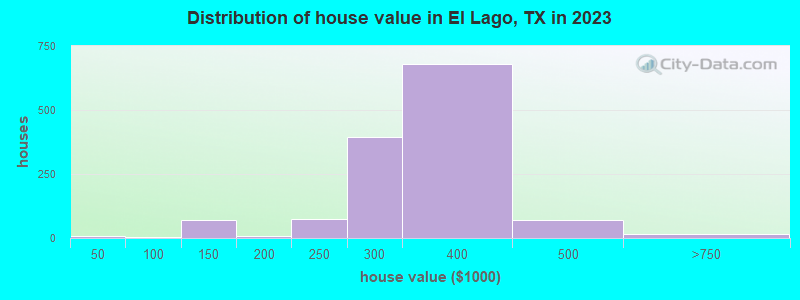
Home value of owner - occupied houses in 2022 in El Lago, TX
-
- 9Less than $10,000
- 5$20,000 to $24,999
- 5$80,000 to $89,999
- 3$90,000 to $99,999
- 61$100,000 to $124,999
- 2$125,000 to $149,999
- 14$150,000 to $174,999
- 4$175,000 to $199,999
- 126$200,000 to $249,999
- 306$250,000 to $299,999
- 555$300,000 to $399,999
- 51$400,000 to $499,999
- 25$500,000 to $749,999
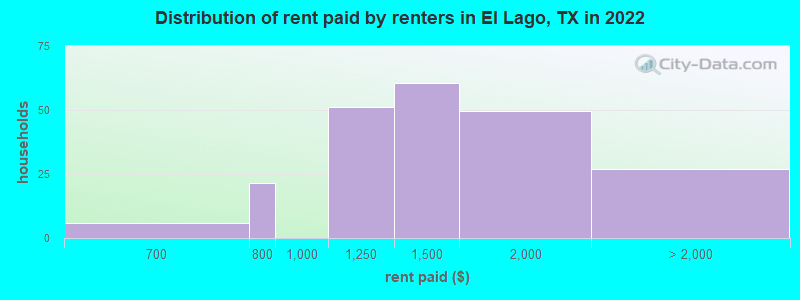
Rent paid by renters in 2022 in El Lago, TX
-
- 6$600 to $649
- 21$750 to $799
- 51$1,000 to $1,249
- 60$1,250 to $1,499
- 49$1,500 to $1,999
- 9$2,500 to $2,999
- 17No cash rent
Percentage of workers working in this county: 74.7%
Number of people working at home: 203 (12.4% of all workers)
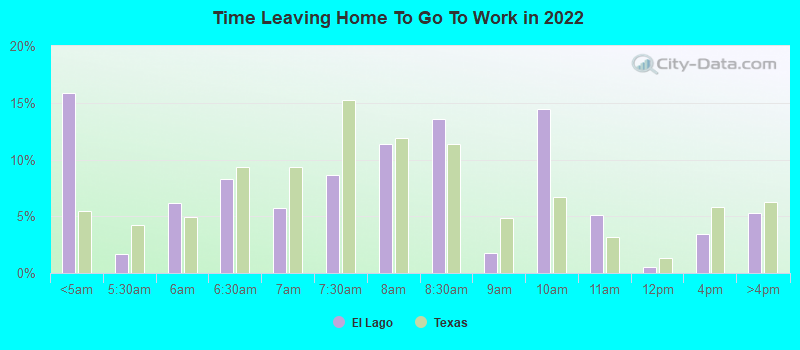
Travel time to work (commute)
- Less than 5 minutes: 6
- 5 to 9 minutes: 46
- 10 to 14 minutes: 101
- 15 to 19 minutes: 282
- 20 to 24 minutes: 156
- 25 to 29 minutes: 137
- 30 to 34 minutes: 118
- 35 to 39 minutes: 137
- 40 to 44 minutes: 130
- 45 to 59 minutes: 158
- 60 to 89 minutes: 161
- 90 or more minutes: 0
Means of transportation to work:
- Drove a car alone: 1,427 (86.6%)
- Carpooled: 140 (8.5%)
- Bus or trolley bus: 34 (2.1%)
- Walked: 8 (0.5%)
- Worked at home: 39 (2.4%)
- Unemployment by race in 2022
- Unemployment rate for White non-Hispanic residents
- 5.5%Males
- 0.6%Females
- Unemployment rate for American Indian and Alaska Native residents
- 59.3%Males
- Unemployment rate for Hispanic or Latino residents
- 4.6%Males
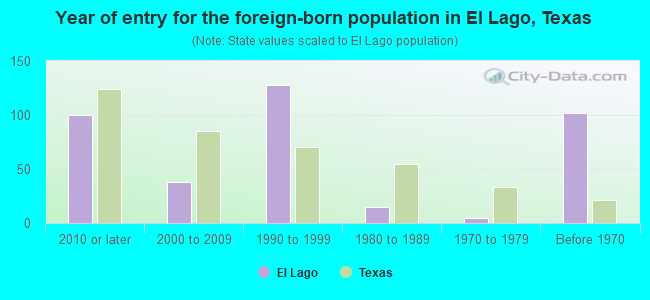
- Year of entry for the foreign-born population in El Lago, Texas
- 1002010 or later
- 382000 to 2009
- 1281990 to 1999
- 151980 to 1989
- 51970 to 1979
- 102Before 1970
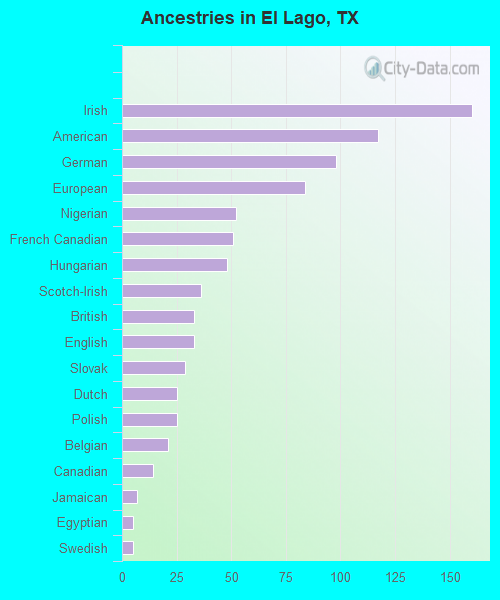
First ancestries reported:
- Irish: 160 (9.7%)
- American: 117 (7.1%)
- German: 98 (6.0%)
- European: 84 (5.1%)
- Nigerian: 52 (3.2%)
- French Canadian: 51 (3.1%)
- Hungarian: 48 (2.9%)
- Scotch-Irish: 36 (2.2%)
- British: 33 (2.0%)
- English: 33 (2.0%)
- Slovak: 29 (1.8%)
- Dutch: 25 (1.5%)
- Polish: 25 (1.5%)
- Belgian: 21 (1.3%)
- Canadian: 14 (0.9%)
- Jamaican: 7 (0.4%)
- Egyptian: 5 (0.3%)
- Swedish: 5 (0.3%)
Most common places of birth for foreign-born residents (%):
| El Lago: | 28.7% (102) |
| Texas: | 2.1% (103,148) |
| El Lago: | 13.5% (48) |
| Texas: | 1.1% (55,371) |
| El Lago: | 12.6% (45) |
| Texas: | 1.9% (96,110) |
| El Lago: | 9.0% (32) |
| Texas: | 6.1% (306,347) |
| El Lago: | 5.3% (19) |
| Texas: | 0.1% (5,793) |
| El Lago: | 3.9% (14) |
| Texas: | 0.0% (1,892) |
| El Lago: | 3.1% (11) |
| Texas: | 0.8% (37,989) |
| El Lago: | 2.2% (8) |
| Texas: | 0.5% (26,969) |
| El Lago: | 2.0% (7) |
| Texas: | 48.4% (2,411,723) |
Place of birth for U.S.-born residents:
- This state: 1,457
- Other state: 1,239
- Northeast: 175
- Midwest: 260
- South: 261
- West: 564
90.5% of El Lago residents lived in the same house 1 years ago.
Out of people who lived in different houses, 42.5% lived in this county.
Out of people who lived in different counties, 100.0% lived in Texas.
| El Lago: | 90.5% |
| State average: | 85.7% |
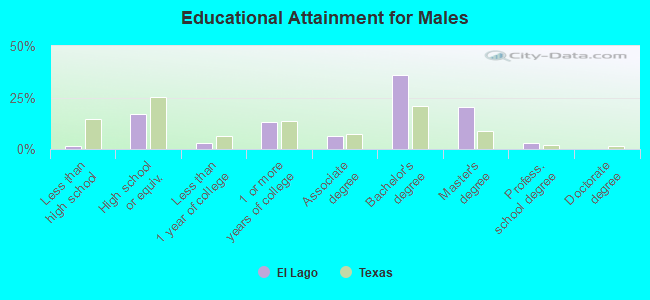
Education attainment for males 25 years and older:
- No schooling: 0
- Nursery to 4th grade: 0
- 5th and 6th grade: 14
- 7th and 8th grade: 0
- 9th grade: 0
- 10th grade: 0
- 11th grade: 0
- 12th grade, no diploma: 0
- High school graduate (or equivalency): 186
- Less than 1 year of college: 32
- Some college more than 1 year, no degree: 143
- Associate degree: 68
- Bachelor's degree: 393
- Master's degree: 219
- Professional school degree: 32
- Doctorate degree: 0
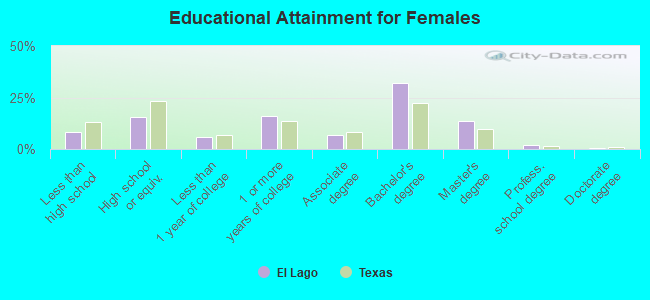
Education attainment for females 25 years and older:
- No schooling: 8
- Nursery to 4th grade: 0
- 5th and 6th grade: 0
- 7th and 8th grade: 0
- 9th grade: 0
- 10th grade: 0
- 11th grade: 3
- 12th grade, no diploma: 80
- High school graduate (or equivalency): 173
- Less than 1 year of college: 65
- Some college more than 1 year, no degree: 177
- Associate degree: 77
- Bachelor's degree: 361
- Master's degree: 151
- Professional school degree: 20
- Doctorate degree: 4
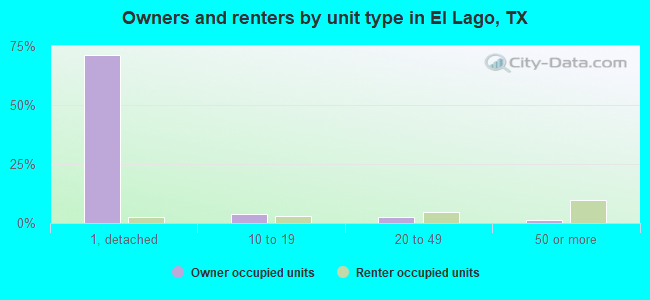
Housing units in structures:
- One, detached: 952
- One, attached: 13
- 3 or 4: 52
- 5 to 9: 11
- 10 to 19: 36
- 20 to 49: 139
- 50 or more: 77
Housing units lacking complete kitchen facilities in 2022: 1.5%
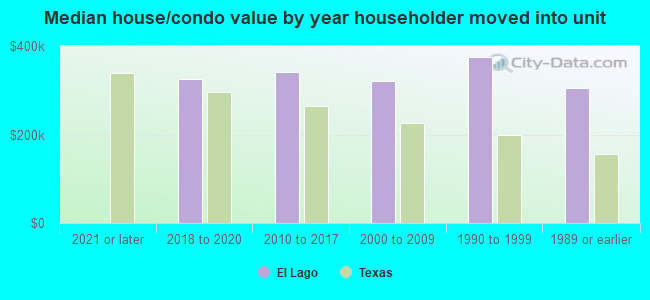
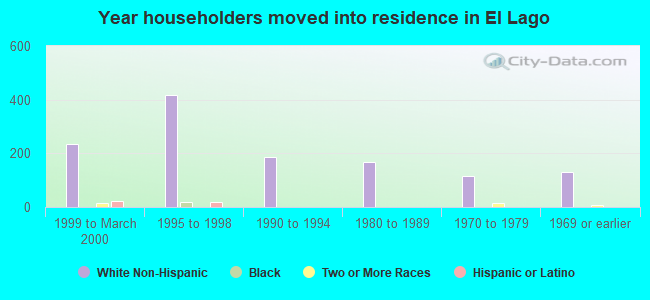
House/condo owner moved in on average 14 years ago
Renter moved in on average 5 years ago
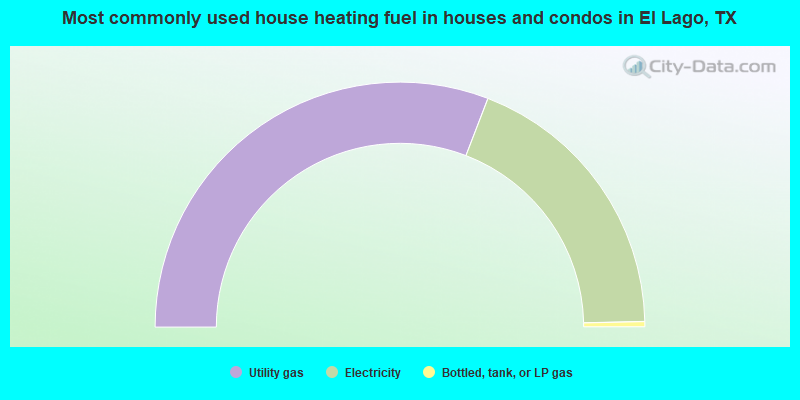
- 61.7%Utility gas
- 37.6%Electricity
- 0.7%Bottled, tank, or LP gas
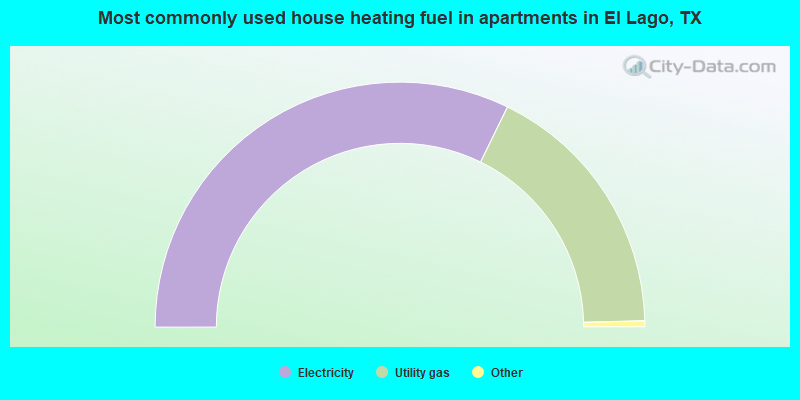
- 65.0%Electricity
- 35.0%Utility gas
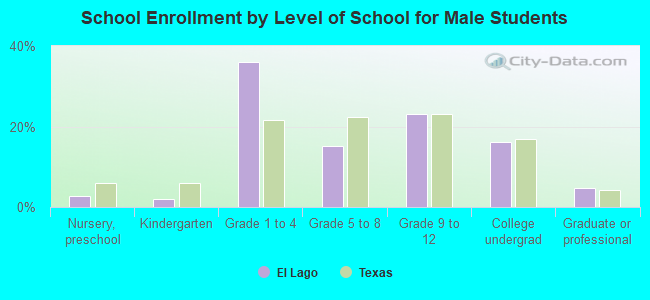
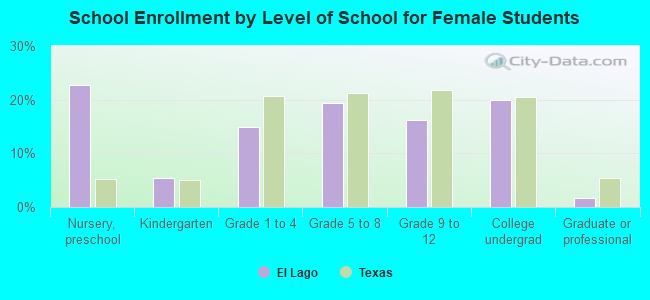
Private vs. public school enrollment:
| Here: | 17.6% |
| Texas: | 8.8% |
| Here: | 8.6% |
| Texas: | 8.0% |
| Here: | 10.6% |
| Texas: | 16.2% |