Eola-Paint Rock, TX (Texas) Houses and Residents
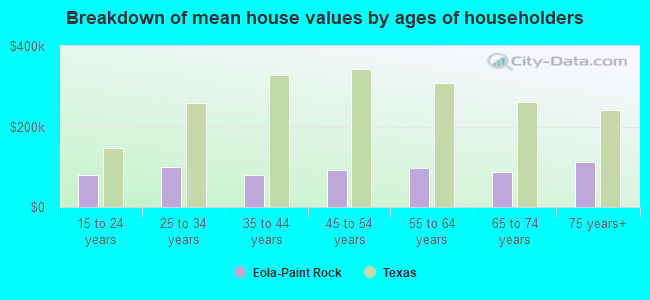
| Eola-Paint Rock: | $104,111 |
| Texas: | $275,400 |
Total population: 808 (Urban population: 0, Rural population: 903 (166 farm, 737 nonfarm))
Houses: 473 (349 occupied: 284 owner occupied, 65 renter occupied)
| % of renters here: | 19% |
| State: | 38% |
Housing density: 2 houses/condos per square mile
Median price asked for vacant for-sale houses and condos in 2022 in this county: $1,712,982.
Median contract rent in 2022: $530 (lower quartile is $294, upper quartile is $760)
Median rent asked for vacant for-rent units in 2022: $481
Median gross rent in Eola-Paint Rock, TX in 2022: $986
Housing units in Eola-Paint Rock with a mortgage: 68 (0 second mortgage, 2 home equity loan, 0 both second mortgage and home equity loan)
Houses without a mortgage: 104
Compare current foreclosures near Eola-Paint Rock, TX:
| Photo | Address | Area | Beds / Baths | Price | Details |
|---|---|---|---|---|---|

|
#1
Private Road 1744
Paint Rock, TX 76866
|
- sq. feet
|
- baths - beds |
show details | |

|
#2
Perry St
Miles, TX 76861
|
- sq. feet
|
- baths - beds |
show details | |

|
Check over 1 million property listings on Foreclosure.com!
|
browse all offers | |||

Household type by relationship:
Households: 2,499- In family households: 2,175 (574 male householders, 170 female householders)
592 spouses, 630 children (554 natural, 30 adopted, 46 stepchildren), 107 grandchildren, 17 brothers or sisters, 8 parents, foster children, 18 other relatives, 44 non-relatives
- In nonfamily households: 324 (168 male householders (156 living alone)), 129 female householders (120 living alone)), 27 nonrelatives
- In group quarters: 1,588 (all institutionalized)
451 married couples with children.
118 single-parent households (26 men, 92 women).
69.6% of residents of Eola-Paint Rock speak English at home.
26.6% of residents speak Spanish at home (64% speak English very well, 18% speak English well, 16% speak English not well, 3% don't speak English at all).
3.8% of residents speak other Indo-European language at home (70% speak English very well, 30% speak English well).
Foreign born population: 156 (12.7%)
(32.1% of them are naturalized citizens)
| Here: | 6.0 |
| State: | 6.3 |
| Here: | 6.0 |
| State: | 4.0 |
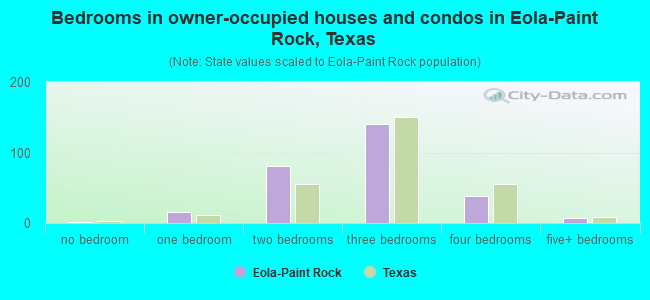
- Bedrooms in owner-occupied houses and condos in Eola-Paint Rock, Texas
- 2no bedroom
- 161 bedroom
- 812 bedrooms
- 1403 bedrooms
- 384 bedrooms
- 75+ bedrooms
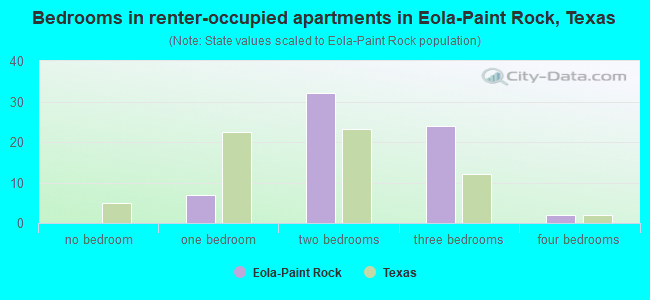
- Bedrooms in renter-occupied apartments in Eola-Paint Rock, Texas
- 0no bedroom
- 71 bedroom
- 322 bedrooms
- 243 bedrooms
- 24 bedrooms
- 05+ bedrooms
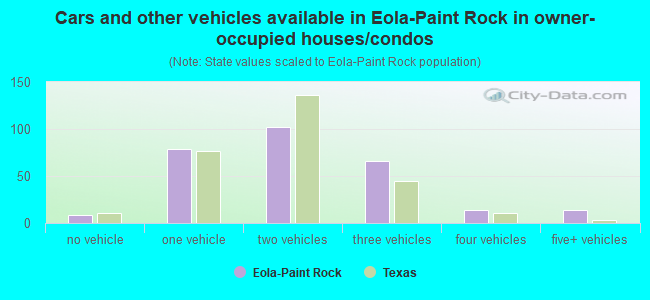
- Cars and other vehicles available in Eola-Paint Rock in owner-occupied houses/condos
- 9no vehicle
- 791 vehicle
- 1022 vehicles
- 663 vehicles
- 144 vehicles
- 145+ vehicles
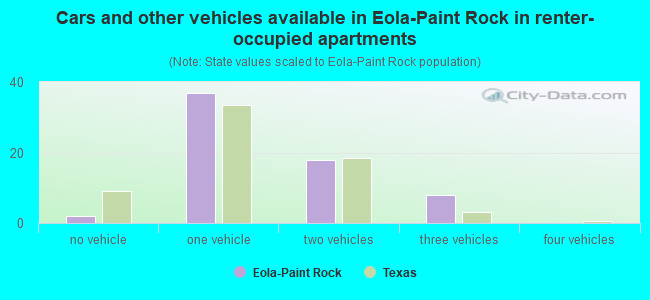
- Cars and other vehicles available in Eola-Paint Rock in renter-occupied apartments
- 2no vehicle
- 371 vehicle
- 182 vehicles
- 83 vehicles
- 04 vehicles
- 05+ vehicles
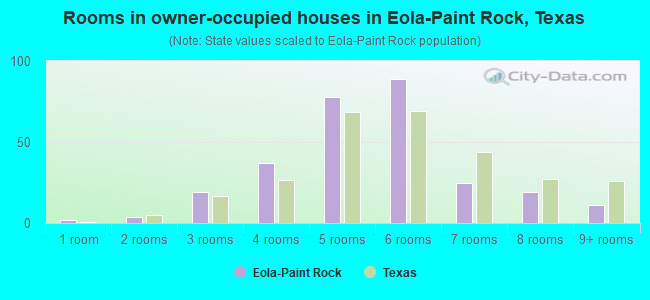
- Rooms in owner-occupied houses in Eola-Paint Rock, Texas
- 21 room
- 42 rooms
- 193 rooms
- 374 rooms
- 785 rooms
- 896 rooms
- 257 rooms
- 198 rooms
- 119+ rooms
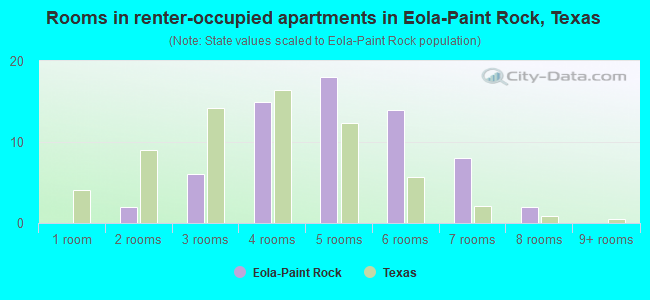
- Rooms in renter-occupied apartments in Eola-Paint Rock, Texas
- 01 room
- 22 rooms
- 63 rooms
- 154 rooms
- 185 rooms
- 146 rooms
- 87 rooms
- 28 rooms
- 09+ rooms
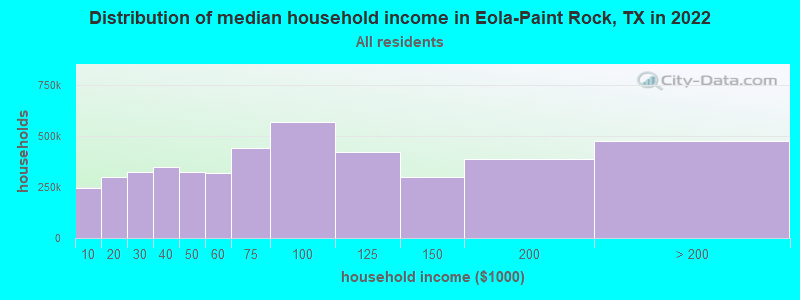
Eola-Paint Rock, TX household income distribution

- 72,098Less than $10,000
- 98,018$10,000 to $19,999
- 106,633$20,000 to $29,999
- 112,313$30,000 to $39,999
- 105,962$40,000 to $49,999
- 101,695$50,000 to $59,999
- 140,776$60,000 to $74,999
- 192,755$75,000 to $99,999
- 146,119$100,000 to $124,999
- 107,726$125,000 to $149,999
- 125,273$150,000 to $199,999
- 140,812$200,000 or more
Percentage of workers working in this county: 50.4%
Number of people working at home: 63 (11.1% of all workers)
Travel time to work (commute)
- Less than 5 minutes: 36
- 5 to 9 minutes: 40
- 10 to 14 minutes: 28
- 15 to 19 minutes: 23
- 20 to 24 minutes: 60
- 25 to 29 minutes: 30
- 30 to 34 minutes: 60
- 35 to 39 minutes: 19
- 40 to 44 minutes: 24
- 45 to 59 minutes: 20
- 60 to 89 minutes: 14
- 90 or more minutes: 25
Means of transportation to work:
- Drove a car alone: 284 (68.3%)
- Carpooled: 71 (17.1%)
- Walked: 19 (4.6%)
- Other means: 5 (1.2%)
- Worked at home: 37 (8.9%)
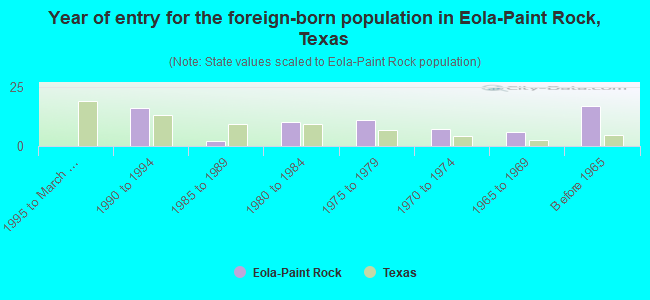
- Year of entry for the foreign-born population in Eola-Paint Rock, Texas
- 01995 to March 2000
- 161990 to 1994
- 21985 to 1989
- 101980 to 1984
- 111975 to 1979
- 71970 to 1974
- 61965 to 1969
- 17Before 1965
Most common places of birth for foreign-born residents (%):
| Eola-Paint Rock: | 100.0% (69) |
| Texas: | 64.8% (1,879,369) |
Place of birth for U.S.-born residents:
- This state: 754
- Other state: 80
- Northeast: 2
- Midwest: 22
- South: 31
- West: 25
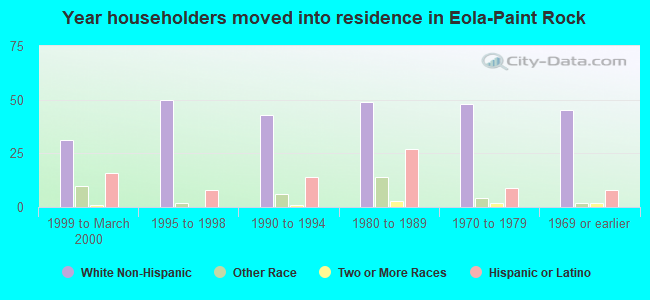
66% of Eola-Paint Rock residents lived in the same house 5 years ago.
Out of people who lived in different houses, 30% lived in this county.
Out of people who lived in different counties, 91% lived in Texas.
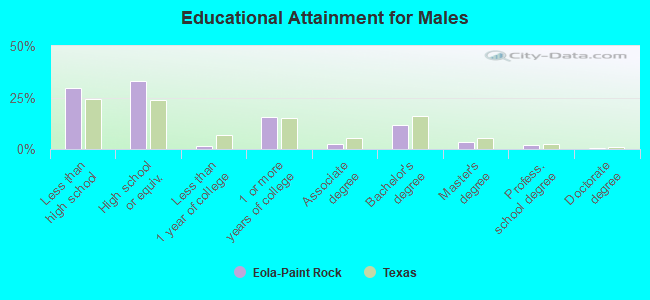
Education attainment for males 25 years and older:
- No schooling: 8
- Nursery to 4th grade: 13
- 5th and 6th grade: 7
- 7th and 8th grade: 12
- 9th grade: 14
- 10th grade: 17
- 11th grade: 10
- 12th grade, no diploma: 8
- High school graduate (or equivalency): 99
- Less than 1 year of college: 5
- Some college more than 1 year, no degree: 47
- Associate degree: 8
- Bachelor's degree: 35
- Master's degree: 10
- Professional school degree: 6
- Doctorate degree: 2
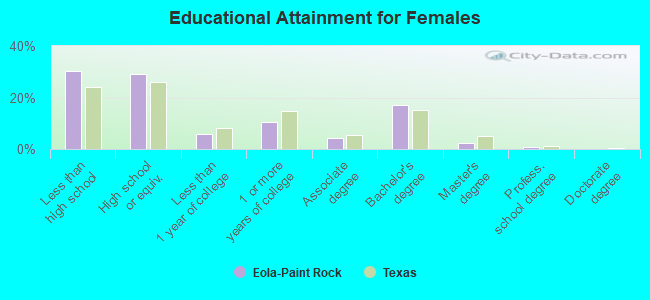
Education attainment for females 25 years and older:
- No schooling: 11
- Nursery to 4th grade: 5
- 5th and 6th grade: 7
- 7th and 8th grade: 30
- 9th grade: 8
- 10th grade: 16
- 11th grade: 7
- 12th grade, no diploma: 12
- High school graduate (or equivalency): 92
- Less than 1 year of college: 18
- Some college more than 1 year, no degree: 33
- Associate degree: 14
- Bachelor's degree: 54
- Master's degree: 7
- Professional school degree: 2
- Doctorate degree: 0


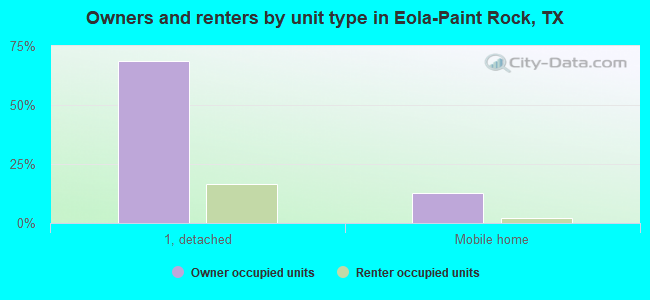
Housing units in structures:
- One, detached: 384
- 20 to 49: 1
- Mobile homes: 71
- Boats, RVs, vans, etc.: 17
Median worth of mobile homes: $73,753
Housing units lacking complete kitchen facilities: 5.7%
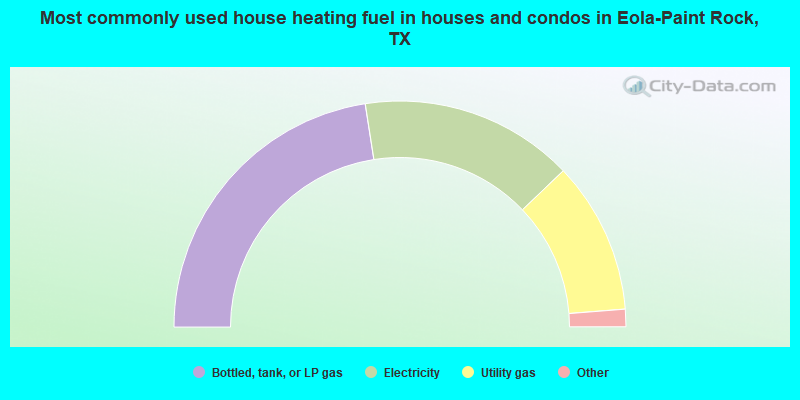
- 45.1%Bottled, tank, or LP gas
- 30.6%Electricity
- 21.8%Utility gas
- 1.4%Fuel oil, kerosene, etc.
- 1.1%Wood
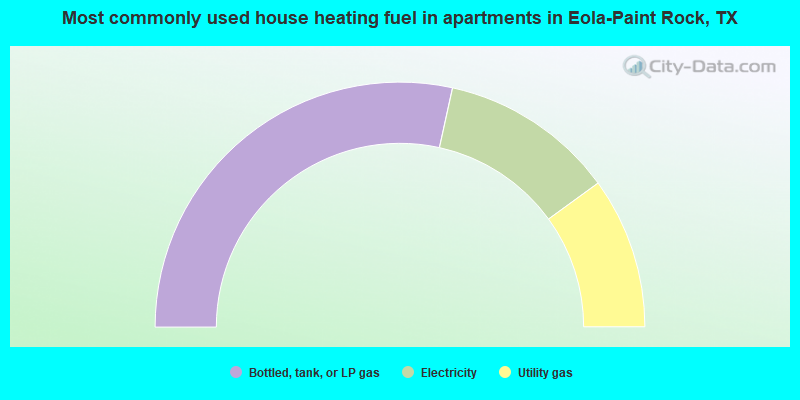
- 56.9%Bottled, tank, or LP gas
- 23.1%Electricity
- 20.0%Utility gas
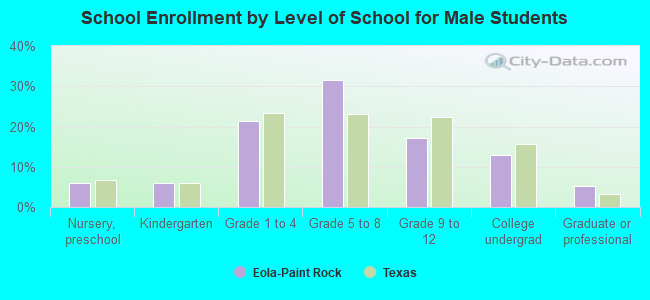
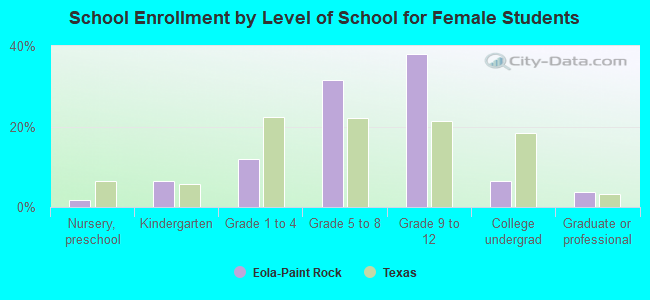
Private vs. public school enrollment:
| Here: | 0.0% |
| Texas: | 6.8% |
| Here: | 0.0% |
| Texas: | 6.2% |
| Here: | 9.1% |
| Texas: | 15.4% |