Housing density: 843 houses/condos per square mile
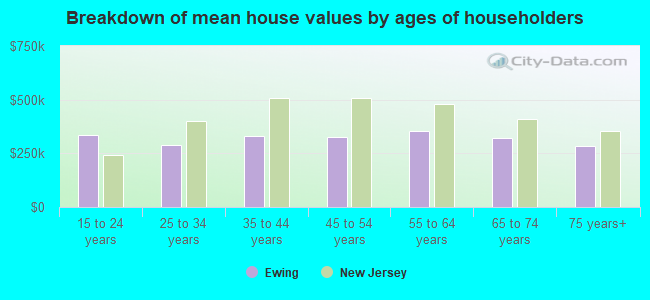
Median price asked for vacant for-sale houses and condos in 2022 in this county: $258,340.
Median contract rent in 2022: $1,345 (lower quartile is $1,145, upper quartile is $1,800)
Median rent asked for vacant for-rent units in 2022: $1,345
Median gross rent in Ewing, NJ in 2022: $1,464
Housing units in Ewing with a mortgage: 5,804 (505 second mortgage, 978 home equity loan, 29 both second mortgage and home equity loan) Houses without a mortgage: 2,974
In family households: 292,582 (58,715 male householders, 30,733 female householders)
64,160 spouses, 104,685 children (99,358 natural, 2,197 adopted, 3,130 stepchildren), 6,468 grandchildren, 4,686 brothers or sisters, 4,229 parents, foster children, 6,569 other relatives, 9,719 non-relatives
In nonfamily households: 55,126 (18,883 male householders (14,603 living alone)), 24,824 female householders (21,275 living alone)), 11,419 nonrelatives
In group quarters: 18,805 (6,065 institutionalized population)
55,323 married couples with children.
19,695 single-parent households (3,573 men, 16,122 women).
86.9% of residents of Ewing speak English at home.
4.1% of residents speak Spanish at home (60% speak English very well, 21% speak English well, 15% speak English not well, 4% don't speak English at all).
7.3% of residents speak other Indo-European language at home (62% speak English very well, 25% speak English well, 10% speak English not well, 2% don't speak English at all).
0.9% of residents speak Asian or Pacific Island language at home (49% speak English very well, 31% speak English well, 15% speak English not well, 5% don't speak English at all).
0.8% of residents speak other language at home (61% speak English very well, 20% speak English well, 15% speak English not well, 4% don't speak English at all).
Foreign born population: 6,164 (15.9%)
(52.7% of them are naturalized citizens)
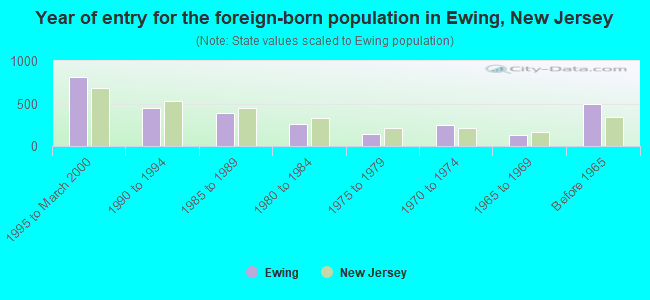
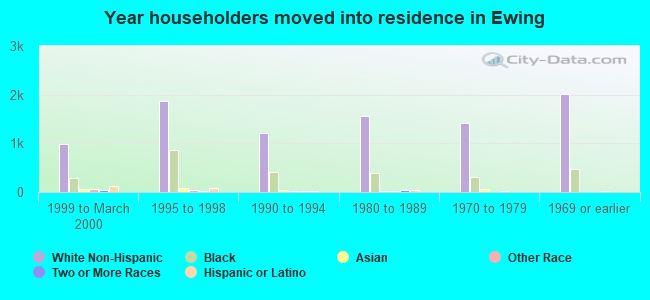
Year of entry for the foreign-born population in Ewing, New Jersey
8101995 to March 2000
4521990 to 1994
3901985 to 1989
2621980 to 1984
1391975 to 1979
2521970 to 1974
1281965 to 1969
496Before 1965
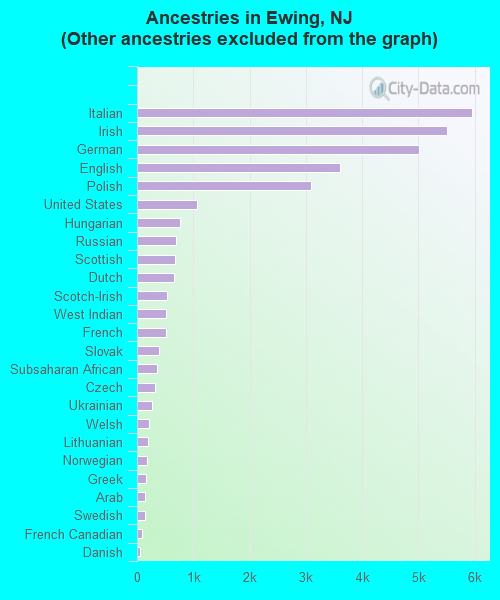
First ancestries reported:
Other: 10,492 (25.2%)
Italian: 5,955 (14.3%)
Irish: 5,501 (13.2%)
German: 5,016 (12.0%)
English: 3,600 (8.6%)
Polish: 3,091 (7.4%)
United States: 1,060 (2.5%)
Hungarian: 763 (1.8%)
Russian: 692 (1.7%)
Scottish: 670 (1.6%)
Dutch: 653 (1.6%)
Scotch-Irish: 531 (1.3%)
West Indian: 524 (1.3%)
French: 523 (1.3%)
Slovak: 397 (1.0%)
Subsaharan African: 364 (0.9%)
Czech: 315 (0.8%)
Ukrainian: 260 (0.6%)
Welsh: 209 (0.5%)
Lithuanian: 194 (0.5%)
Norwegian: 174 (0.4%)
Greek: 168 (0.4%)
Arab: 147 (0.4%)
Swedish: 147 (0.4%)
French Canadian: 92 (0.2%)
Danish: 61 (0.1%)
Swiss: 34 (0.08%)
Portuguese: 30 (0.07%)
Most common places of birth for foreign-born residents (%):
Jamaica
Ewing:
8.9% (262)
New Jersey:
2.5% (36,443)
Poland
Ewing:
8.4% (245)
New Jersey:
3.8% (55,466)
India
Ewing:
7.1% (207)
New Jersey:
8.1% (119,497)
Haiti
Ewing:
5.0% (146)
New Jersey:
2.2% (31,963)
Colombia
Ewing:
4.8% (142)
New Jersey:
4.7% (69,754)
Germany
Ewing:
4.7% (138)
New Jersey:
2.3% (33,531)
United Kingdom
Ewing:
4.3% (125)
New Jersey:
2.1% (30,355)
Pakistan
Ewing:
3.8% (112)
New Jersey:
1.1% (16,052)
Italy
Ewing:
3.8% (112)
New Jersey:
4.0% (58,395)
Czechoslovakia (includes Czech Republic and Slovakia)
Ewing:
2.9% (84)
New Jersey:
0.4% (5,744)
Korea
Ewing:
2.7% (78)
New Jersey:
3.5% (51,970)
Costa Rica
Ewing:
2.4% (69)
New Jersey:
0.8% (12,383)
Other Caribbean
Ewing:
2.3% (68)
New Jersey:
0.5% (7,928)
Other Western Asia
Ewing:
2.1% (62)
New Jersey:
0.3% (4,515)
El Salvador
Ewing:
2.1% (61)
New Jersey:
1.9% (28,595)
Ukraine
Ewing:
1.9% (57)
New Jersey:
1.0% (14,768)
Other Eastern Europe
Ewing:
1.9% (56)
New Jersey:
1.2% (17,647)
Philippines
Ewing:
1.8% (54)
New Jersey:
4.7% (69,773)
Sierra Leone
Ewing:
1.8% (52)
New Jersey:
0.1% (1,719)
Vietnam
Ewing:
1.8% (52)
New Jersey:
0.9% (13,337)
Netherlands
Ewing:
1.7% (51)
New Jersey:
0.3% (3,781)
Cuba
Ewing:
1.6% (48)
New Jersey:
3.7% (55,241)
Other Western Africa
Ewing:
1.5% (45)
New Jersey:
0.4% (5,395)
Canada
Ewing:
1.5% (45)
New Jersey:
1.1% (16,333)
Place of birth for U.S.-born residents:
This state: 23,775
Other state: 8,529
Northeast: 4,962
Midwest: 728
South: 2,584
West: 255
63% of Ewing residents lived in the same house 5 years ago. Out of people who lived in different houses, 56% lived in this county. Out of people who lived in different counties, 72% lived in New Jersey.
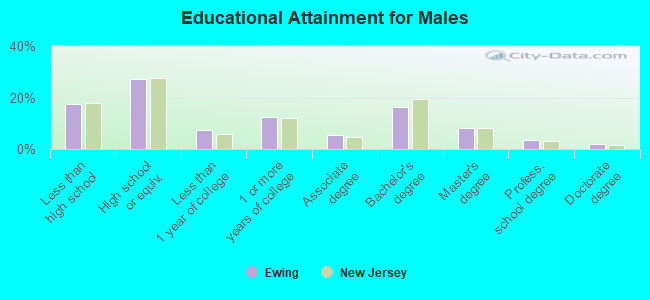
Education attainment for males 25 years and older:
No schooling: 48
Nursery to 4th grade: 66
5th and 6th grade: 124
7th and 8th grade: 324
9th grade: 308
10th grade: 298
11th grade: 285
12th grade, no diploma: 469
High school graduate (or equivalency): 3,024
Less than 1 year of college: 822
Some college more than 1 year, no degree: 1,400
Associate degree: 614
Bachelor's degree: 1,826
Master's degree: 895
Professional school degree: 384
Doctorate degree: 216
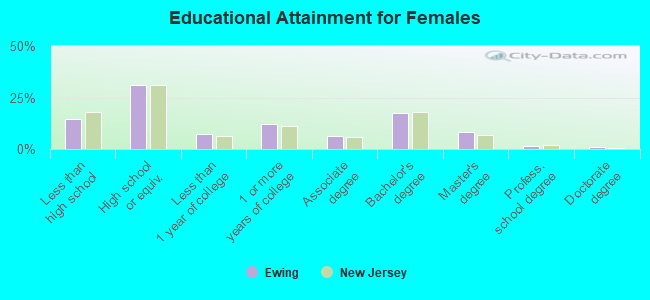
Education attainment for females 25 years and older:
No schooling: 49
Nursery to 4th grade: 43
5th and 6th grade: 82
7th and 8th grade: 347
9th grade: 253
10th grade: 246
11th grade: 258
12th grade, no diploma: 468
High school graduate (or equivalency): 3,745
Less than 1 year of college: 895
Some college more than 1 year, no degree: 1,437
Associate degree: 787
Bachelor's degree: 2,114
Master's degree: 967
Professional school degree: 199
Doctorate degree: 121
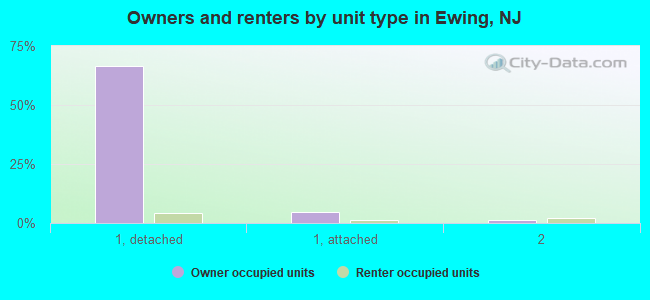
Housing units in structures:
One, detached: 9,079
One, attached: 832
Two: 430
3 or 4: 286
5 to 9: 236
10 to 19: 1,057
20 to 49: 271
50 or more: 733
Housing units lacking complete plumbing facilities: 0.4%
Housing units lacking complete kitchen facilities: 0.1%