Fernandina Beach, FL (Florida) Houses and Residents
Estimated median house or condo value in 2022: $531,792 (it was $134,800 in 2000 )
Fernandina Beach:
$531,792Florida:
$354,100
Lower value quartile - upper value quartile: $366,899 - $806,364Mean price in 2022: Detached houses: $533,095 Here:
$533,095State:
$500,941
Townhouses or other attached units: $286,636 Here:
$286,636State:
$370,869
In 2-unit structures: $347,486 Here:
$347,486State:
$423,188
In 3-to-4-unit structures: $406,970 Here:
$406,970State:
$309,944
In 5-or-more-unit structures: $334,500 Here:
$334,500State:
$447,145
Mobile homes: $92,632 Here:
$92,632State:
$113,202
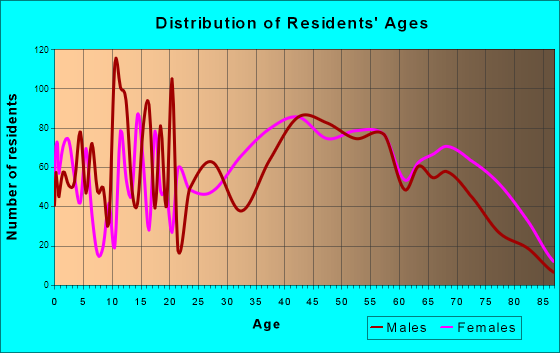
Total population: 12,103 (Urban population: 10,242 (all inside urban clusters), Rural population: 0)
Houses: 8,119 (6,515 occupied: 5,671 owner occupied, 1,233 renter occupied )
% of renters here:
18%State:
33%
Housing density: 758 houses/condos per square mile
Median price asked for vacant for-sale houses and condos in 2022: $900,021.
Median contract rent in 2022: $1,576 (lower quartile is $741, upper quartile is over $2,000)
Median rent asked for vacant for-rent units in 2022: $4,032
Median gross rent in Fernandina Beach, FL in 2022: $1,662
Housing units in Fernandina Beach with a mortgage: 3,209 (199 second mortgage, 0 home equity loan, 139 both second mortgage and home equity loan )Houses without a mortgage: 215
Median household income for houses/condos with a mortgage: $129,779
Median household income for apartments without a mortgage: $60,587
Median monthly housing costs: $1,262
Data:
Median house or condo value ($)
Median house or condo value ($ change since 2000)
Median house or condo value ($) - White
Median house or condo value ($) - Black or African American
Median house or condo value ($) - Asian
Median house or condo value ($) - Hispanic or Latino
Median house or condo value ($) - American Indian and Alaska Native
Median house or condo value ($) - Multirace
Median house or condo value ($) - Other Race
Median price asked for mobile homes ($)
Household density (households per square mile)
Mean house or condo value by units in structure - 1, detached ($)
Mean house or condo value by units in structure - 1, attached ($)
Mean house or condo value by units in structure - 2 ($)
Mean house or condo value by units in structure by units in structure - 3 or 4 ($)
Mean house or condo value by units in structure - 5 or more ($)
Mean house or condo value by units in structure - Boat, RV, van, etc. ($)
Mean house or condo value by units in structure - Mobile home ($)
Median contract rent ($)
Median contract rent - Lower quartile ($)
Median contract rent - Upper quartile ($)
Median gross rent ($)
Urban houses (%)
Rural houses (%)
Houses occupied (%)
Houses occupied (% change since 2000)
Houses owner occupied (%)
Houses owner occupied (% change since 2000)
Houses renter occupied (%)
Houses renter occupied (% change since 2000)
Vacant housing units - For rent (%)
Vacant housing units - For rent (% change since 2000)
Vacant housing units - For sale only (%)
Vacant housing units - For sale only (% change since 2000)
Vacant housing units - Rented or sold, not occupied (%)
Vacant housing units - Rented or sold, not occupied (% change since 2000)
Vacant housing units - For seasonal, recreational, or occasional use (%)
Vacant housing units - For seasonal, recreational, or occasional use (% change since 2000)
Vacant housing units - For migrant workers (%)
Vacant housing units - For migrant workers (% change since 2000)
Vacant housing units - Other vacant (%)
Vacant housing units - Other vacant (% change since 2000)
Median monthly housing costs ($)
Median household income for houses/condos with a mortgage ($)
Median household income for houses/condos without a mortgage ($)
Median household income ($)
Median household income ($) - White
Median household income ($) - Black or African American
Median household income ($) - Asian
Median household income ($) - Hispanic or Latino
Median household income ($) - American Indian and Alaska Native
Median household income ($) - Multirace
Median household income ($) - Other Race
Mortgage status - with mortgage (%)
Mortgage status - with second mortgage (%)
Mortgage status - with home equity loan (%)
Mortgage status - with both second mortgage and home equity loan (%)
Mortgage status - without a mortgage (%)
Median year house/condo built
Median year apartment built
Household type by relationship - Male householder living alone (%)
Household type by relationship - Male householder not living alone (%)
Household type by relationship - Female householder living alone (%)
Household type by relationship - Female householder not living alone (%)
Household type by relationship - Opposite-Sex spouse (%)
Household type by relationship - Same-Sex spouse (%)
Household type by relationship - Opposite-Sex unmarried partner (%)
Household type by relationship - Same-Sex unmarried partner (%)
Household type by relationship - In group quarters (%)
Size of family households - 2-person household (%)
Size of family households - 3-person household (%)
Size of family households - 4-person household (%)
Size of family households - 5-person household (%)
Size of family households - 6-person household (%)
Size of family households - 7-or-more-person household (%)
Size of nonfamily households - 1-person household (%)
Size of nonfamily households - 2-person household (%)
Size of nonfamily households - 3-person household (%)
Size of nonfamily households - 4-person household (%)
Size of nonfamily households - 5-person household (%)
Size of nonfamily households - 6-person household (%)
Size of nonfamily households - 7-or-moreperson household (%)
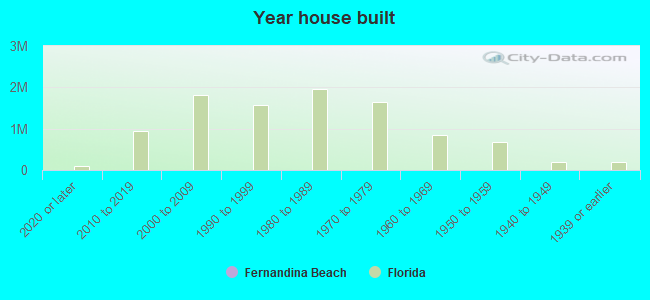
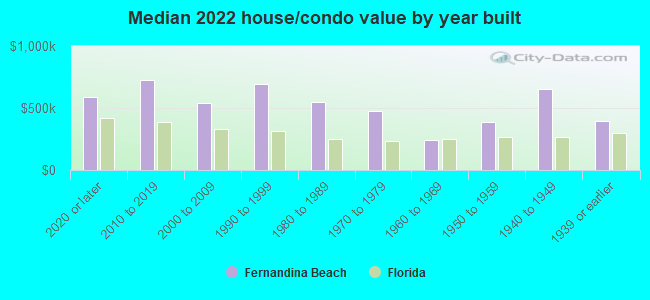
Year house built - Built 2010 or later (%)
Year house built - Built 2000 to 2009 (%)
Year house built - Built 1990 to 1999 (%)
Year house built - Built 1980 to 1989 (%)
Year house built - Built 1970 to 1979 (%)
Year house built - Built 1960 to 1969 (%)
Year house built - Built 1950 to 1959 (%)
Year house built - Built 1940 to 1949 (%)
Year house built - Built 1939 or earlier (%)
Median number of rooms in houses and condos
Median number of rooms in apartments
Median number of bedrooms in owner occupied houses
Mean number of bedrooms in owner occupied houses
Median number of bedrooms in renter occupied houses
Mean number of bedrooms in renter occupied houses
Median number of vehichles in owner occupied houses
Mean number of vehichles in owner occupied houses
Median number of vehichles in renter occupied houses
Mean number of vehichles in renter occupied houses
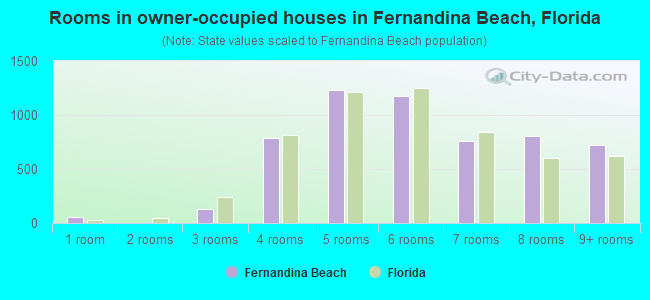
Rooms in owner-occupied houses - 1 room (%)
Rooms in owner-occupied houses - 2 rooms (%)
Rooms in owner-occupied houses - 3 rooms (%)
Rooms in owner-occupied houses - 4 rooms (%)
Rooms in owner-occupied houses - 5 rooms (%)
Rooms in owner-occupied houses - 6 rooms (%)
Rooms in owner-occupied houses - 7 rooms (%)
Rooms in owner-occupied houses - 8 rooms (%)
Rooms in owner-occupied houses - 9+ rooms (%)
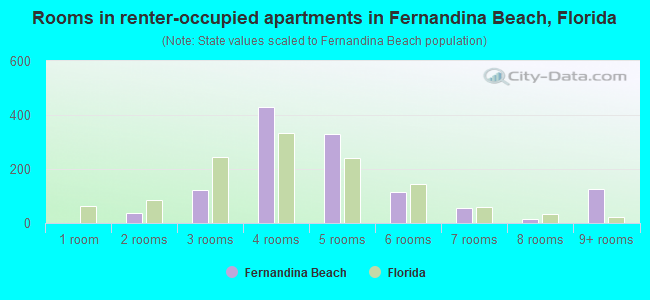
Rooms in renter-occupied houses - 1 room (%)
Rooms in renter-occupied houses - 2 rooms (%)
Rooms in renter-occupied houses - 3 rooms (%)
Rooms in renter-occupied houses - 4 rooms (%)
Rooms in renter-occupied houses - 5 rooms (%)
Rooms in renter-occupied houses - 6 rooms (%)
Rooms in renter-occupied houses - 7 rooms (%)
Rooms in renter-occupied houses - 8 rooms (%)
Rooms in renter-occupied houses - 9+ rooms (%)
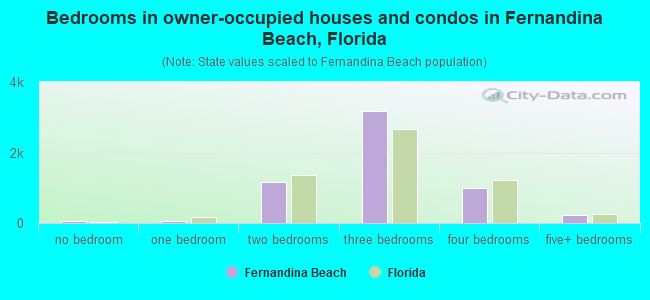
Bedrooms in owner-occupied houses - no bedrooms (%)
Bedrooms in owner-occupied houses - 1 bedroom (%)
Bedrooms in owner-occupied houses - 2 bedrooms (%)
Bedrooms in owner-occupied houses - 3 bedrooms (%)
Bedrooms in owner-occupied houses - 4 bedrooms (%)
Bedrooms in owner-occupied houses - 5+ bedrooms (%)
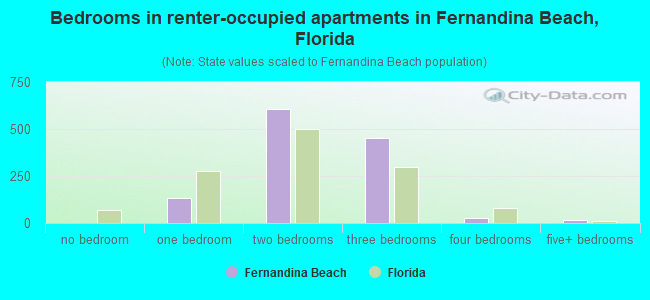
Bedrooms in renter-occupied houses - no bedrooms (%)
Bedrooms in renter-occupied houses - 1 bedroom (%)
Bedrooms in renter-occupied houses - 2 bedrooms (%)
Bedrooms in renter-occupied houses - 3 bedrooms (%)
Bedrooms in renter-occupied houses - 4 bedrooms (%)
Bedrooms in renter-occupied houses - 5+ bedrooms (%)
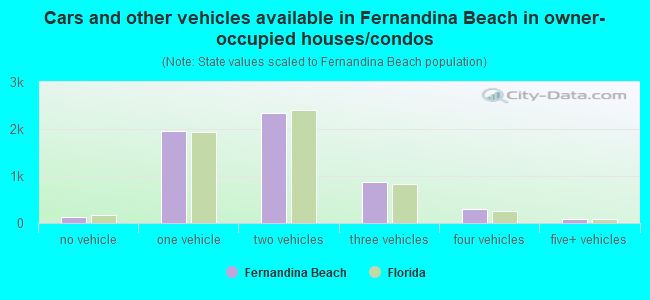
Vehicles available in owner-occupied houses - no vehicle available (%)
Vehicles available in owner-occupied houses - 1 vehicle available(%)
Vehicles available in owner-occupied houses - 2 Vehicles available (%)
Vehicles available in owner-occupied houses - 3 Vehicles available (%)
Vehicles available in owner-occupied houses - 4 Vehicles available (%)
Vehicles available in owner-occupied houses - 5+ Vehicles available (%)
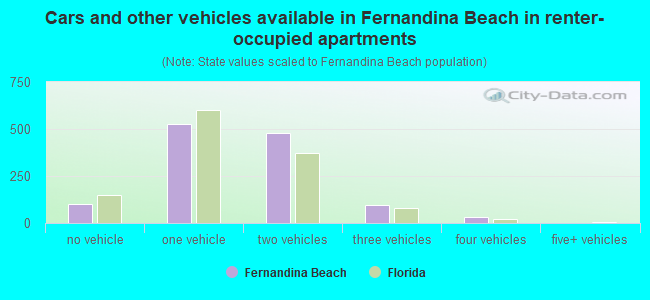
Vehicles available in renter-occupied houses - no vehicle available (%)
Vehicles available in renter-occupied houses - 1 vehicle available (%)
Vehicles available in renter-occupied houses - 2 Vehicles available (%)
Vehicles available in renter-occupied houses - 3 Vehicles available (%)
Vehicles available in renter-occupied houses - 4 Vehicles available (%)
Vehicles available in renter-occupied houses - 5+ Vehicles available (%)
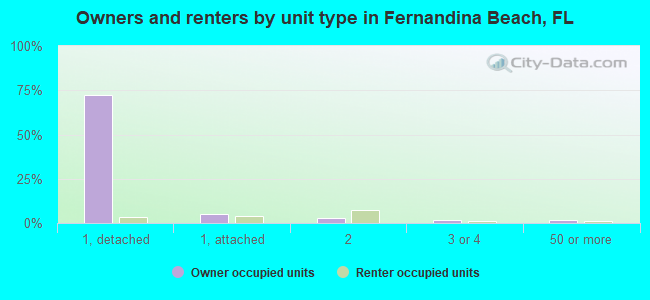
Housing units in structures - 1, detached (%)
Housing units in structures - 1, attached (%)
Housing units in structures - 2 (%)
Housing units in structures - 3 or 4 (%)
Housing units in structures - 5 to 9 (%)
Housing units in structures - 10 to 19 (%)
Housing units in structures - 20 to 49 (%)
Housing units in structures - 50 or more (%)
Housing units in structures - Mobile home (%)
Housing units in structures - Boat, RV, van, etc. (%)
Housing units in structures - Owners - 1, detached (%)
Housing units in structures - Owners - 1, attached (%)
Housing units in structures - Owners - 2 (%)
Housing units in structures - Owners - 3 or 4 (%)
Housing units in structures - Owners - 5 to 9 (%)
Housing units in structures - Owners - 10 to 19 (%)
Housing units in structures - Owners - 20 to 49 (%)
Housing units in structures - Owners - 50 or more (%)
Housing units in structures - Owners - Mobile home (%)
Housing units in structures - Owners - Boat, RV, van, etc. (%)
Housing units in structures - Renters - 1, detached (%)
Housing units in structures - Renters - 1, attached (%)
Housing units in structures - Renters - 2 (%)
Housing units in structures - Renters - 3 or 4 (%)
Housing units in structures - Renters - 5 to 9 (%)
Housing units in structures - Renters - 10 to 19 (%)
Housing units in structures - Renters - 20 to 49 (%)
Housing units in structures - Renters - 50 or more (%)
Housing units in structures - Renters - Mobile home (%)
Housing units in structures - Renters - Boat, RV, van, etc. (%)
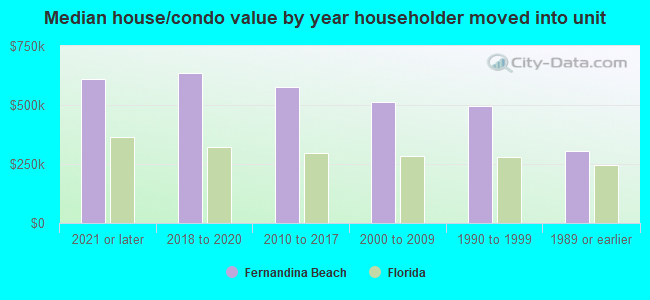
House/condo owner moved in on average (years ago)
Renter moved in on average (years ago)
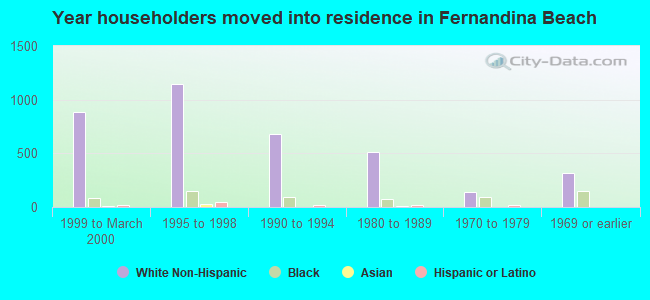
Year householder moved into unit - Moved in 1999 to March 2000 (%)
Year householder moved into unit - Moved in 1999 to March 2000 (%) - White
Year householder moved into unit - Moved in 1999 to March 2000 (%) - Black or African American
Year householder moved into unit - Moved in 1999 to March 2000 (%) - Asian
Year householder moved into unit - Moved in 1999 to March 2000 (%) - Hispanic or Latino
Year householder moved into unit - Moved in 1999 to March 2000 (%) - American Indian and Alaska Native
Year householder moved into unit - Moved in 1999 to March 2000 (%) - Multirace
Year householder moved into unit - Moved in 1999 to March 2000 (%) - Other Race
Year householder moved into unit - Moved in 1995 to 1998 (%)
Year householder moved into unit - Moved in 1995 to 1998 (%) - White
Year householder moved into unit - Moved in 1995 to 1998 (%) - Black or African American
Year householder moved into unit - Moved in 1995 to 1998 (%) - Asian
Year householder moved into unit - Moved in 1995 to 1998 (%) - Hispanic or Latino
Year householder moved into unit - Moved in 1995 to 1998 (%) - American Indian and Alaska Native
Year householder moved into unit - Moved in 1995 to 1998 (%) - Multirace
Year householder moved into unit - Moved in 1995 to 1998 (%) - Other Race
Year householder moved into unit - Moved in 1990 to 1994 (%)
Year householder moved into unit - Moved in 1990 to 1994 (%) - White
Year householder moved into unit - Moved in 1990 to 1994 (%) - Black or African American
Year householder moved into unit - Moved in 1990 to 1994 (%) - Asian
Year householder moved into unit - Moved in 1990 to 1994 (%) - Hispanic or Latino
Year householder moved into unit - Moved in 1990 to 1994 (%) - American Indian and Alaska Native
Year householder moved into unit - Moved in 1990 to 1994 (%) - Multirace
Year householder moved into unit - Moved in 1990 to 1994 (%) - Other Race
Year householder moved into unit - Moved in 1980 to 1989 (%)
Year householder moved into unit - Moved in 1980 to 1989 (%) - White
Year householder moved into unit - Moved in 1980 to 1989 (%) - Black or African American
Year householder moved into unit - Moved in 1980 to 1989 (%) - Asian
Year householder moved into unit - Moved in 1980 to 1989 (%) - Hispanic or Latino
Year householder moved into unit - Moved in 1980 to 1989 (%) - American Indian and Alaska Native
Year householder moved into unit - Moved in 1980 to 1989 (%) - Multirace
Year householder moved into unit - Moved in 1980 to 1989 (%) - Other Race
Year householder moved into unit - Moved in 1970 to 1979 (%)
Year householder moved into unit - Moved in 1970 to 1979 (%) - White
Year householder moved into unit - Moved in 1970 to 1979 (%) - Black or African American
Year householder moved into unit - Moved in 1970 to 1979 (%) - Asian
Year householder moved into unit - Moved in 1970 to 1979 (%) - Hispanic or Latino
Year householder moved into unit - Moved in 1970 to 1979 (%) - American Indian and Alaska Native
Year householder moved into unit - Moved in 1970 to 1979 (%) - Multirace
Year householder moved into unit - Moved in 1970 to 1979 (%) - Other Race
Year householder moved into unit - Moved in 1969 or earlier (%)
Year householder moved into unit - Moved in 1969 or earlier (%) - White
Year householder moved into unit - Moved in 1969 or earlier (%) - Black or African American
Year householder moved into unit - Moved in 1969 or earlier (%) - Asian
Year householder moved into unit - Moved in 1969 or earlier (%) - Hispanic or Latino
Year householder moved into unit - Moved in 1969 or earlier (%) - American Indian and Alaska Native
Year householder moved into unit - Moved in 1969 or earlier (%) - Multirace
Year householder moved into unit - Moved in 1969 or earlier (%) - Other Race
Housing units lacking complete plumbing facilities (%)
Housing units lacking complete kitchen facilities (%)
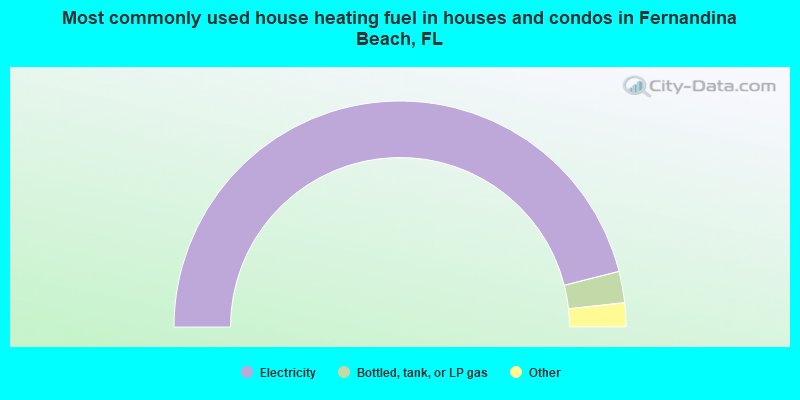
House heating fuel used in houses and condos - Utility gas (%)
House heating fuel used in houses and condos - Bottled, tank, or LP gas (%)
House heating fuel used in houses and condos - Electricity (%)
House heating fuel used in houses and condos - Fuel oil, kerosene, etc. (%)
House heating fuel used in houses and condos - Coal or coke (%)
House heating fuel used in houses and condos - Wood (%)
House heating fuel used in houses and condos - Solar energy (%)
House heating fuel used in houses and condos - Other fuel (%)
House heating fuel used in houses and condos - No fuel used (%)
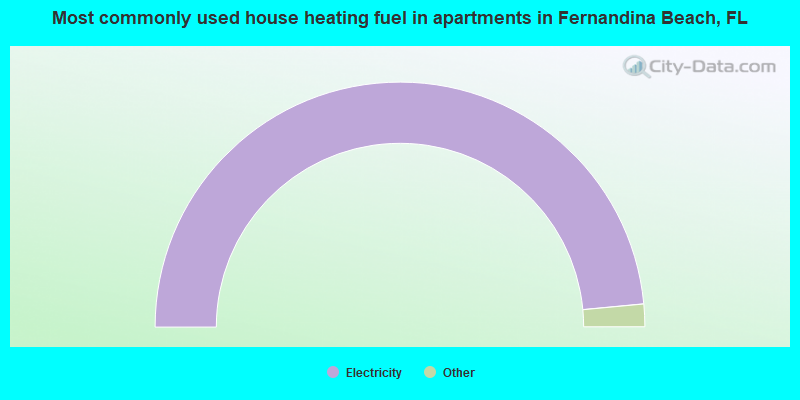
House heating fuel used in apartments - Utility gas (%)
House heating fuel used in apartments - Bottled, tank, or LP gas (%)
House heating fuel used in apartments - Electricity (%)
House heating fuel used in apartments - Fuel oil, kerosene, etc. (%)
House heating fuel used in apartments - Coal or coke (%)
House heating fuel used in apartments - Wood (%)
House heating fuel used in apartments - Solar energy (%)
House heating fuel used in apartments - Other fuel (%)
House heating fuel used in apartments - No fuel used (%)
Median year house/condo built: 1989Median year apartment built: 1987Household type by relationship:
Households: 13,933
Male householders: 3,057 (793 living alone ), Female householders: 3,431 (1,405 living alone )3,053 spouses (3,009 opposite-sex spouses ), 207 unmarried partners , (207 opposite-sex unmarried partners ), 2,792 children (2,403 natural , 126 adopted , 263 stepchildren ), 276 grandchildren , 135 brothers or sisters , 148 parents , 0 foster children , 189 other relatives , 269 non-relatives In group quarters: 370
Size of family households: 3,078 2-persons , 907 3-persons , 221 4-persons , 117 5-persons , 21 6-persons , 56 7-or-more-persons .
Size of nonfamily households: 2,203 1-person , 401 2-persons , 16 4-persons .
951 married couples with children. single-parent households (155 men , 333 women ).
91.2% of residents of Fernandina Beach speak English at home. of residents speak Spanish at home (59% speak English very well , 25% speak English well , 9% speak English not well , 7% don't speak English at all ).of residents speak other Indo-European language at home (100% speak English very well ).of residents speak Asian or Pacific Island language at home (100% speak English very well ).of residents speak other language at home (100% speak English very well ).
Foreign born population: 751 (5.4%)of them are naturalized citizens )
Median number of rooms in houses and condos:
Median number of rooms in apartments
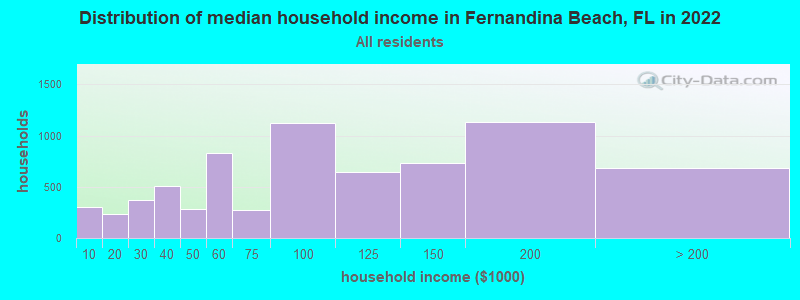
Fernandina Beach, FL household income distribution 304 Less than $10,000231 $10,000 to $19,999371 $20,000 to $29,999506 $30,000 to $39,999280 $40,000 to $49,999834 $50,000 to $59,999275 $60,000 to $74,9991,120 $75,000 to $99,999644 $100,000 to $124,999735 $125,000 to $149,9991,133 $150,000 to $199,999688 $200,000 or more
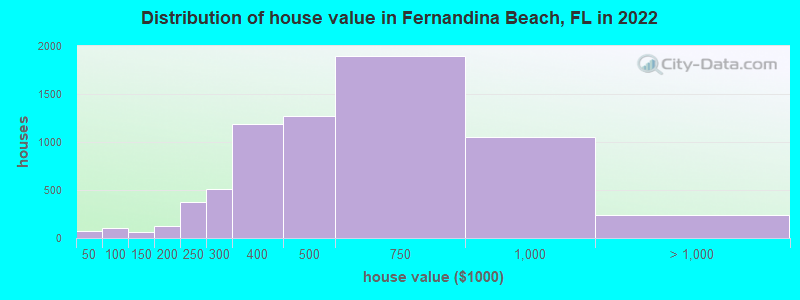
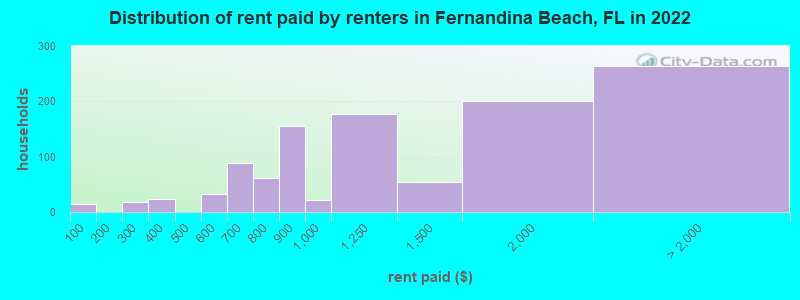
Home value of owner - occupied houses in 2022 in Fernandina Beach, FL 68 Less than $10,00080 $60,000 to $69,99921 $90,000 to $99,99913 $100,000 to $124,99946 $125,000 to $149,99920 $150,000 to $174,999107 $175,000 to $199,999378 $200,000 to $249,999507 $250,000 to $299,9991,189 $300,000 to $399,9991,266 $400,000 to $499,9991,900 $500,000 to $749,9991,053 $750,000 to $999,999157 $1,000,000 to $1,499,99952 $1,500,000 to $1,999,99933 $2,000,000 or moreRent paid by renters in 2022 in Fernandina Beach, FL 14 Less than $10017 $250 to $29924 $300 to $34933 $550 to $59942 $600 to $64945 $650 to $69926 $700 to $74936 $750 to $799155 $800 to $89921 $900 to $999177 $1,000 to $1,24954 $1,250 to $1,499201 $1,500 to $1,999104 $2,000 to $2,49958 $2,500 to $2,99932 $3,000 to $3,4999 $3,500 or more57 No cash rent
Percentage of workers working in this county: 79.4%Number of people working at home: 1,180 (18.8% of all workers )
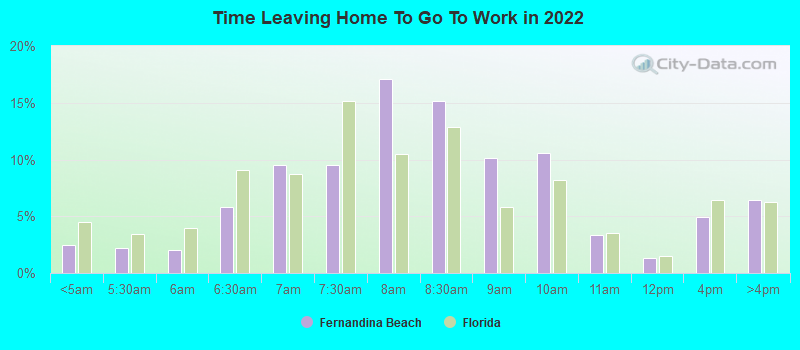
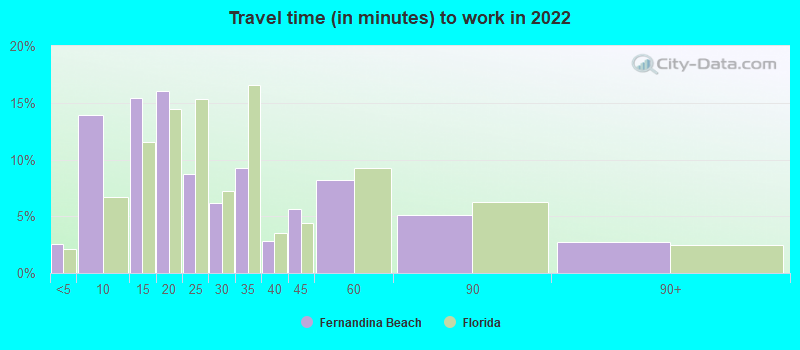
Travel time to work (commute)
Less than 5 minutes: 2315 to 9 minutes: 1,51210 to 14 minutes: 92615 to 19 minutes: 75920 to 24 minutes: 55825 to 29 minutes: 22130 to 34 minutes: 21235 to 39 minutes: 9940 to 44 minutes: 4145 to 59 minutes: 38560 to 89 minutes: 53290 or more minutes: 166
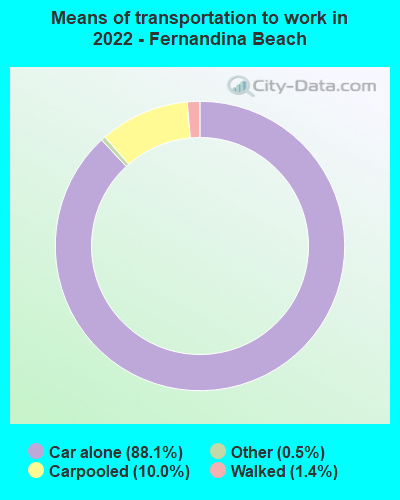
Means of transportation to work:
Drove a car alone: 7,496 (75.6%)Carpooled: 904 (9.1%)Bus : 2 (0.0%)Taxi: 44 (0.4%)Walked: 130 (1.3%)Worked at home: 1,180 (11.9%)
Unemployment by race in 2022
Unemployment rate for White non-Hispanic residents 2.2% Males0.5% FemalesUnemployment rate for Black residents 11.5% Females
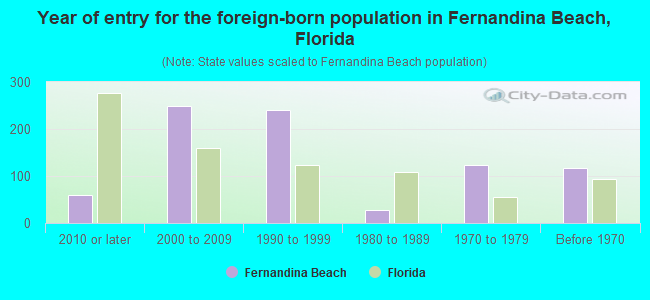
Year of entry for the foreign-born population in Fernandina Beach, Florida
59 2010 or later 250 2000 to 2009 241 1990 to 1999 27 1980 to 1989 123 1970 to 1979 117 Before 1970
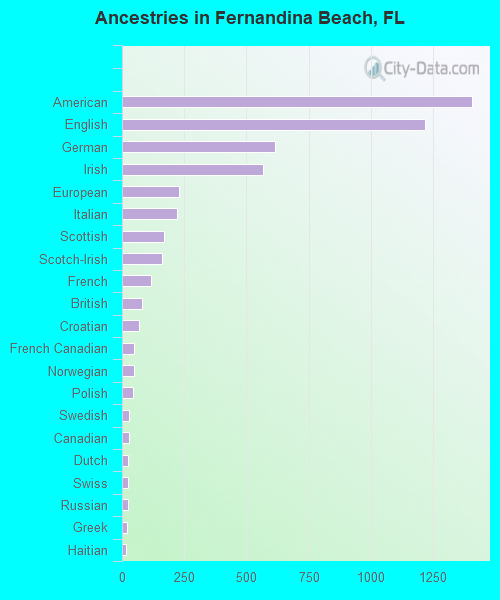
First ancestries reported:
American: 1,405 (19.4%)
English: 1,216 (16.8%)
German: 617 (8.5%)
Irish: 566 (7.8%)
European: 231 (3.2%)
Italian: 221 (3.0%)
Scottish: 167 (2.3%)
Scotch-Irish: 161 (2.2%)
French: 117 (1.6%)
British: 79 (1.1%)
Croatian: 69 (1.0%)
French Canadian: 50 (0.7%)
Norwegian: 49 (0.7%)
Polish: 44 (0.6%)
Swedish: 29 (0.4%)
Canadian: 28 (0.4%)
Dutch: 26 (0.4%)
Swiss: 26 (0.4%)
Russian: 23 (0.3%)
Greek: 20 (0.3%)
Haitian: 17 (0.2%)
Danish: 10 (0.1%)
Hungarian: 10 (0.1%)
Scandinavian: 10 (0.1%)
Eastern European: 7 (0.10%)
Finnish: 7 (0.10%)
Cape Verdean: 5 (0.07%) Most common places of birth for foreign-born residents (%): Colombia Fernandina Beach:
14.0% (133)Florida:
6.5% (298,669)
Philippines Fernandina Beach:
10.9% (103)Florida:
1.8% (84,403)
Germany Fernandina Beach:
8.9% (84)Florida:
1.2% (54,272)
Mexico Fernandina Beach:
7.6% (72)Florida:
5.6% (257,152)
Cuba Fernandina Beach:
7.2% (68)Florida:
22.0% (1,006,576)
Canada Fernandina Beach:
5.4% (51)Florida:
2.4% (109,132)
Croatia Fernandina Beach:
4.9% (46)Florida:
0.1% (3,756)
Pakistan Fernandina Beach:
4.2% (40)Florida:
0.3% (13,569)
France Fernandina Beach:
3.9% (37)Florida:
0.4% (20,008)
Uruguay Fernandina Beach:
3.6% (34)Florida:
0.3% (14,809)
Costa Rica Fernandina Beach:
3.3% (31)Florida:
0.4% (16,570)
Dominican Republic Fernandina Beach:
2.6% (25)Florida:
3.0% (137,727)
Argentina Fernandina Beach:
2.6% (25)Florida:
1.3% (57,263)
Bangladesh Fernandina Beach:
2.3% (22)Florida:
0.3% (13,053)
Singapore Fernandina Beach:
2.1% (20)Florida:
0.0% (1,221)
Korea Fernandina Beach:
2.1% (20)Florida:
0.4% (19,445)
South Africa Fernandina Beach:
1.7% (16)Florida:
0.2% (11,243)
Place of birth for U.S.-born residents:
This state: 4,144Other state: 8,855Northeast: 3,301Midwest: 1,340South: 3,764West: 548 86.3% of Fernandina Beach residents lived in the same house 1 years ago.
Out of people who lived in different houses, 21.4% lived in this county.
Out of people who lived in different counties, 44.1% lived in Florida.
Fernandina Beach:
86.3%State average:
86.3%
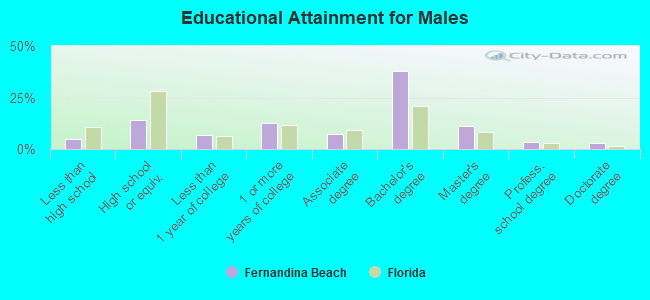
Education attainment for males 25 years and older:
No schooling: 31Nursery to 4th grade: 05th and 6th grade: 07th and 8th grade: 899th grade: 4910th grade: 2511th grade: 2112th grade, no diploma: 50High school graduate (or equivalency): 815Less than 1 year of college: 381Some college more than 1 year, no degree: 714Associate degree: 409Bachelor's degree: 2,178Master's degree: 632Professional school degree: 183Doctorate degree: 153
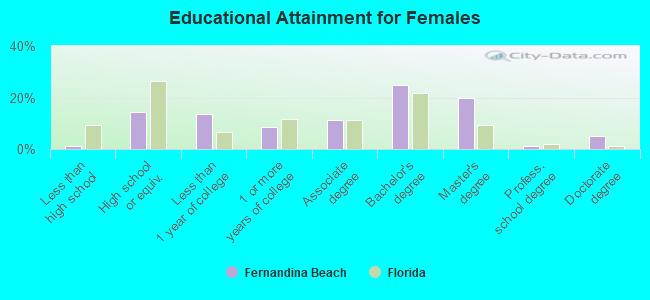
Education attainment for females 25 years and older:
No schooling: 14Nursery to 4th grade: 205th and 6th grade: 07th and 8th grade: 09th grade: 1710th grade: 1511th grade: 812th grade, no diploma: 8High school graduate (or equivalency): 999Less than 1 year of college: 932Some college more than 1 year, no degree: 584Associate degree: 791Bachelor's degree: 1,730Master's degree: 1,384Professional school degree: 94Doctorate degree: 353
Housing units in structures:
One, detached: 5,711One, attached: 504Two: 5813 or 4: 2745 to 9: 44510 to 19: 18020 to 49: 18350 or more: 200Mobile homes: 36House/condo owner moved in on average 10 years ago
Renter moved in on average 1 years ago
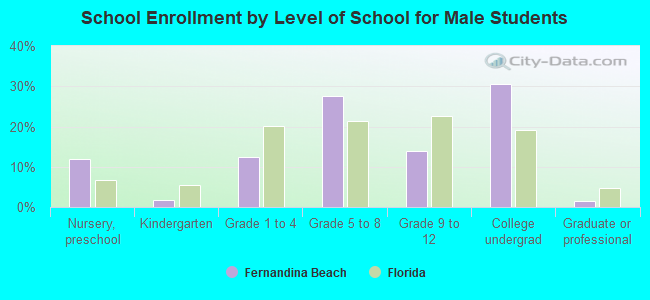
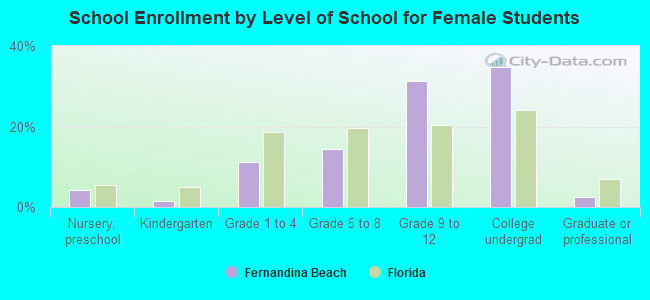
Private vs. public school enrollment:
Students in private schools in grades 1 to 8 (elementary and middle school): 91 Students in private schools in grades 9 to 12 (high school): 41 Students in private undergraduate colleges: 73