Fisher, IL (Illinois) Houses and Residents
| Fisher: | $160,231 |
| Illinois: | $251,600 |
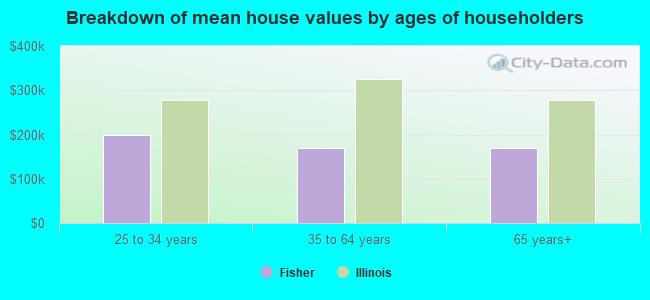
Mean price in 2022:
Detached houses: $159,378
Here: $159,378 State: $310,164 Townhouses or other attached units: $96,386
Here: $96,386 State: $286,230 Mobile homes: $5,311
Here: $5,311 State: $78,855
Total population: 1,960 (Urban population: 0, Rural population: 1,669 (all nonfarm))
Houses: 714 (657 occupied: 569 owner occupied, 93 renter occupied)
| % of renters here: | 14% |
| State: | 33% |
Housing density: 720 houses/condos per square mile
Median price asked for vacant for-sale houses and condos in 2022: $113,505.
Median contract rent in 2022: $687 (lower quartile is $611, upper quartile is $730)
Median rent asked for vacant for-rent units in 2022: $557
Median gross rent in Fisher, IL in 2022: $871
Housing units in Fisher with a mortgage: 375 (18 second mortgage, 0 home equity loan, 9 both second mortgage and home equity loan)
Houses without a mortgage: 14
Median household income for houses/condos with a mortgage: $107,137
Median household income for apartments without a mortgage: $68,965
Median monthly housing costs: $1,017
Compare current foreclosures near Fisher, IL:
| Photo | Address | Area | Beds / Baths | Price | Details |
|---|---|---|---|---|---|

|
#1
N Main St
Saybrook, IL 61770
|
1,351 sq. feet
|
2 baths 4 beds |
$160,000
|
show details |

|
#2
S Washington St
Paxton, IL 60957
|
2,027 sq. feet
|
2 baths 4 beds |
$179,900
|
show details |

|
#3
N Church St
Gibson City, IL 60936
|
3,507 sq. feet
|
3 baths 4 beds |
$92,500
|
show details |

|
#4
North St
Fisher, IL 61843
|
- sq. feet
|
- baths - beds |
show details | |

|
#5
W Franklin St
Paxton, IL 60957
|
1,990 sq. feet
|
1 baths 4 beds |
show details | |

|
#6
E Grove Ave
Rantoul, IL 61866
|
800 sq. feet
|
1 baths 2 beds |
show details | |

|
#7
W Clinton Ave
Farmer City, IL 61842
|
1,180 sq. feet
|
1 baths 5 beds |
show details | |

|
#8
W South St
Seymour, IL 61875
|
934 sq. feet
|
1 baths - beds |
show details | |

|
#9
Centennial Dr
Champaign, IL 61821
|
- sq. feet
|
1 baths 3 beds |
show details | |

|
#10
N Vine St
Bellflower, IL 61724
|
1,220 sq. feet
|
1 baths - beds |
show details |
| Photo | Address | Area | Beds / Baths | Price | Details |
|---|---|---|---|---|---|

|
#11
N Champaign St
Champaign, IL 61820
|
- sq. feet
|
- baths - beds |
show details | |

|
#12
S Walnut St
Bondville, IL 61815
|
- sq. feet
|
- baths - beds |
show details | |

|
#13
Kimberly Dr
Champaign, IL 61821
|
- sq. feet
|
- baths - beds |
show details | |

|
#14
E Main St Ste 200
Champaign, IL 61820
|
- sq. feet
|
- baths - beds |
show details | |

|
#15
Carver Dr
Champaign, IL 61820
|
- sq. feet
|
- baths - beds |
show details | |

|
#16
W Eureka St
Champaign, IL 61821
|
- sq. feet
|
- baths - beds |
show details | |

|
#17
Pheasant Ridge Rd
Mahomet, IL 61853
|
- sq. feet
|
- baths - beds |
show details | |

|
#18
W Hill St
Champaign, IL 61820
|
- sq. feet
|
- baths - beds |
show details | |

|
#19
W Bradley Ave
Champaign, IL 61821
|
- sq. feet
|
- baths - beds |
show details | |

|
#20
W Columbia Ave
Champaign, IL 61820
|
- sq. feet
|
- baths - beds |
show details |
| Photo | Address | Area | Beds / Baths | Price | Details |
|---|---|---|---|---|---|

|
#21
Feather Ln
Saybrook, IL 61770
|
- sq. feet
|
- baths - beds |
show details | |

|
#22
W Washington St
Champaign, IL 61820
|
- sq. feet
|
- baths - beds |
show details | |

|
#23
N 4th St # 1304
Champaign, IL 61820
|
- sq. feet
|
- baths - beds |
show details | |

|
#24
Garden Hills Dr
Champaign, IL 61821
|
- sq. feet
|
- baths - beds |
show details | |

|
#25
W Church St
Champaign, IL 61821
|
- sq. feet
|
- baths - beds |
show details | |

|
#26
John Jay St
Urbana, IL 61802
|
- sq. feet
|
- baths - beds |
show details | |

|
#27
E Hill St
Champaign, IL 61820
|
- sq. feet
|
- baths - beds |
show details | |

|
#28
David Dr
Champaign, IL 61821
|
- sq. feet
|
- baths - beds |
show details | |

|
#29
Palmer Dr # 4
Champaign, IL 61822
|
- sq. feet
|
- baths - beds |
show details | |

|
#30
Philo Rd
Urbana, IL 61801
|
- sq. feet
|
- baths - beds |
show details |
| Photo | Address | Area | Beds / Baths | Price | Details |
|---|---|---|---|---|---|

|
#31
Melrose Dr Apt C
Champaign, IL 61820
|
- sq. feet
|
- baths - beds |
show details | |

|
#32
E California Ave # 1
Urbana, IL 61801
|
- sq. feet
|
- baths - beds |
show details | |

|
#33
Shemauger Trl
Urbana, IL 61802
|
- sq. feet
|
- baths - beds |
show details | |

|
#34
S Walnut St
Urbana, IL 61801
|
- sq. feet
|
- baths - beds |
show details | |

|
#35
W Illinois St Apt 311
Urbana, IL 61801
|
- sq. feet
|
- baths - beds |
show details | |

|
#36
W William St
Champaign, IL 61821
|
- sq. feet
|
- baths - beds |
show details | |

|
#37
W Illinois St Apt 412
Urbana, IL 61801
|
- sq. feet
|
- baths - beds |
show details | |

|
#38
1/2 N Main St, Lot 2
Farmer City, IL 61842
|
- sq. feet
|
- baths - beds |
show details | |

|
#39
W Park St
Urbana, IL 61801
|
- sq. feet
|
- baths - beds |
show details | |

|
#40
N Eastern Ave
Urbana, IL 61802
|
- sq. feet
|
- baths - beds |
show details |
| Photo | Address | Area | Beds / Baths | Price | Details |
|---|---|---|---|---|---|

|
#41
E White St
Champaign, IL 61820
|
- sq. feet
|
- baths - beds |
show details | |

|
#42
W Church St
Urbana, IL 61801
|
- sq. feet
|
- baths - beds |
show details | |

|
#43
W Bradley Ave Apt E104
Champaign, IL 61821
|
- sq. feet
|
- baths - beds |
show details | |

|
#44
Sedgegrass Dr
Champaign, IL 61822
|
- sq. feet
|
- baths - beds |
show details | |

|
#45
Crowwood Dr Apt 104
Champaign, IL 61822
|
- sq. feet
|
- baths - beds |
show details | |

|
#46
Waterview Way Apt B
Champaign, IL 61822
|
- sq. feet
|
- baths - beds |
show details | |

|
#47
Baytowne Dr Apt 11
Champaign, IL 61822
|
- sq. feet
|
- baths - beds |
show details | |

|
#48
E Champaign Ave
Rantoul, IL 61866
|
- sq. feet
|
- baths - beds |
show details | |

|
#49
Collier Ave
Rantoul, IL 61866
|
- sq. feet
|
- baths - beds |
show details | |

|
Check over 1 million property listings on Foreclosure.com!
|
browse all offers | |||

Latest news about housing in Fisher, IL collected exclusively by city-data.com from local newspapers, TV, and radio stations

 | Chicago 2021 and Beyond (130 replies) |
| Any advice on safe apartments in Chicago? (10 replies) |
| 60 shot, 6 killed in holiday weekend Chicago violence (333 replies) |
| Narrowing down suburbs (51 replies) |
| Question about Thermo Fisher Scientific in Rockford IL (3 replies) |
| Moving with several pets (14 replies) |
Median year apartment built: 1956
Household type by relationship:
Households: 1,722- Male householders: 396 (50 living alone), Female householders: 249 (50 living alone)
405 spouses (405 opposite-sex spouses), 82 unmarried partners, (82 opposite-sex unmarried partners), 531 children (467 natural, 20 adopted, 44 stepchildren), 8 grandchildren, 40 brothers or sisters, 0 parents, 0 foster children, 6 other relatives, 5 non-relatives
Size of family households: 239 2-persons, 116 3-persons, 116 4-persons, 25 5-persons, 8 6-persons.
Size of nonfamily households: 106 1-person, 39 2-persons.
370 married couples with children.
79 single-parent households (56 men, 23 women).
98.5% of residents of Fisher speak English at home.
0.4% of residents speak Spanish at home (100% speak English very well).
Foreign born population: 13 (0.8%)
(107.7% of them are naturalized citizens)
| Here: | 6.0 |
| State: | 6.4 |
| Here: | 4.2 |
| State: | 4.1 |
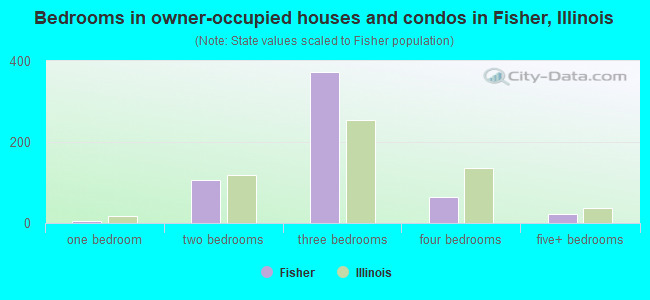
- Bedrooms in owner-occupied houses and condos in Fisher, Illinois
- 0no bedroom
- 41 bedroom
- 1062 bedrooms
- 3743 bedrooms
- 634 bedrooms
- 235+ bedrooms
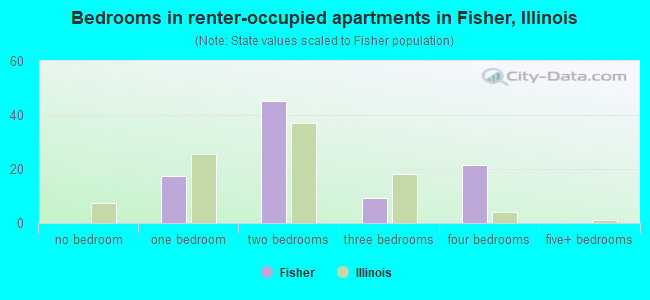
- Bedrooms in renter-occupied apartments in Fisher, Illinois
- 0no bedroom
- 171 bedroom
- 452 bedrooms
- 93 bedrooms
- 224 bedrooms
- 05+ bedrooms
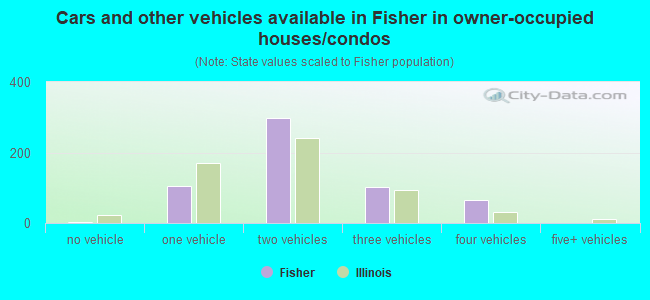
- Cars and other vehicles available in Fisher in owner-occupied houses/condos
- 2no vehicle
- 1061 vehicle
- 2972 vehicles
- 1013 vehicles
- 644 vehicles
- 05+ vehicles
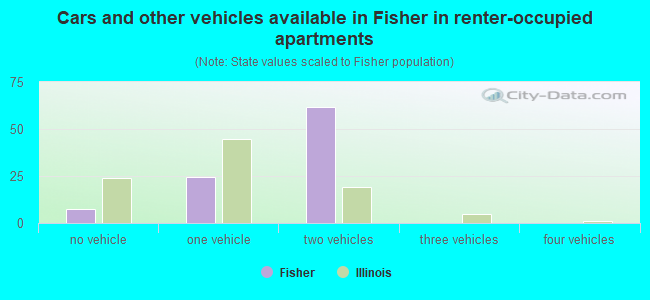
- Cars and other vehicles available in Fisher in renter-occupied apartments
- 7no vehicle
- 251 vehicle
- 622 vehicles
- 03 vehicles
- 04 vehicles
- 05+ vehicles
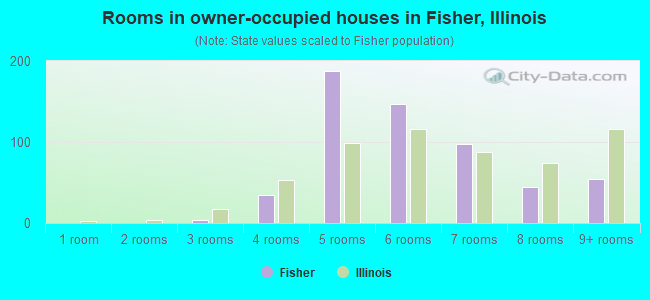
- Rooms in owner-occupied houses in Fisher, Illinois
- 01 room
- 02 rooms
- 43 rooms
- 344 rooms
- 1885 rooms
- 1476 rooms
- 977 rooms
- 458 rooms
- 549+ rooms
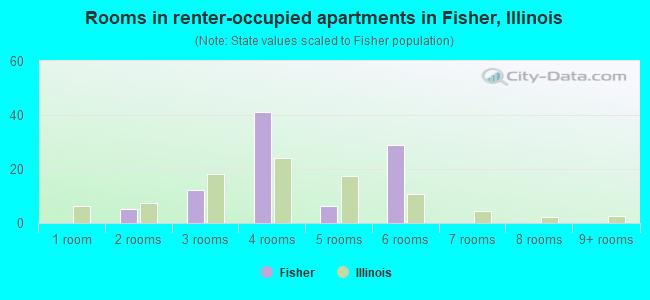
- Rooms in renter-occupied apartments in Fisher, Illinois
- 01 room
- 52 rooms
- 123 rooms
- 414 rooms
- 65 rooms
- 296 rooms
- 07 rooms
- 08 rooms
- 09+ rooms
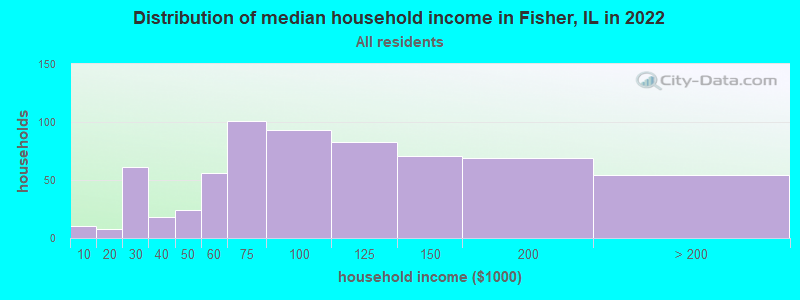
Fisher, IL household income distribution

- 10Less than $10,000
- 8$10,000 to $19,999
- 61$20,000 to $29,999
- 18$30,000 to $39,999
- 24$40,000 to $49,999
- 56$50,000 to $59,999
- 101$60,000 to $74,999
- 93$75,000 to $99,999
- 83$100,000 to $124,999
- 71$125,000 to $149,999
- 69$150,000 to $199,999
- 54$200,000 or more
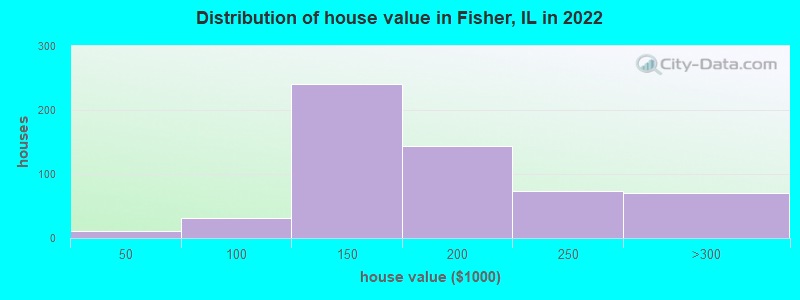
Home value of owner - occupied houses in 2022 in Fisher, IL
-
- 1Less than $10,000
- 2$15,000 to $19,999
- 3$20,000 to $24,999
- 3$25,000 to $29,999
- 5$70,000 to $79,999
- 18$80,000 to $89,999
- 8$90,000 to $99,999
- 191$100,000 to $124,999
- 48$125,000 to $149,999
- 77$150,000 to $174,999
- 65$175,000 to $199,999
- 73$200,000 to $249,999
- 65$250,000 to $299,999
- 4$300,000 to $399,999
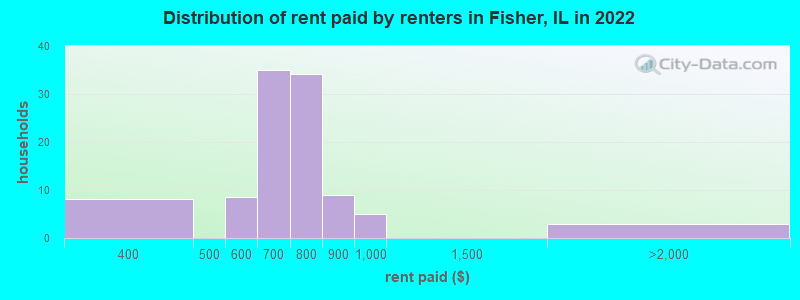
Rent paid by renters in 2022 in Fisher, IL
-
- 8$350 to $399
- 8$550 to $599
- 35$600 to $649
- 34$700 to $749
- 8$800 to $899
- 5$900 to $999
- 2$1,500 to $1,999
Percentage of workers working in this county: 81.1%
Number of people working at home: 90 (9.3% of all workers)
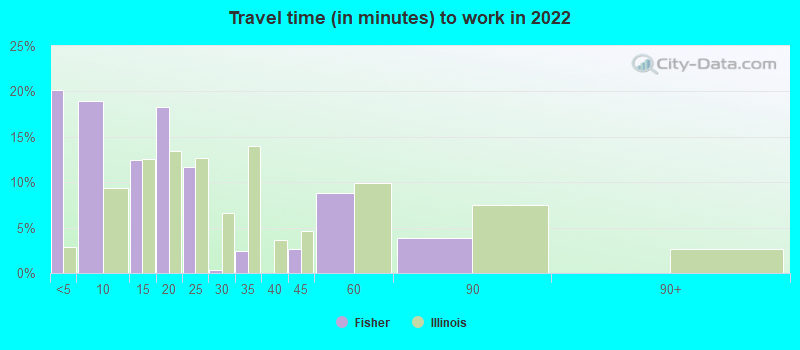
Travel time to work (commute)
- Less than 5 minutes: 54
- 5 to 9 minutes: 64
- 10 to 14 minutes: 44
- 15 to 19 minutes: 98
- 20 to 24 minutes: 140
- 25 to 29 minutes: 62
- 30 to 34 minutes: 167
- 35 to 39 minutes: 22
- 40 to 44 minutes: 52
- 45 to 59 minutes: 37
- 60 to 89 minutes: 15
- 90 or more minutes: 9
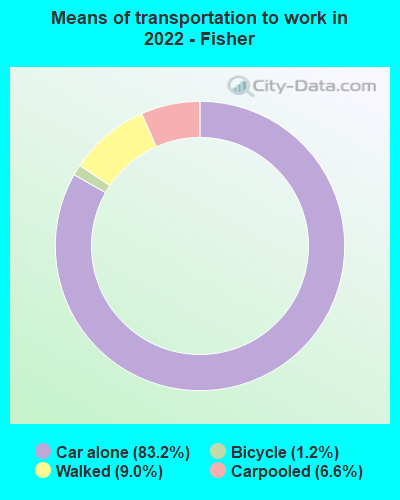
Means of transportation to work:
- Drove a car alone: 208 (70.3%)
- Carpooled: 15 (5.1%)
- Bicycle: 1 (0.3%)
- Walked: 16 (5.4%)
- Worked at home: 122 (41.2%)
- Unemployment by race in 2022
- Unemployment rate for White non-Hispanic residents
- 1.8%Males
- 1.5%Females
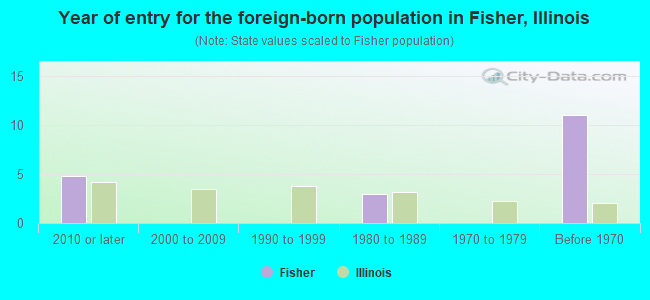
- Year of entry for the foreign-born population in Fisher, Illinois
- 52010 or later
- 02000 to 2009
- 01990 to 1999
- 31980 to 1989
- 01970 to 1979
- 11Before 1970
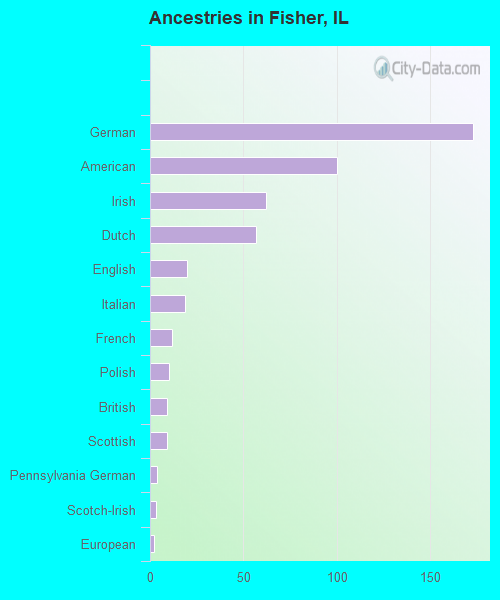
First ancestries reported:
- German: 173 (29.2%)
- American: 100 (16.9%)
- Irish: 62 (10.5%)
- Dutch: 57 (9.6%)
- English: 20 (3.4%)
- Italian: 19 (3.2%)
- French: 12 (2.0%)
- Polish: 10 (1.7%)
- British: 9 (1.5%)
- Scottish: 9 (1.5%)
- Pennsylvania German: 4 (0.7%)
- Scotch-Irish: 3 (0.5%)
- European: 2 (0.3%)
Most common places of birth for foreign-born residents (%):
| Fisher: | 46.2% (6) |
| Illinois: | 0.1% (2,017) |
| Fisher: | 23.1% (3) |
| Illinois: | 2.2% (40,393) |
Place of birth for U.S.-born residents:
- This state: 1,385
- Other state: 274
- Northeast: 30
- Midwest: 93
- South: 104
- West: 48
90.8% of Fisher residents lived in the same house 1 years ago.
Out of people who lived in different houses, 23.2% lived in this county.
Out of people who lived in different counties, 52.1% lived in Illinois.
| Fisher: | 90.8% |
| State average: | 88.3% |
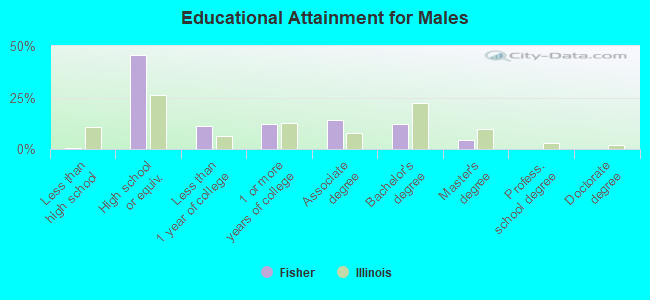
Education attainment for males 25 years and older:
- No schooling: 0
- Nursery to 4th grade: 0
- 5th and 6th grade: 0
- 7th and 8th grade: 0
- 9th grade: 0
- 10th grade: 0
- 11th grade: 2
- 12th grade, no diploma: 2
- High school graduate (or equivalency): 294
- Less than 1 year of college: 72
- Some college more than 1 year, no degree: 79
- Associate degree: 90
- Bachelor's degree: 77
- Master's degree: 27
- Professional school degree: 0
- Doctorate degree: 0
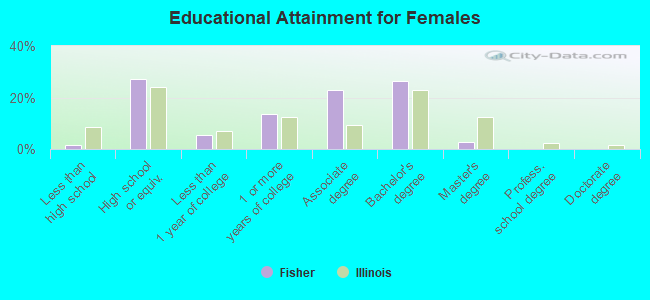
Education attainment for females 25 years and older:
- No schooling: 0
- Nursery to 4th grade: 0
- 5th and 6th grade: 0
- 7th and 8th grade: 0
- 9th grade: 0
- 10th grade: 0
- 11th grade: 3
- 12th grade, no diploma: 5
- High school graduate (or equivalency): 142
- Less than 1 year of college: 28
- Some college more than 1 year, no degree: 71
- Associate degree: 120
- Bachelor's degree: 139
- Master's degree: 15
- Professional school degree: 0
- Doctorate degree: 0
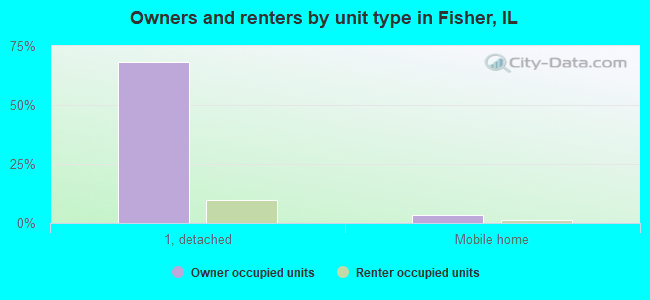
Housing units in structures:
- One, detached: 576
- One, attached: 48
- 3 or 4: 26
- 5 to 9: 32
- 10 to 19: 19
- 20 to 49: 3
- Mobile homes: 7
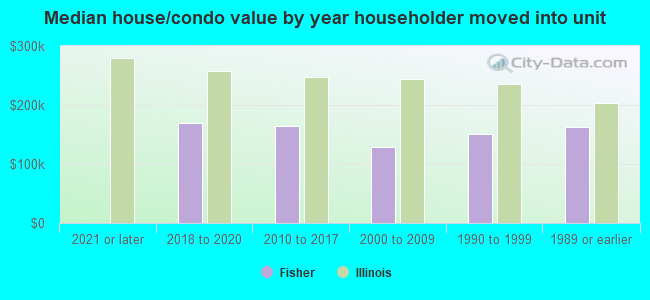
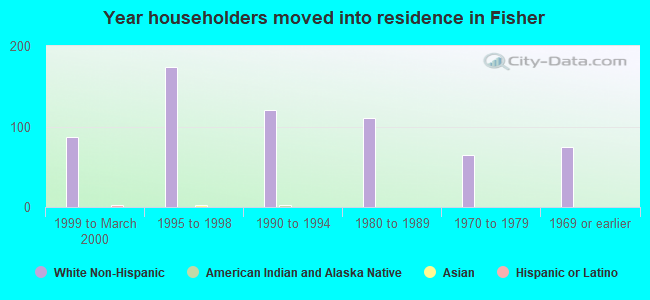
House/condo owner moved in on average 11 years ago
Renter moved in on average 0 years ago
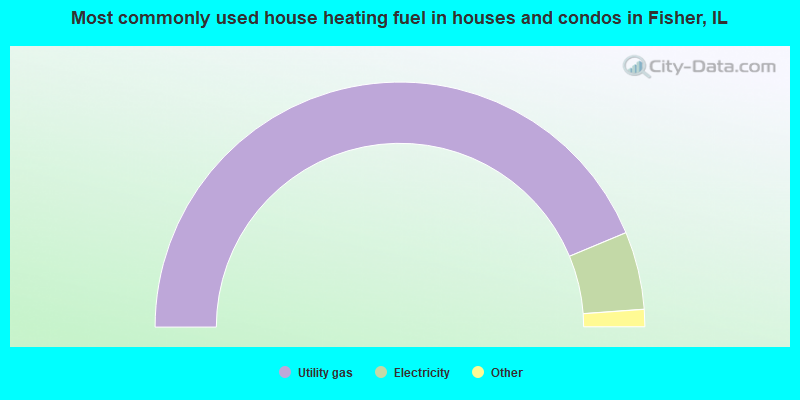
- 87.5%Utility gas
- 10.3%Electricity
- 1.4%Bottled, tank, or LP gas
- 0.7%Other fuel
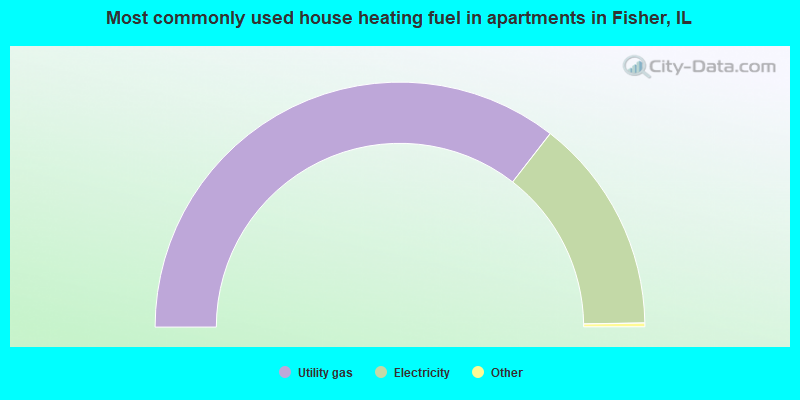
- 71.4%Utility gas
- 28.6%Electricity
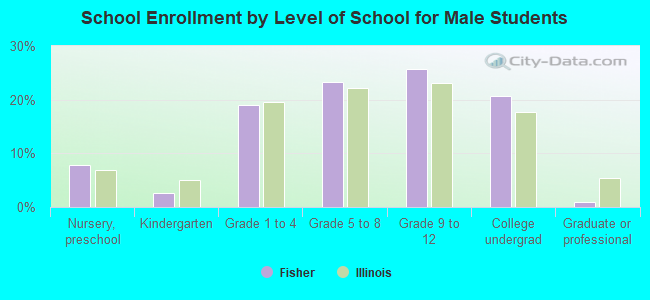
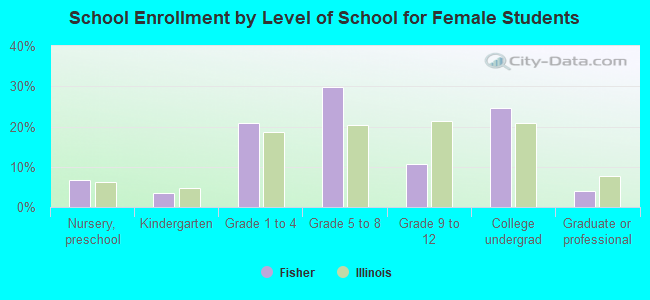
Private vs. public school enrollment:
| Here: | 1.7% |
| Illinois: | 13.3% |
| Here: | 0.0% |
| Illinois: | 9.9% |
| Here: | 16.9% |
| Illinois: | 27.4% |