Flint, MI (Michigan) Houses and Residents
| Flint: | $48,700 |
| Michigan: | $224,400 |
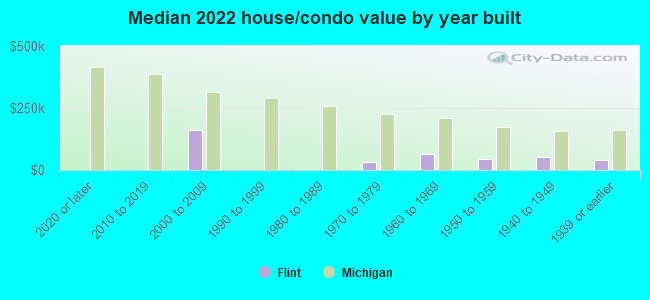
Mean price in 2022:
Detached houses: $67,550
Here: $67,550 State: $280,038 Townhouses or other attached units: $98,833
Here: $98,833 State: $239,520 In 2-unit structures: $93,784
Here: $93,784 State: $219,481 In 3-to-4-unit structures: $67,688
Here: $67,688 State: $207,067 In 5-or-more-unit structures: $95,793
Here: $95,793 State: $192,733 Mobile homes: $101,440
Here: $101,440 State: $72,868
Total population: 99,002 (All urban)
Houses: 43,436 (34,988 occupied: 18,883 owner occupied, 16,105 renter occupied)
| % of renters here: | 46% |
| State: | 27% |
Housing density: 1,291 houses/condos per square mile
Median price asked for vacant for-sale houses and condos in 2022: $11,617.
Median contract rent in 2022: $573 (lower quartile is $408, upper quartile is $686)
Median rent asked for vacant for-rent units in 2022: $905
Median gross rent in Flint, MI in 2022: $796
Housing units in Flint with a mortgage: 7,101 (255 second mortgage, 13 home equity loan, 180 both second mortgage and home equity loan)
Houses without a mortgage: 85
Median household income for houses/condos with a mortgage: $52,654
Median household income for apartments without a mortgage: $34,376
Median monthly housing costs: $637
Compare current foreclosures in Flint, MI:
| Photo | Address | Area | Beds / Baths | Price | Details |
|---|---|---|---|---|---|

|
#1
Plainfield Ave
Flint, MI 48506
|
941 sq. feet
|
1 baths 3 beds |
$95,500
|
show details |

|
#2
Covered Wagons Trl
Flint, MI 48532
|
4,108 sq. feet
|
4 baths 4 beds |
$499,500
|
show details |

|
#3
S Grand Traverse St
Flint, MI 48507
|
864 sq. feet
|
1 baths 2 beds |
$90,000
|
show details |

|
#4
W Dewey St
Flint, MI 48505
|
1,440 sq. feet
|
1 baths 3 beds |
$120,500
|
show details |

|
#5
Pingree Ave
Flint, MI 48503
|
1,055 sq. feet
|
1 baths 3 beds |
show details | |

|
#6
Clinton St
Flint, MI 48507
|
1,475 sq. feet
|
1 baths 3 beds |
show details | |

|
#7
Valley Oaks Cir # 20
Flint, MI 48532
|
1,280 sq. feet
|
3 baths 2 beds |
show details | |

|
#8
Macdonald Ave
Flint, MI 48507
|
941 sq. feet
|
1 baths 3 beds |
show details | |

|
#9
Eckinger St
Flint, MI 48506
|
1,120 sq. feet
|
1 baths 3 beds |
show details | |

|
#10
Windemere Ave
Flint, MI 48503
|
1,112 sq. feet
|
1 baths 3 beds |
show details |
| Photo | Address | Area | Beds / Baths | Price | Details |
|---|---|---|---|---|---|

|
#11
Litchfield Dr
Flint, MI 48532
|
1,264 sq. feet
|
1 baths 3 beds |
show details | |

|
#12
Berkley St
Flint, MI 48504
|
768 sq. feet
|
1 baths 2 beds |
show details | |

|
#13
Brownell Blvd
Flint, MI 48504
|
1,263 sq. feet
|
1 baths 3 beds |
show details | |

|
#14
Fenton Rd
Flint, MI 48507
|
- sq. feet
|
2 baths 3 beds |
show details | |

|
#15
Barbara Dr
Flint, MI 48505
|
1,001 sq. feet
|
2 baths 3 beds |
show details | |

|
#16
N Jennings Rd
Flint, MI 48504
|
2,018 sq. feet
|
1 baths 4 beds |
show details | |

|
#17
Herrick St
Flint, MI 48503
|
736 sq. feet
|
1 baths 2 beds |
show details | |

|
#18
Gilbert St
Flint, MI 48532
|
1,056 sq. feet
|
1 baths 2 beds |
show details | |

|
#19
S Franklin Ave
Flint, MI 48503
|
1,774 sq. feet
|
2 baths 4 beds |
show details | |

|
#20
N Chevrolet Ave
Flint, MI 48504
|
1 sq. feet
|
1 baths 3 beds |
show details |
| Photo | Address | Area | Beds / Baths | Price | Details |
|---|---|---|---|---|---|

|
#21
Country Ln
Flint, MI 48506
|
1,353 sq. feet
|
1 baths 3 beds |
show details | |

|
#22
Zimmerman St
Flint, MI 48503
|
1,176 sq. feet
|
1 baths 4 beds |
show details | |

|
#23
W Pasadena Ave
Flint, MI 48504
|
1,020 sq. feet
|
1 baths 3 beds |
show details | |

|
#24
N Averill Ave
Flint, MI 48506
|
- sq. feet
|
1 baths 3 beds |
show details | |

|
#25
Gloucester St
Flint, MI 48503
|
1,008 sq. feet
|
2 baths 3 beds |
show details | |

|
#26
Parkway Ct
Flint, MI 48503
|
1,570 sq. feet
|
1 baths 4 beds |
show details | |

|
#27
Stockton St
Flint, MI 48503
|
1,880 sq. feet
|
3 baths 3 beds |
show details | |

|
#28
Spellman Dr
Flint, MI 48503
|
2,035 sq. feet
|
3 baths 4 beds |
show details | |

|
#29
Moulton Dr
Flint, MI 48507
|
1,276 sq. feet
|
1 baths 3 beds |
show details | |

|
#30
N Belsay Rd
Flint, MI 48506
|
1,404 sq. feet
|
1 baths 4 beds |
show details |
| Photo | Address | Area | Beds / Baths | Price | Details |
|---|---|---|---|---|---|

|
#31
Huggins Ave
Flint, MI 48506
|
1,020 sq. feet
|
1 baths 3 beds |
show details | |

|
#32
Dye Krest Dr
Flint, MI 48532
|
1,826 sq. feet
|
2 baths 3 beds |
show details | |

|
#33
Stevenson St
Flint, MI 48504
|
942 sq. feet
|
1 baths 3 beds |
show details | |

|
#34
E Pierson Rd
Flint, MI 48506
|
- sq. feet
|
2 baths 4 beds |
show details | |

|
#35
Wolcott St
Flint, MI 48504
|
700 sq. feet
|
1 baths 2 beds |
show details | |

|
#36
Huggins Ave
Flint, MI 48506
|
1,296 sq. feet
|
1 baths 3 beds |
show details | |

|
#37
Richfield Rd
Flint, MI 48506
|
944 sq. feet
|
1 baths 2 beds |
show details | |

|
#38
Begole St
Flint, MI 48504
|
894 sq. feet
|
1 baths 2 beds |
show details | |

|
#39
Brown St
Flint, MI 48532
|
1,194 sq. feet
|
1 baths 3 beds |
show details | |

|
#40
Williamsburg Rd
Flint, MI 48507
|
- sq. feet
|
1 baths 3 beds |
show details |
| Photo | Address | Area | Beds / Baths | Price | Details |
|---|---|---|---|---|---|

|
#41
Red Arrow Rd
Flint, MI 48507
|
1,152 sq. feet
|
1 baths 4 beds |
show details | |

|
#42
Westwood Pkwy
Flint, MI 48503
|
3,002 sq. feet
|
3 baths 3 beds |
show details | |

|
#43
Columbia Dr
Flint, MI 48503
|
2,386 sq. feet
|
2 baths 3 beds |
show details | |

|
#44
Raskob St
Flint, MI 48504
|
1,356 sq. feet
|
1 baths 3 beds |
show details | |

|
#45
Kent St
Flint, MI 48503
|
1,074 sq. feet
|
1 baths 3 beds |
show details | |

|
#46
Leland St
Flint, MI 48507
|
915 sq. feet
|
1 baths 3 beds |
show details | |

|
#47
S Franklin Ave
Flint, MI 48503
|
1,528 sq. feet
|
2 baths 4 beds |
show details | |

|
#48
Barth St
Flint, MI 48504
|
1,110 sq. feet
|
1 baths 2 beds |
show details | |

|
#49
Pencombe Pl
Flint, MI 48503
|
1,749 sq. feet
|
1 baths 3 beds |
show details | |

|
Check over 1 million property listings on Foreclosure.com!
|
browse all offers | |||

Latest news about housing in Flint, MI collected exclusively by city-data.com from local newspapers, TV, and radio stations

 | If homes are so cheap, why are people still renting in Detroit? (45 replies) |
| Why is it that Flint house are dirt cheap?? (61 replies) |
| Flint, MI (11 replies) |
| how does one get ahold of those cheap houses i heard about? (146 replies) |
| Relocating near Flint, MI, where is the best place to rent an apartment? (0 replies) |
| Flint MI -- Two young adults looking for a home (7 replies) |
Median year apartment built: 1954
Household type by relationship:
Households: 79,865- Male householders: 14,899 (8,226 living alone), Female householders: 20,089 (6,706 living alone)
5,921 spouses (5,921 opposite-sex spouses), 4,198 unmarried partners, (4,058 opposite-sex unmarried partners), 23,494 children (22,050 natural, 730 adopted, 714 stepchildren), 2,533 grandchildren, 2,707 brothers or sisters, 562 parents, 384 foster children, 964 other relatives, 1,933 non-relatives
- In group quarters: 2,181
Size of family households: 8,909 2-persons, 3,624 3-persons, 2,916 4-persons, 756 5-persons, 505 6-persons, 432 7-or-more-persons.
Size of nonfamily households: 14,932 1-person, 2,445 2-persons, 469 3-persons.
2,767 married couples with children.
11,463 single-parent households (1,470 men, 9,993 women).
95.8% of residents of Flint speak English at home.
1.6% of residents speak Spanish at home (55% speak English very well, 19% speak English well, 17% speak English not well, 9% don't speak English at all).
0.5% of residents speak other Indo-European language at home (84% speak English very well, 6% speak English well, 10% speak English not well).
0.5% of residents speak Asian or Pacific Island language at home (83% speak English very well, 1% speak English well, 16% speak English not well).
1.1% of residents speak other language at home (53% speak English very well, 29% speak English well, 12% speak English not well, 6% don't speak English at all).
Foreign born population: 2,338 (2.9%)
(56.9% of them are naturalized citizens)
| Here: | 5.5 |
| State: | 6.5 |
| Here: | 4.5 |
| State: | 4.3 |
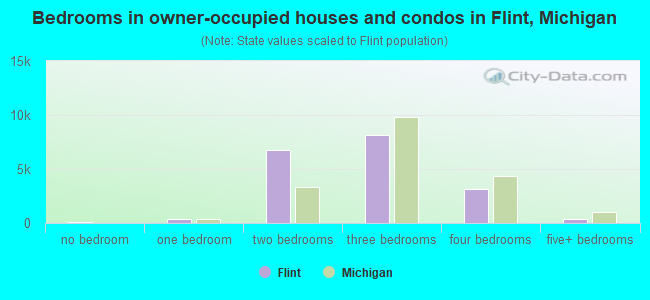
- Bedrooms in owner-occupied houses and condos in Flint, Michigan
- 97no bedroom
- 3431 bedroom
- 6,7572 bedrooms
- 8,1943 bedrooms
- 3,1614 bedrooms
- 3315+ bedrooms
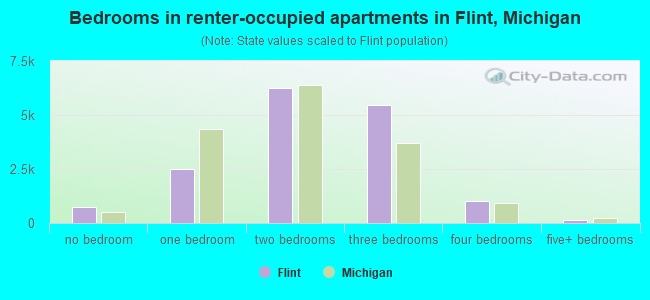
- Bedrooms in renter-occupied apartments in Flint, Michigan
- 755no bedroom
- 2,5111 bedroom
- 6,2372 bedrooms
- 5,4573 bedrooms
- 1,0204 bedrooms
- 1255+ bedrooms
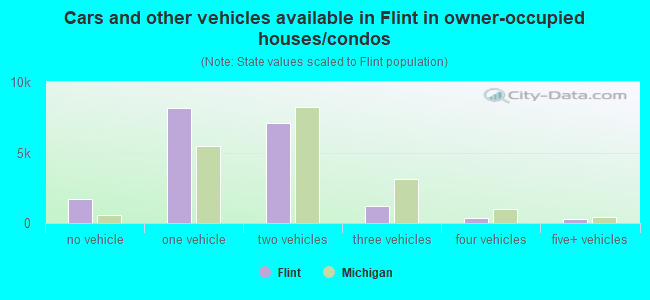
- Cars and other vehicles available in Flint in owner-occupied houses/condos
- 1,735no vehicle
- 8,1591 vehicle
- 7,1262 vehicles
- 1,2043 vehicles
- 3774 vehicles
- 2825+ vehicles
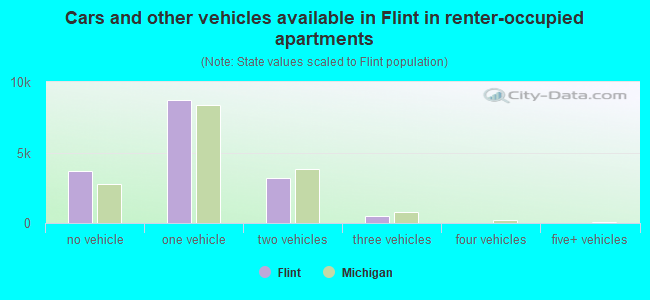
- Cars and other vehicles available in Flint in renter-occupied apartments
- 3,690no vehicle
- 8,7141 vehicle
- 3,1912 vehicles
- 5103 vehicles
- 04 vehicles
- 05+ vehicles
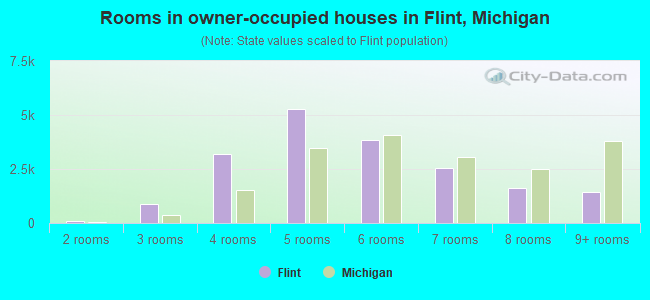
- Rooms in owner-occupied houses in Flint, Michigan
- 01 room
- 972 rooms
- 8843 rooms
- 3,1824 rooms
- 5,2575 rooms
- 3,8426 rooms
- 2,5527 rooms
- 1,6368 rooms
- 1,4339+ rooms
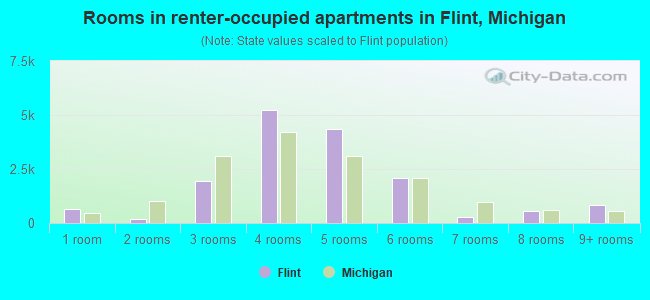
- Rooms in renter-occupied apartments in Flint, Michigan
- 6601 room
- 1822 rooms
- 1,9593 rooms
- 5,2464 rooms
- 4,3355 rooms
- 2,0866 rooms
- 2687 rooms
- 5518 rooms
- 8189+ rooms
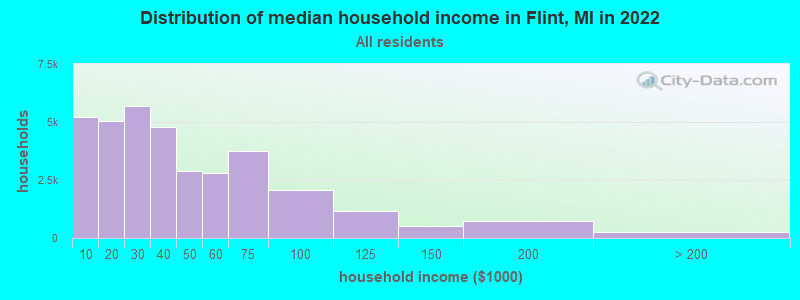
Flint, MI household income distribution

- 5,218Less than $10,000
- 5,026$10,000 to $19,999
- 5,681$20,000 to $29,999
- 4,798$30,000 to $39,999
- 2,901$40,000 to $49,999
- 2,793$50,000 to $59,999
- 3,756$60,000 to $74,999
- 2,081$75,000 to $99,999
- 1,185$100,000 to $124,999
- 533$125,000 to $149,999
- 753$150,000 to $199,999
- 263$200,000 or more
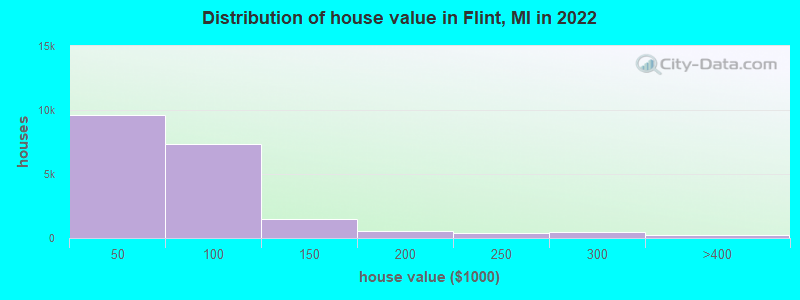
Home value of owner - occupied houses in 2022 in Flint, MI
-
- 1,193Less than $10,000
- 1,016$10,000 to $14,999
- 1,277$15,000 to $19,999
- 763$20,000 to $24,999
- 1,716$25,000 to $29,999
- 1,616$30,000 to $34,999
- 700$35,000 to $39,999
- 1,335$40,000 to $49,999
- 1,544$50,000 to $59,999
- 1,243$60,000 to $69,999
- 1,933$70,000 to $79,999
- 728$80,000 to $89,999
- 592$90,000 to $99,999
- 1,130$100,000 to $124,999
- 339$125,000 to $149,999
- 524$150,000 to $174,999
- 56$175,000 to $199,999
- 404$200,000 to $249,999
- 502$250,000 to $299,999
- 221$300,000 to $399,999
- 51$500,000 to $749,999
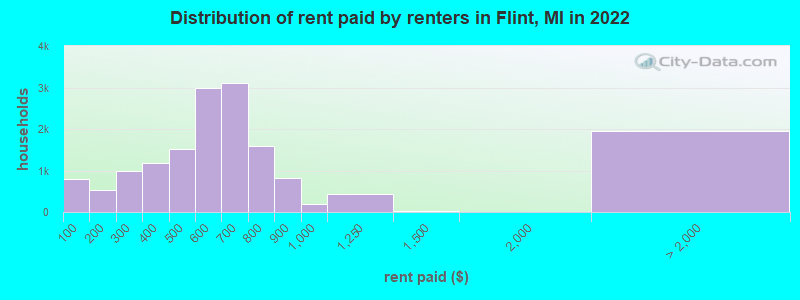
Rent paid by renters in 2022 in Flint, MI
-
- 797Less than $100
- 21$100 to $149
- 509$150 to $199
- 674$200 to $249
- 317$250 to $299
- 355$300 to $349
- 817$350 to $399
- 321$400 to $449
- 1,205$450 to $499
- 1,287$500 to $549
- 1,694$550 to $599
- 1,354$600 to $649
- 1,750$650 to $699
- 1,053$700 to $749
- 532$750 to $799
- 825$800 to $899
- 190$900 to $999
- 425$1,000 to $1,249
- 29$1,250 to $1,499
- 1,950No cash rent
Percentage of workers working in this county: 84.2%
Number of people working at home: 2,826 (9.6% of all workers)
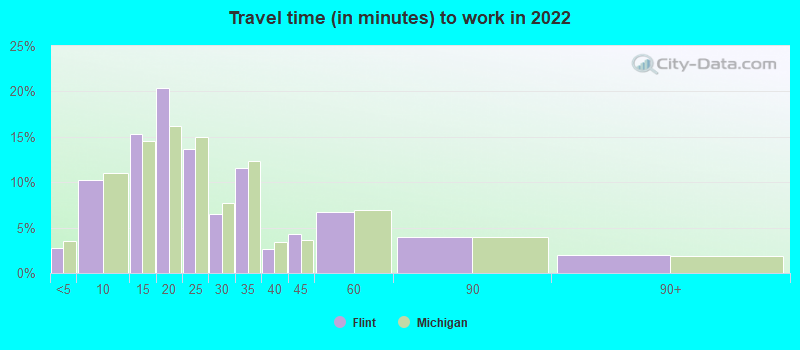
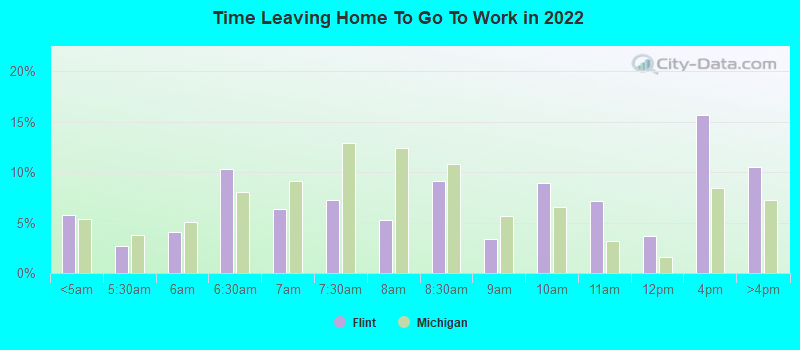
Travel time to work (commute)
- Less than 5 minutes: 994
- 5 to 9 minutes: 3,453
- 10 to 14 minutes: 5,222
- 15 to 19 minutes: 6,195
- 20 to 24 minutes: 3,543
- 25 to 29 minutes: 828
- 30 to 34 minutes: 2,194
- 35 to 39 minutes: 132
- 40 to 44 minutes: 737
- 45 to 59 minutes: 912
- 60 to 89 minutes: 2,234
- 90 or more minutes: 331
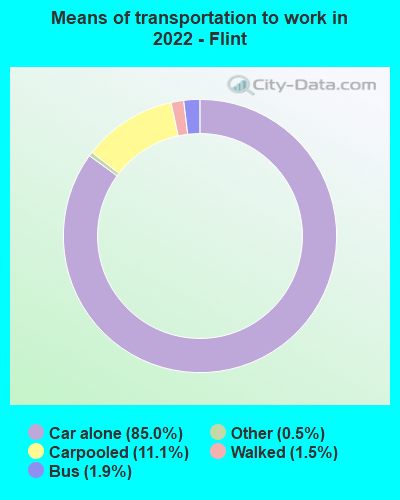
Means of transportation to work:
- Drove a car alone: 36,079 (78.1%)
- Carpooled: 4,634 (10.0%)
- Bus: 531 (1.1%)
- Taxi: 172 (0.4%)
- Bicycle: 23 (0.0%)
- Walked: 634 (1.4%)
- Worked at home: 2,826 (6.1%)
- Unemployment by race in 2022
- Unemployment rate for White non-Hispanic residents
- 10.5%Males
- 11.1%Females
- Unemployment rate for Black residents
- 29.8%Males
- 16.3%Females
- Unemployment rate for Asian residents
- 7.9%Males
- 5.0%Females
- Unemployment rate for other race residents
- 26.9%Males
- 24.7%Females
- Unemployment rate for two or more race residents
- 16.2%Males
- 10.8%Females
- Unemployment rate for Hispanic or Latino residents
- 6.1%Males
- 13.4%Females
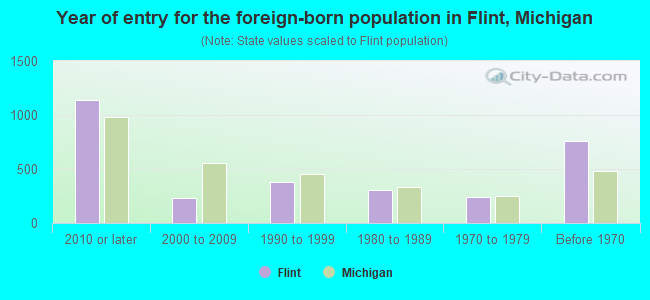
- Year of entry for the foreign-born population in Flint, Michigan
- 1,1372010 or later
- 2292000 to 2009
- 3821990 to 1999
- 3081980 to 1989
- 2441970 to 1979
- 760Before 1970
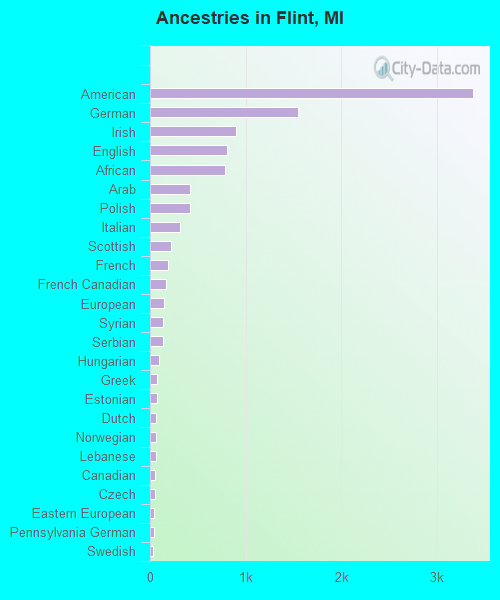
First ancestries reported:
- American: 3,378 (6.8%)
- German: 1,550 (3.1%)
- Irish: 905 (1.8%)
- English: 810 (1.6%)
- African: 782 (1.6%)
- Arab: 419 (0.8%)
- Polish: 417 (0.8%)
- Italian: 319 (0.6%)
- Scottish: 223 (0.4%)
- French: 192 (0.4%)
- French Canadian: 167 (0.3%)
- European: 148 (0.3%)
- Syrian: 139 (0.3%)
- Serbian: 132 (0.3%)
- Hungarian: 94 (0.2%)
- Greek: 77 (0.2%)
- Estonian: 76 (0.2%)
- Dutch: 67 (0.1%)
- Norwegian: 65 (0.1%)
- Lebanese: 63 (0.1%)
- Canadian: 55 (0.1%)
- Czech: 50 (0.1%)
- Eastern European: 46 (0.09%)
- Pennsylvania German: 38 (0.08%)
- Swedish: 36 (0.07%)
- Icelander: 33 (0.07%)
- Palestinian: 32 (0.06%)
- Jamaican: 28 (0.06%)
- Sudanese: 27 (0.05%)
- Scotch-Irish: 27 (0.05%)
- Finnish: 26 (0.05%)
- Ukrainian: 24 (0.05%)
- Czechoslovakian: 22 (0.04%)
- Scandinavian: 22 (0.04%)
- Romanian: 20 (0.04%)
- Iraqi: 18 (0.04%)
- Slovak: 14 (0.03%)
- Welsh: 13 (0.03%)
- Zimbabwean: 11 (0.02%)
- Russian: 8 (0.02%)
- Belgian: 7 (0.01%)
- Egyptian: 6 (0.01%)
- Northern European: 6 (0.01%)
- British: 5 (0.01%)
Most common places of birth for foreign-born residents (%):
| Flint: | 23.1% (476) |
| Michigan: | 3.1% (21,538) |
| Flint: | 14.5% (299) |
| Michigan: | 10.9% (75,965) |
| Flint: | 11.9% (246) |
| Michigan: | 0.9% (6,481) |
| Flint: | 5.5% (114) |
| Michigan: | 0.9% (5,978) |
| Flint: | 5.3% (110) |
| Michigan: | 0.7% (4,645) |
| Flint: | 4.4% (91) |
| Michigan: | 11.1% (77,240) |
| Flint: | 3.9% (81) |
| Michigan: | 5.0% (35,052) |
| Flint: | 3.8% (78) |
| Michigan: | 0.1% (963) |
| Flint: | 3.2% (67) |
| Michigan: | 4.9% (34,295) |
| Flint: | 3.2% (67) |
| Michigan: | 0.9% (5,964) |
| Flint: | 3.2% (66) |
| Michigan: | 0.6% (3,969) |
| Flint: | 2.9% (59) |
| Michigan: | 0.4% (3,074) |
| Flint: | 1.8% (38) |
| Michigan: | 1.0% (6,730) |
Place of birth for U.S.-born residents:
- This state: 61,413
- Other state: 15,678
- Northeast: 817
- Midwest: 4,672
- South: 8,233
- West: 1,956
86.8% of Flint residents lived in the same house 1 years ago.
Out of people who lived in different houses, 35.7% lived in this county.
Out of people who lived in different counties, 59.1% lived in Michigan.
| Flint: | 86.8% |
| State average: | 88.4% |
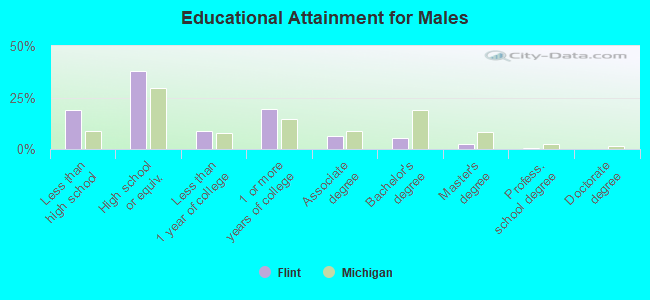
Education attainment for males 25 years and older:
- No schooling: 525
- Nursery to 4th grade: 43
- 5th and 6th grade: 236
- 7th and 8th grade: 136
- 9th grade: 651
- 10th grade: 1,029
- 11th grade: 1,434
- 12th grade, no diploma: 1,056
- High school graduate (or equivalency): 10,149
- Less than 1 year of college: 2,332
- Some college more than 1 year, no degree: 5,285
- Associate degree: 1,699
- Bachelor's degree: 1,492
- Master's degree: 636
- Professional school degree: 117
- Doctorate degree: 56
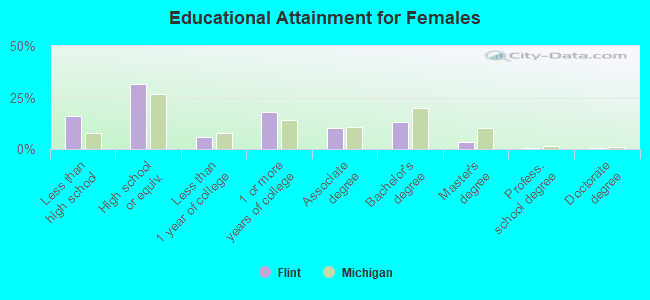
Education attainment for females 25 years and older:
- No schooling: 325
- Nursery to 4th grade: 137
- 5th and 6th grade: 108
- 7th and 8th grade: 506
- 9th grade: 741
- 10th grade: 678
- 11th grade: 1,259
- 12th grade, no diploma: 716
- High school graduate (or equivalency): 8,742
- Less than 1 year of college: 1,624
- Some college more than 1 year, no degree: 5,003
- Associate degree: 2,843
- Bachelor's degree: 3,631
- Master's degree: 991
- Professional school degree: 137
- Doctorate degree: 164
Housing units in structures:
- One, detached: 35,441
- One, attached: 1,442
- Two: 1,039
- 3 or 4: 1,494
- 5 to 9: 1,092
- 10 to 19: 480
- 20 to 49: 754
- 50 or more: 1,322
- Mobile homes: 339
- Boats, RVs, vans, etc.: 33
Median worth of mobile homes: $19,480
Housing units lacking complete kitchen facilities in 2022: 10.7%
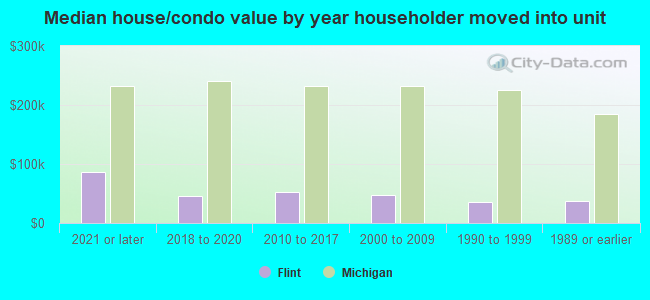
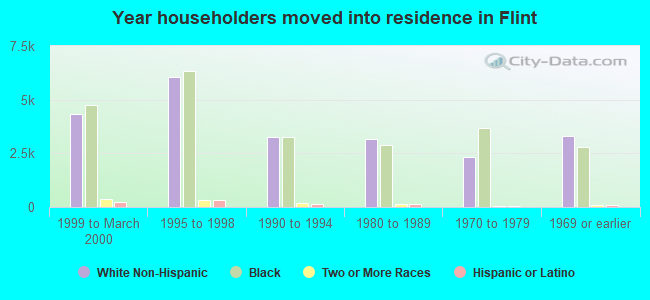
House/condo owner moved in on average 15 years ago
Renter moved in on average 3 years ago
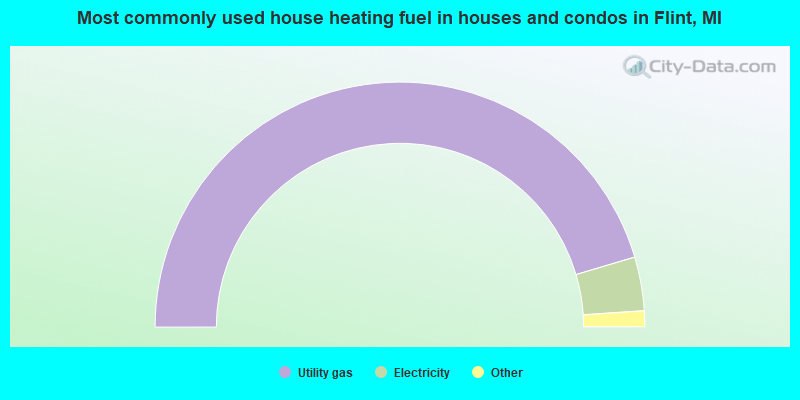
- 90.9%Utility gas
- 7.1%Electricity
- 1.3%Bottled, tank, or LP gas
- 0.5%No fuel used
- 0.1%Other fuel
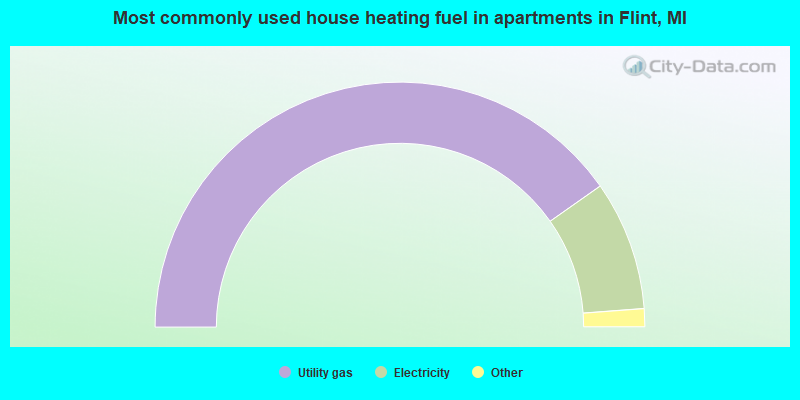
- 80.5%Utility gas
- 17.1%Electricity
- 0.9%No fuel used
- 0.9%Bottled, tank, or LP gas
- 0.5%Other fuel
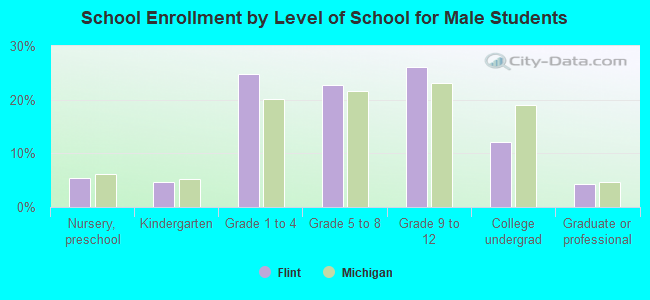
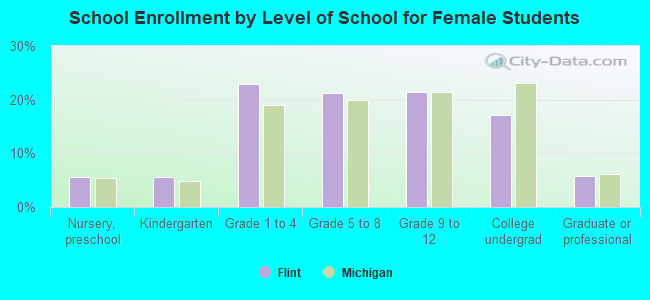
Private vs. public school enrollment:
| Here: | 3.6% |
| Michigan: | 12.4% |
| Here: | 5.6% |
| Michigan: | 9.8% |
| Here: | 18.5% |
| Michigan: | 14.9% |