Fluvanna-Sharon Ridge, TX (Texas) Houses and Residents
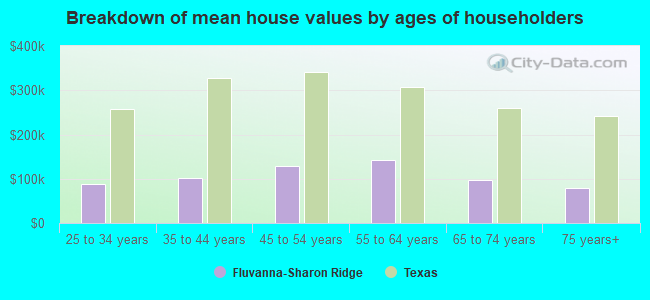
| Fluvanna-Sharon Ridge: | $175,821 |
| Texas: | $275,400 |
Total population: 1,263 (Urban population: 0, Rural population: 1,312 (120 farm, 1,192 nonfarm))
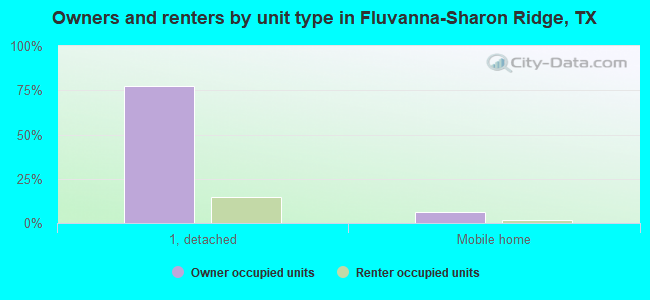
Houses: 667 (511 occupied: 427 owner occupied, 84 renter occupied)
| % of renters here: | 16% |
| State: | 38% |
Housing density: 2 houses/condos per square mile
Median price asked for vacant for-sale houses and condos in 2022 in this county: $122,981.
Median contract rent in 2022: $868 (lower quartile is $799, upper quartile is $1,307)
Median rent asked for vacant for-rent units in 2022: $762
Median gross rent in Fluvanna-Sharon Ridge, TX in 2022: $1,229
Housing units in Fluvanna-Sharon Ridge with a mortgage: 143 (2 second mortgage, 0 home equity loan, 0 both second mortgage and home equity loan)
Houses without a mortgage: 170
Compare current foreclosures near Fluvanna-Sharon Ridge, TX:
| Photo | Address | Area | Beds / Baths | Price | Details |
|---|---|---|---|---|---|

|
#1
W Fm 1606
Ira, TX 79527
|
1,482 sq. feet
|
2 baths 3 beds |
show details | |

|
#2
Tobosa Dr
Snyder, TX 79549
|
1,821 sq. feet
|
2 baths 4 beds |
show details | |

|
#3
31st St
Snyder, TX 79549
|
1,349 sq. feet
|
2 baths 2 beds |
show details | |

|
#4
Block Line Rd
Snyder, TX 79549
|
1,461 sq. feet
|
2 baths - beds |
show details | |

|
#5
County Road 3114
Snyder, TX 79549
|
- sq. feet
|
- baths - beds |
show details | |

|
#6
23rd St
Snyder, TX 79549
|
1,978 sq. feet
|
- baths - beds |
show details | |

|
#7
Avenue U
Snyder, TX 79549
|
- sq. feet
|
- baths - beds |
show details | |

|
#8
County Road 263
Snyder, TX 79549
|
- sq. feet
|
- baths - beds |
show details | |

|
#9
N Business H 84
Snyder, TX 79549
|
- sq. feet
|
- baths - beds |
show details | |

|
#10
S State Highway 208
Snyder, TX 79549
|
- sq. feet
|
- baths - beds |
show details |
| Photo | Address | Area | Beds / Baths | Price | Details |
|---|---|---|---|---|---|

|
Check over 1 million property listings on Foreclosure.com!
|
browse all offers | |||
| Photo | Address | Area | Beds / Baths | Price | Details |
|---|

Household type by relationship:
Households: 15,197- In family households: 13,224 (2,990 male householders, 1,147 female householders)
3,155 spouses, 4,611 children (4,124 natural, 119 adopted, 368 stepchildren), 507 grandchildren, 96 brothers or sisters, 98 parents, foster children, 229 other relatives, 302 non-relatives
- In nonfamily households: 1,973 (828 male householders (680 living alone)), 873 female householders (808 living alone)), 272 nonrelatives
- In group quarters: 1,724 (1,397 institutionalized population)
2,753 married couples with children.
878 single-parent households (227 men, 651 women).
90.3% of residents of Fluvanna-Sharon Ridge speak English at home.
9.5% of residents speak Spanish at home (64% speak English very well, 25% speak English well, 8% speak English not well, 3% don't speak English at all).
0.2% of residents speak Asian or Pacific Island language at home (100% speak English very well).
Foreign born population: 86 (4.8%)
(67.4% of them are naturalized citizens)
| Here: | 6.0 |
| State: | 6.3 |
| Here: | 6.0 |
| State: | 4.0 |
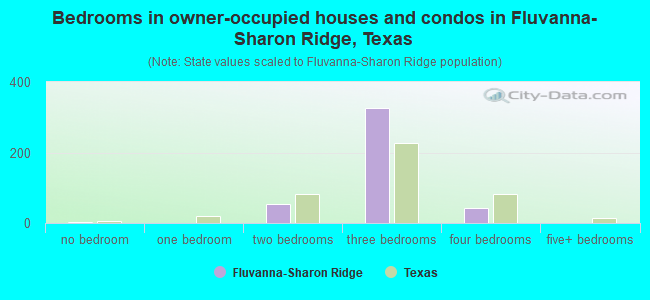
- Bedrooms in owner-occupied houses and condos in Fluvanna-Sharon Ridge, Texas
- 3no bedroom
- 01 bedroom
- 552 bedrooms
- 3263 bedrooms
- 434 bedrooms
- 05+ bedrooms
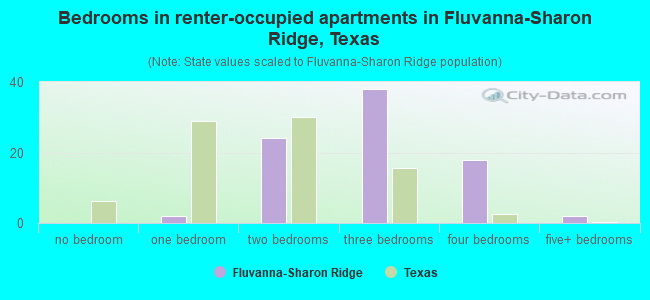
- Bedrooms in renter-occupied apartments in Fluvanna-Sharon Ridge, Texas
- 0no bedroom
- 21 bedroom
- 242 bedrooms
- 383 bedrooms
- 184 bedrooms
- 25+ bedrooms
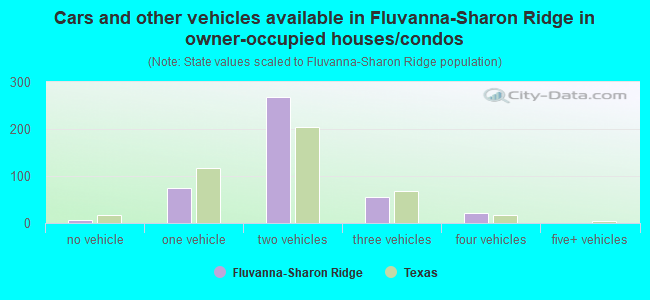
- Cars and other vehicles available in Fluvanna-Sharon Ridge in owner-occupied houses/condos
- 7no vehicle
- 751 vehicle
- 2682 vehicles
- 553 vehicles
- 224 vehicles
- 05+ vehicles
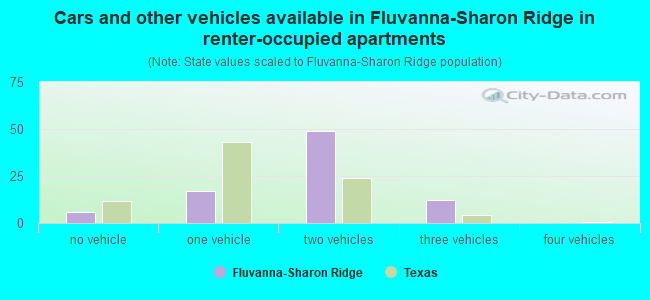
- Cars and other vehicles available in Fluvanna-Sharon Ridge in renter-occupied apartments
- 6no vehicle
- 171 vehicle
- 492 vehicles
- 123 vehicles
- 04 vehicles
- 05+ vehicles
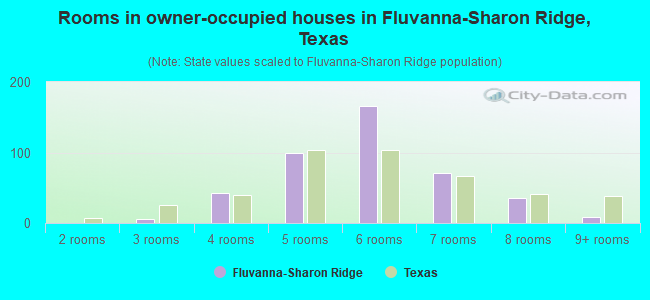
- Rooms in owner-occupied houses in Fluvanna-Sharon Ridge, Texas
- 01 room
- 02 rooms
- 53 rooms
- 434 rooms
- 995 rooms
- 1666 rooms
- 717 rooms
- 358 rooms
- 89+ rooms
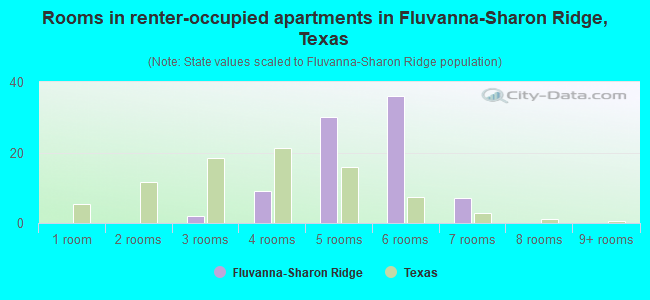
- Rooms in renter-occupied apartments in Fluvanna-Sharon Ridge, Texas
- 01 room
- 02 rooms
- 23 rooms
- 94 rooms
- 305 rooms
- 366 rooms
- 77 rooms
- 08 rooms
- 09+ rooms
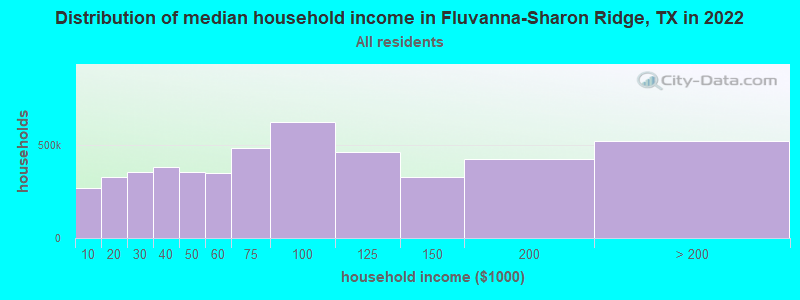
Fluvanna-Sharon Ridge, TX household income distribution

- 78,799Less than $10,000
- 107,128$10,000 to $19,999
- 116,542$20,000 to $29,999
- 122,749$30,000 to $39,999
- 115,809$40,000 to $49,999
- 111,145$50,000 to $59,999
- 153,859$60,000 to $74,999
- 210,668$75,000 to $99,999
- 159,698$100,000 to $124,999
- 117,737$125,000 to $149,999
- 136,915$150,000 to $199,999
- 153,897$200,000 or more
Percentage of workers working in this county: 91.8%
Number of people working at home: 89 (11.0% of all workers)
Travel time to work (commute)
- Less than 5 minutes: 21
- 5 to 9 minutes: 87
- 10 to 14 minutes: 114
- 15 to 19 minutes: 131
- 20 to 24 minutes: 63
- 25 to 29 minutes: 11
- 30 to 34 minutes: 36
- 35 to 39 minutes: 5
- 40 to 44 minutes: 4
- 45 to 59 minutes: 30
- 60 to 89 minutes: 37
- 90 or more minutes: 14
Means of transportation to work:
- Drove a car alone: 479 (81.2%)
- Carpooled: 57 (9.7%)
- Walked: 17 (2.9%)
- Worked at home: 37 (6.3%)
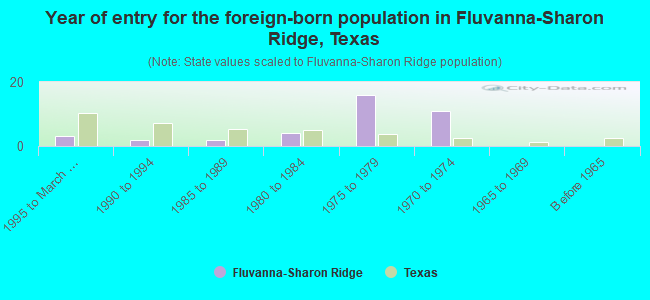
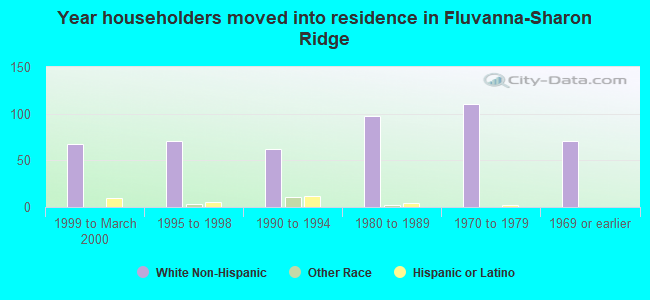
- Year of entry for the foreign-born population in Fluvanna-Sharon Ridge, Texas
- 31995 to March 2000
- 21990 to 1994
- 21985 to 1989
- 41980 to 1984
- 161975 to 1979
- 111970 to 1974
- 01965 to 1969
- 0Before 1965
Most common places of birth for foreign-born residents (%):
| Fluvanna-Sharon Ridge: | 100.0% (38) |
| Texas: | 64.8% (1,879,369) |
Place of birth for U.S.-born residents:
- This state: 1,147
- Other state: 115
- Northeast: 0
- Midwest: 28
- South: 47
- West: 40
66% of Fluvanna-Sharon Ridge residents lived in the same house 5 years ago.
Out of people who lived in different houses, 51% lived in this county.
Out of people who lived in different counties, 94% lived in Texas.
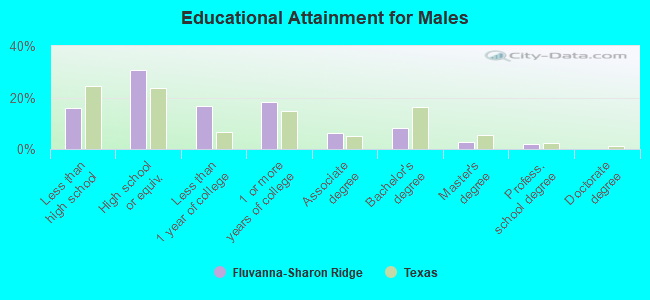
Education attainment for males 25 years and older:
- No schooling: 8
- Nursery to 4th grade: 4
- 5th and 6th grade: 4
- 7th and 8th grade: 21
- 9th grade: 7
- 10th grade: 19
- 11th grade: 5
- 12th grade, no diploma: 0
- High school graduate (or equivalency): 132
- Less than 1 year of college: 72
- Some college more than 1 year, no degree: 78
- Associate degree: 27
- Bachelor's degree: 35
- Master's degree: 11
- Professional school degree: 8
- Doctorate degree: 0
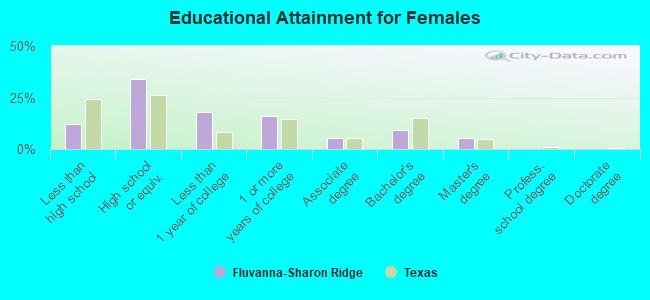
Education attainment for females 25 years and older:
- No schooling: 0
- Nursery to 4th grade: 9
- 5th and 6th grade: 0
- 7th and 8th grade: 27
- 9th grade: 4
- 10th grade: 0
- 11th grade: 16
- 12th grade, no diploma: 1
- High school graduate (or equivalency): 156
- Less than 1 year of college: 82
- Some college more than 1 year, no degree: 75
- Associate degree: 24
- Bachelor's degree: 43
- Master's degree: 25
- Professional school degree: 0
- Doctorate degree: 0
Housing units in structures:
- One, detached: 586
- One, attached: 6
- Mobile homes: 69
- Boats, RVs, vans, etc.: 6
Median worth of mobile homes: $35,893
Housing units lacking complete kitchen facilities: 3.1%
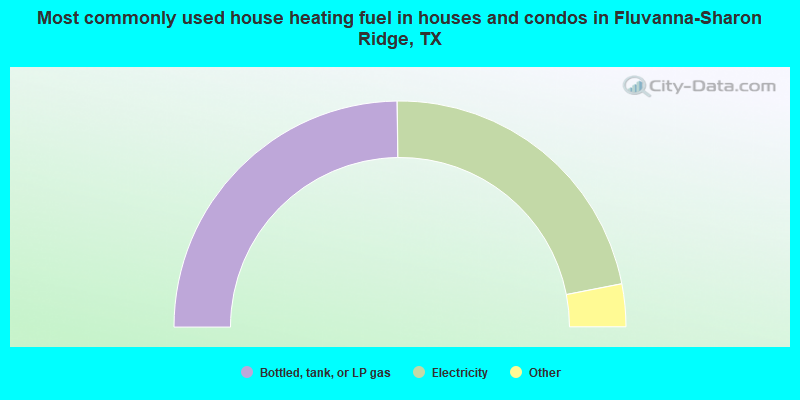
- 49.6%Bottled, tank, or LP gas
- 44.3%Electricity
- 4.0%Utility gas
- 1.6%Wood
- 0.5%Other fuel
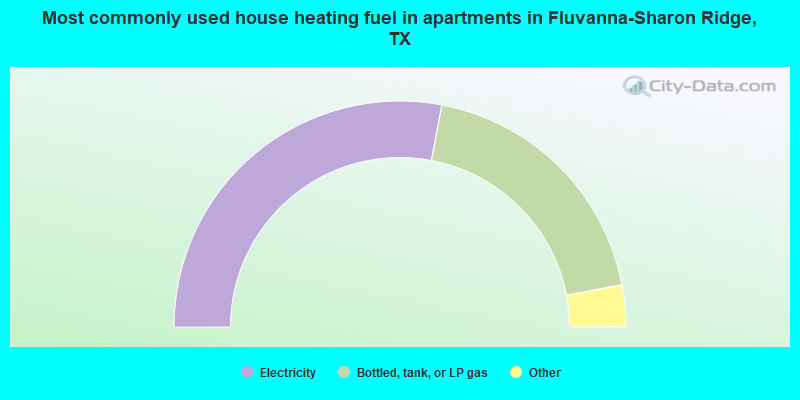
- 56.0%Electricity
- 38.1%Bottled, tank, or LP gas
- 3.6%Wood
- 2.4%Utility gas
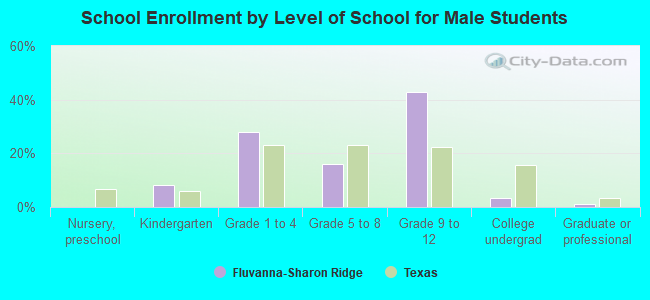
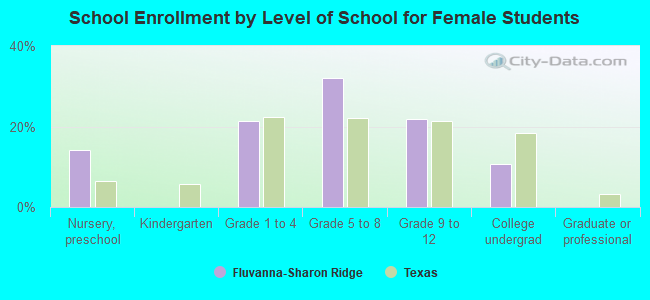
Private vs. public school enrollment:
| Here: | 3.6% |
| Texas: | 6.8% |
| Here: | 0.0% |
| Texas: | 6.2% |
| Here: | 12.5% |
| Texas: | 15.4% |