Fort Apache, AZ (Arizona) Houses and Residents
| Fort Apache: | $38,399 |
| Arizona: | $402,800 |
Total population: 368 (Urban population: 0, Rural population: 370 (8 farm, 362 nonfarm))
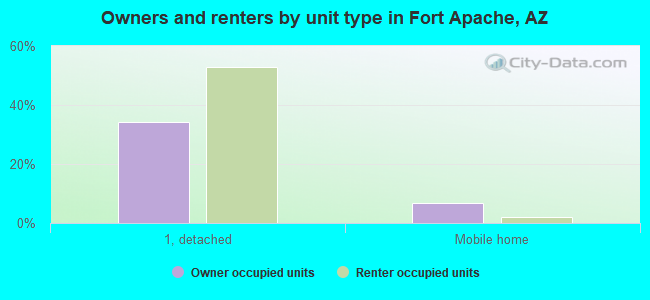
Houses: 247 (102 occupied: 43 owner occupied, 59 renter occupied)
| % of renters here: | 58% |
| State: | 33% |
Housing density: 0 houses/condos per square mile
Median price asked for vacant for-sale houses and condos in 2022 in this county: $237,500.
Median contract rent in 2022: $410 (lower quartile is $226, upper quartile is $511)
Median rent asked for vacant for-rent units in 2022: $478
Median gross rent in Fort Apache, AZ in 2022: $834
Housing units in Fort Apache with a mortgage: 6 (0 second mortgage, 0 home equity loan, 0 both second mortgage and home equity loan)
Houses without a mortgage: 29
Compare current foreclosures near your location:
| Photo | Address | Area | Beds / Baths | Price | Details |
|---|---|---|---|---|---|

|
#1
E 21st Ave
Columbus, OH 43211
|
1,061 sq. feet
|
1 baths 3 beds |
$187,900
|
show details |

|
#2
S High St
Columbus, OH 43207
|
1,678 sq. feet
|
2 baths 4 beds |
$31,900
|
show details |

|
#3
Bayberry Cir
Columbus, OH 43207
|
1,564 sq. feet
|
1 baths 3 beds |
$127,500
|
show details |

|
#4
Kingsglen Dr
Grove City, OH 43123
|
1,635 sq. feet
|
2 baths 4 beds |
show details | |

|
#5
Brookstone Dr
Westerville, OH 43082
|
1,783 sq. feet
|
3 baths 3 beds |
show details | |

|
#6
Falls Peak Ln
Delaware, OH 43015
|
1,352 sq. feet
|
2 baths 2 beds |
show details | |

|
#7
Meadowbrook Dr
Columbus, OH 43207
|
1,752 sq. feet
|
2 baths 4 beds |
show details | |

|
#8
Bunch Flower Ct
Westerville, OH 43082
|
3,173 sq. feet
|
2 baths 4 beds |
show details | |

|
#9
Sleeping Meadow Dr
New Albany, OH 43054
|
3,211 sq. feet
|
2 baths 4 beds |
show details | |

|
#10
Derrer Rd -872
Columbus, OH 43204
|
1,667 sq. feet
|
2 baths 5 beds |
show details |
| Photo | Address | Area | Beds / Baths | Price | Details |
|---|---|---|---|---|---|

|
#11
Elaine Rd
Columbus, OH 43213
|
764 sq. feet
|
1 baths 2 beds |
show details | |

|
#12
Mink St SW
Pataskala, OH 43062
|
1,442 sq. feet
|
1 baths 3 beds |
show details | |

|
#13
Bretton Pl
Columbus, OH 43211
|
1,056 sq. feet
|
1 baths 3 beds |
show details | |

|
#14
Wrexham Ave
Columbus, OH 43223
|
1,235 sq. feet
|
1 baths 3 beds |
show details | |

|
#15
Fergus Rd
Grove City, OH 43123
|
3,312 sq. feet
|
2 baths 4 beds |
show details | |

|
#16
Ferris Rd
Columbus, OH 43224
|
2,218 sq. feet
|
3 baths 3 beds |
show details | |

|
#17
S Hague Ave
Columbus, OH 43204
|
979 sq. feet
|
1 baths 2 beds |
show details | |

|
#18
Fahlander Dr N
Columbus, OH 43229
|
1,338 sq. feet
|
2 baths 3 beds |
show details | |

|
#19
Bernadette Rd
Columbus, OH 43204
|
1,168 sq. feet
|
1 baths 3 beds |
show details | |

|
#20
Midland Ave
Columbus, OH 43223
|
1,518 sq. feet
|
1 baths 2 beds |
show details |
| Photo | Address | Area | Beds / Baths | Price | Details |
|---|---|---|---|---|---|

|
#21
N Roys Ave
Columbus, OH 43204
|
1,248 sq. feet
|
2 baths 3 beds |
show details | |

|
#22
Marshrun Dr
Grove City, OH 43123
|
2,036 sq. feet
|
2 baths 4 beds |
show details | |

|
#23
N Grener Ave
Columbus, OH 43228
|
1,120 sq. feet
|
1 baths 3 beds |
show details | |

|
#24
Belle Oak Dr
Galloway, OH 43119
|
1,296 sq. feet
|
2 baths 3 beds |
show details | |

|
#25
Mayflower Blvd
Columbus, OH 43213
|
1,591 sq. feet
|
2 baths 4 beds |
show details | |

|
#26
Rosewood Ct
Powell, OH 43065
|
2,801 sq. feet
|
3 baths 4 beds |
show details | |

|
#27
High Free Pike
West Jefferson, OH 43162
|
1,216 sq. feet
|
2 baths 4 beds |
show details | |

|
#28
Stoneybrook Blvd # 21a
Hilliard, OH 43026
|
1,231 sq. feet
|
2 baths 3 beds |
show details | |

|
#29
S Richardson Ave
Columbus, OH 43204
|
1,520 sq. feet
|
2 baths 3 beds |
show details | |

|
#30
Edgeview Rd
Columbus, OH 43207
|
1,700 sq. feet
|
1 baths 4 beds |
show details |
| Photo | Address | Area | Beds / Baths | Price | Details |
|---|---|---|---|---|---|

|
#31
Striebel Ct
Columbus, OH 43227
|
925 sq. feet
|
1 baths 3 beds |
show details | |

|
#32
Scottwood Rd
Columbus, OH 43227
|
1,008 sq. feet
|
1 baths 3 beds |
show details | |

|
#33
Vineyard Haven Loop
Dublin, OH 43016
|
4,625 sq. feet
|
4 baths 4 beds |
show details | |

|
#34
S Chillicothe St
Plain City, OH 43064
|
1,736 sq. feet
|
2 baths 4 beds |
show details | |

|
#35
Trotter Dr
Columbus, OH 43207
|
1,478 sq. feet
|
1 baths 3 beds |
show details | |

|
#36
Doral Ave
Columbus, OH 43213
|
2,008 sq. feet
|
2 baths 4 beds |
show details | |

|
#37
Cole Rd
Columbus, OH 43228
|
1,833 sq. feet
|
2 baths 3 beds |
show details | |

|
#38
Bucknell Rd
Columbus, OH 43213
|
1,054 sq. feet
|
1 baths 3 beds |
show details | |

|
#39
Simpson Dr
Columbus, OH 43227
|
1,104 sq. feet
|
1 baths 3 beds |
show details | |

|
#40
Belfast Dr
Columbus, OH 43227
|
1,142 sq. feet
|
2 baths 3 beds |
show details |
| Photo | Address | Area | Beds / Baths | Price | Details |
|---|---|---|---|---|---|

|
#41
Morality Dr
Columbus, OH 43231
|
1,903 sq. feet
|
2 baths 4 beds |
show details | |

|
#42
Torchwood Loop E
Columbus, OH 43229
|
2,421 sq. feet
|
2 baths 5 beds |
show details | |

|
#43
Jason Dr
Columbus, OH 43227
|
1,602 sq. feet
|
2 baths 3 beds |
show details | |

|
#44
Omega Dr
Columbus, OH 43231
|
1,292 sq. feet
|
2 baths 3 beds |
show details | |

|
#45
Oklahoma Ave
Columbus, OH 43230
|
1,824 sq. feet
|
1 baths 4 beds |
show details | |

|
#46
Sapphire Dr
Grove City, OH 43123
|
3,241 sq. feet
|
3 baths 4 beds |
show details | |

|
#47
Colorado Ave
Groveport, OH 43125
|
1,502 sq. feet
|
1 baths 3 beds |
show details | |

|
#48
Allwood Ct
Columbus, OH 43231
|
1,683 sq. feet
|
2 baths 3 beds |
show details | |

|
#49
Jed Ct
Columbus, OH 43227
|
1,086 sq. feet
|
1 baths 3 beds |
show details | |

|
Check over 1 million property listings on Foreclosure.com!
|
browse all offers | |||


Household type by relationship:
Households: 70,577- In family households: 63,224 (8,840 male householders, 7,491 female householders)
9,746 spouses, 25,393 children (23,955 natural, 509 adopted, 929 stepchildren), 5,620 grandchildren, 1,079 brothers or sisters, 675 parents, foster children, 1,504 other relatives, 1,821 non-relatives
- In nonfamily households: 7,353 (3,660 male householders (3,228 living alone)), 2,780 female householders (2,426 living alone)), 913 nonrelatives
- In group quarters: 941 (503 institutionalized population)
14,878 married couples with children.
6,789 single-parent households (1,305 men, 5,484 women).
50.3% of residents of Fort Apache speak English at home.
8.8% of residents speak Spanish at home (62% speak English very well, 38% speak English well).
40.9% of residents speak other language at home (70% speak English very well, 27% speak English well, 3% speak English not well).
Foreign born population: 16 (4.6%)
(31.2% of them are naturalized citizens)
| Here: | 4.8 |
| State: | 6.0 |
| Here: | 3.3 |
| State: | 4.1 |
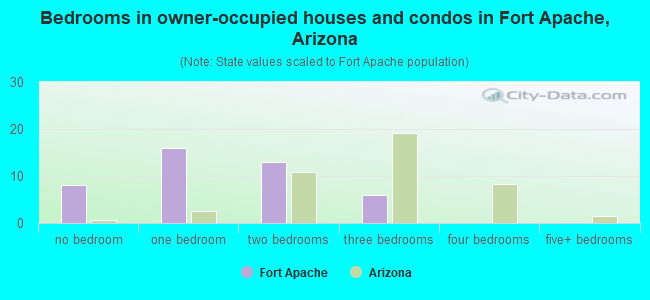
- Bedrooms in owner-occupied houses and condos in Fort Apache, Arizona
- 8no bedroom
- 161 bedroom
- 132 bedrooms
- 63 bedrooms
- 04 bedrooms
- 05+ bedrooms
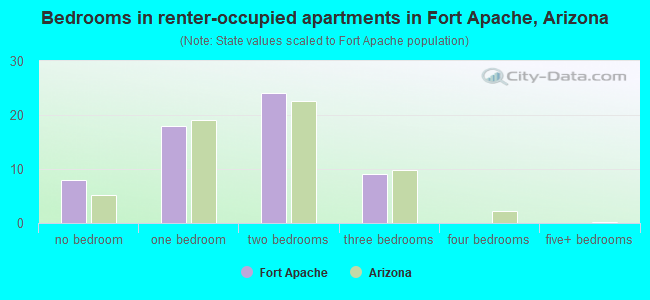
- Bedrooms in renter-occupied apartments in Fort Apache, Arizona
- 8no bedroom
- 181 bedroom
- 242 bedrooms
- 93 bedrooms
- 04 bedrooms
- 05+ bedrooms
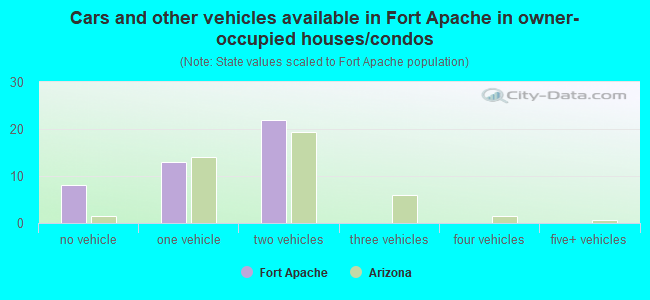
- Cars and other vehicles available in Fort Apache in owner-occupied houses/condos
- 8no vehicle
- 131 vehicle
- 222 vehicles
- 03 vehicles
- 04 vehicles
- 05+ vehicles
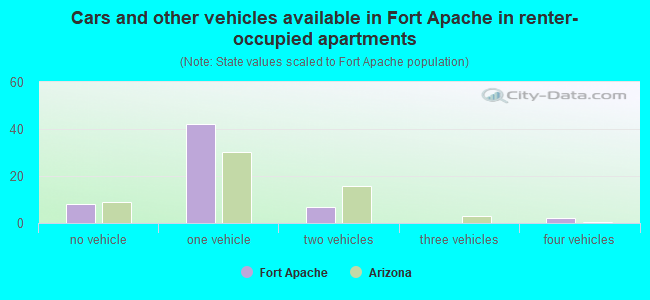
- Cars and other vehicles available in Fort Apache in renter-occupied apartments
- 8no vehicle
- 421 vehicle
- 72 vehicles
- 03 vehicles
- 24 vehicles
- 05+ vehicles
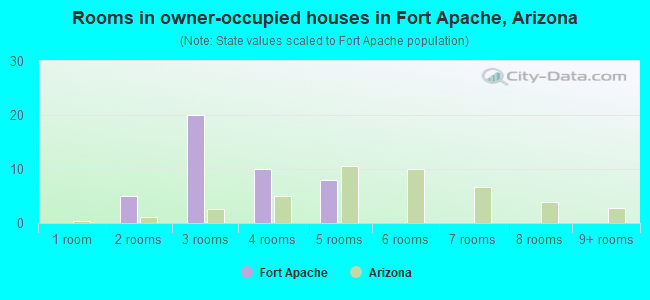
- Rooms in owner-occupied houses in Fort Apache, Arizona
- 01 room
- 52 rooms
- 203 rooms
- 104 rooms
- 85 rooms
- 06 rooms
- 07 rooms
- 08 rooms
- 09+ rooms
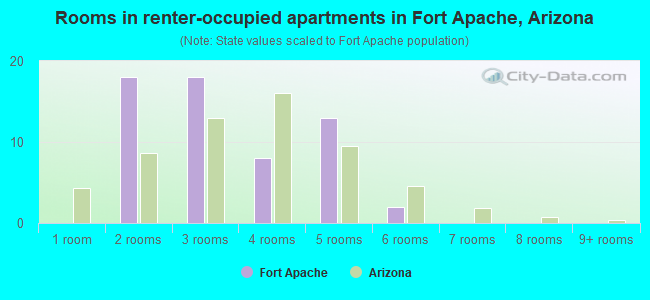
- Rooms in renter-occupied apartments in Fort Apache, Arizona
- 01 room
- 182 rooms
- 183 rooms
- 84 rooms
- 135 rooms
- 26 rooms
- 07 rooms
- 08 rooms
- 09+ rooms
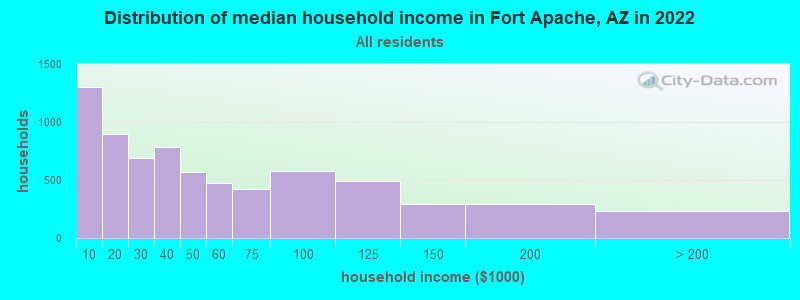
Fort Apache, AZ household income distribution

- 1,300Less than $10,000
- 899$10,000 to $19,999
- 690$20,000 to $29,999
- 781$30,000 to $39,999
- 571$40,000 to $49,999
- 475$50,000 to $59,999
- 422$60,000 to $74,999
- 576$75,000 to $99,999
- 490$100,000 to $124,999
- 290$125,000 to $149,999
- 295$150,000 to $199,999
- 229$200,000 or more
Percentage of workers working in this county: 51.1%
Number of people working at home: 15 (15.2% of all workers)
Travel time to work (commute)
- Less than 5 minutes: 17
- 5 to 9 minutes: 16
- 10 to 14 minutes: 6
- 15 to 19 minutes: 4
- 20 to 24 minutes: 5
- 25 to 29 minutes: 0
- 30 to 34 minutes: 21
- 35 to 39 minutes: 2
- 40 to 44 minutes: 0
- 45 to 59 minutes: 2
- 60 to 89 minutes: 0
- 90 or more minutes: 2
Means of transportation to work:
- Drove a car alone: 36 (48.0%)
- Carpooled: 23 (30.7%)
- Bus or trolley bus: 8 (10.7%)
- Walked: 8 (10.7%)
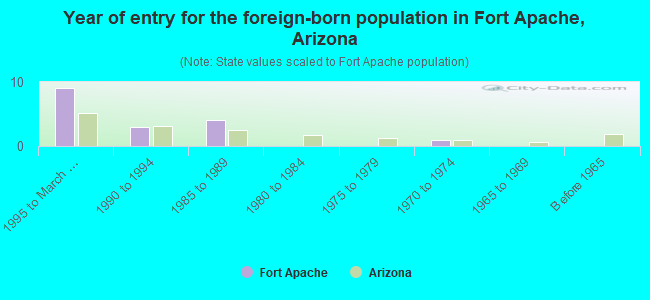
- Year of entry for the foreign-born population in Fort Apache, Arizona
- 91995 to March 2000
- 31990 to 1994
- 41985 to 1989
- 01980 to 1984
- 01975 to 1979
- 11970 to 1974
- 01965 to 1969
- 0Before 1965
Most common places of birth for foreign-born residents (%):
| Fort Apache: | 82.4% (14) |
| Arizona: | 66.4% (436,022) |
| Fort Apache: | 17.6% (3) |
| Arizona: | 4.0% (26,323) |
Place of birth for U.S.-born residents:
- This state: 312
- Other state: 41
- Northeast: 0
- Midwest: 7
- South: 8
- West: 26
58% of Fort Apache residents lived in the same house 5 years ago.
Out of people who lived in different houses, 35% lived in this county.
Out of people who lived in different counties, 75% lived in Arizona.
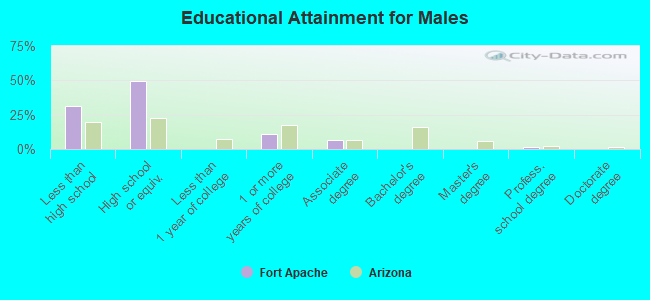
Education attainment for males 25 years and older:
- No schooling: 1
- Nursery to 4th grade: 0
- 5th and 6th grade: 7
- 7th and 8th grade: 1
- 9th grade: 2
- 10th grade: 1
- 11th grade: 3
- 12th grade, no diploma: 8
- High school graduate (or equivalency): 36
- Less than 1 year of college: 0
- Some college more than 1 year, no degree: 8
- Associate degree: 5
- Bachelor's degree: 0
- Master's degree: 0
- Professional school degree: 1
- Doctorate degree: 0
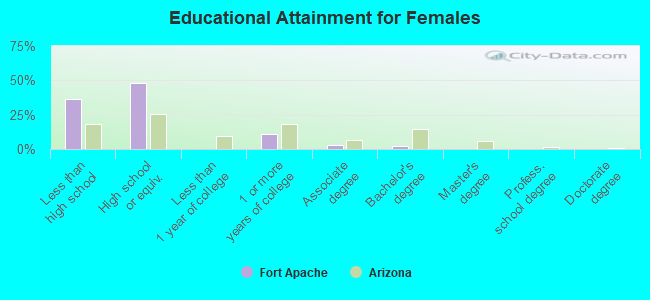
Education attainment for females 25 years and older:
- No schooling: 0
- Nursery to 4th grade: 0
- 5th and 6th grade: 0
- 7th and 8th grade: 4
- 9th grade: 4
- 10th grade: 9
- 11th grade: 10
- 12th grade, no diploma: 7
- High school graduate (or equivalency): 45
- Less than 1 year of college: 0
- Some college more than 1 year, no degree: 10
- Associate degree: 3
- Bachelor's degree: 2
- Master's degree: 0
- Professional school degree: 0
- Doctorate degree: 0
Housing units in structures:
- One, detached: 224
- One, attached: 6
- Two: 4
- Mobile homes: 12
- Boats, RVs, vans, etc.: 1
Median worth of mobile homes: $63,621
Housing units lacking complete kitchen facilities: 4.0%
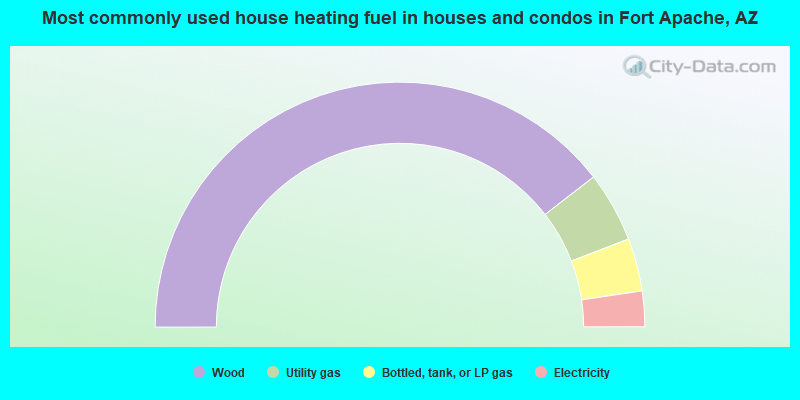
- 79.1%Wood
- 9.3%Utility gas
- 7.0%Bottled, tank, or LP gas
- 4.7%Electricity
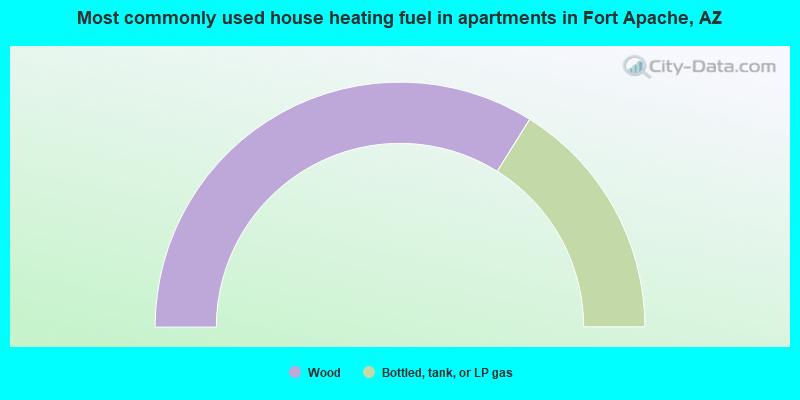
- 67.8%Wood
- 32.2%Bottled, tank, or LP gas
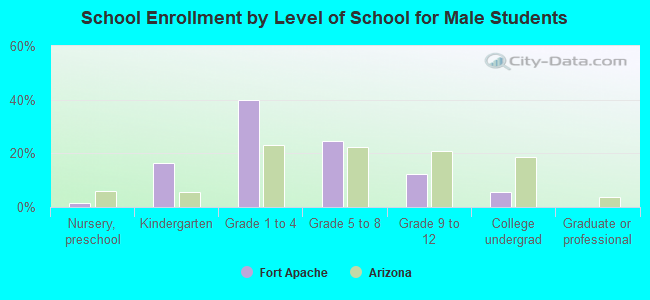
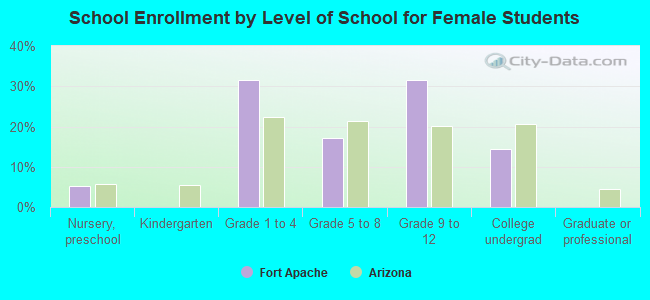
Private vs. public school enrollment:
| Here: | 7.1% |
| Arizona: | 6.1% |
| Here: | 6.1% |
| Arizona: | 6.1% |
| Here: | 0.0% |
| Arizona: | 13.2% |