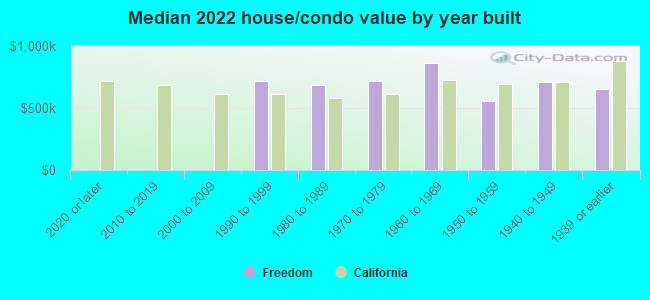
Freedom, CA (California) Houses and Residents
| Freedom: | $688,510 |
| California: | $715,900 |
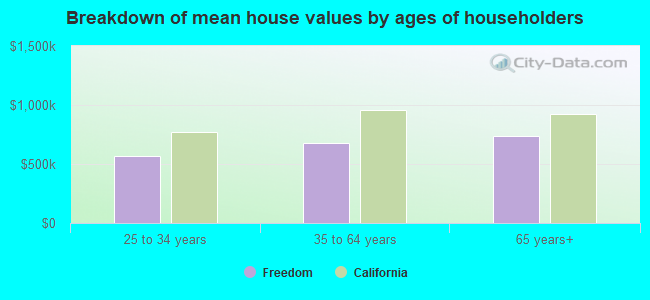
Mean price in 2022:
Detached houses: $694,352
Here: $694,352 State: $988,808
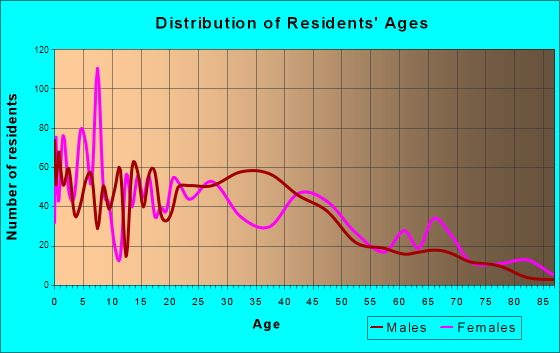
Total population: 3,070 (All urban)
Houses: 958 (926 occupied: 532 owner occupied, 384 renter occupied)
| % of renters here: | 42% |
| State: | 44% |
Housing density: 715 houses/condos per square mile
Median price asked for vacant for-sale houses and condos in 2022 in this county: $1,182,827.
Median contract rent in 2022: $1,341 (lower quartile is $895, upper quartile is $1,738)
Median gross rent in Freedom, CA in 2022: $1,555
Housing units in Freedom with a mortgage: 365 (30 second mortgage, 0 home equity loan, 27 both second mortgage and home equity loan)
Houses without a mortgage: 0
Median household income for houses/condos with a mortgage: $152,694
Median monthly housing costs: $1,570
Compare current foreclosures near Freedom, CA:
| Photo | Address | Area | Beds / Baths | Price | Details |
|---|---|---|---|---|---|

|
#1
Jared Way
Freedom, CA 95019
|
- sq. feet
|
4 baths 3 beds |
show details | |

|
#2
Bowker Rd
Freedom, CA 95019
|
- sq. feet
|
2 baths 2 beds |
show details | |

|
#3
Compton Ter
Freedom, CA 95019
|
- sq. feet
|
2 baths 4 beds |
show details | |

|
#4
Pajaro Cir
Freedom, CA 95019
|
- sq. feet
|
4 baths 4 beds |
show details | |

|
#5
Alisa Cir
Watsonville, CA 95076
|
1,026 sq. feet
|
1 baths 2 beds |
show details | |

|
#6
Enos Ln
Watsonville, CA 95076
|
2,179 sq. feet
|
2 baths 3 beds |
show details | |

|
#7
Church St
Gilroy, CA 95020
|
2,094 sq. feet
|
2 baths 4 beds |
show details | |

|
#8
La Alameda Dr
Morgan Hill, CA 95037
|
1,615 sq. feet
|
2 baths 3 beds |
show details | |

|
#9
Hall Ranch Rd
Santa Cruz, CA 95065
|
1,534 sq. feet
|
2 baths 2 beds |
show details | |

|
#10
Westwood Dr
Gilroy, CA 95020
|
1,524 sq. feet
|
2 baths 3 beds |
show details |
| Photo | Address | Area | Beds / Baths | Price | Details |
|---|---|---|---|---|---|

|
#11
Rodeo Dr
Gilroy, CA 95020
|
2,658 sq. feet
|
3 baths 5 beds |
show details | |

|
#12
Poppyfield St
Gilroy, CA 95020
|
2,044 sq. feet
|
2 baths 3 beds |
show details | |

|
#13
Migues Mountain Ln
Aptos, CA 95003
|
4,500 sq. feet
|
2 baths 3 beds |
show details | |

|
#14
Princevalle St
Gilroy, CA 95020
|
1,246 sq. feet
|
2 baths 4 beds |
show details | |

|
#15
Marilyn Ln
Aromas, CA 95004
|
1,801 sq. feet
|
2 baths 3 beds |
show details | |

|
#16
Gaunt Ave
Gilroy, CA 95020
|
1,252 sq. feet
|
2 baths 3 beds |
show details | |

|
#17
Gaunt Ave
Gilroy, CA 95020
|
1,252 sq. feet
|
2 baths 3 beds |
show details | |

|
#18
Briarberry Ln
Gilroy, CA 95020
|
2,544 sq. feet
|
2 baths 4 beds |
show details | |

|
#19
Dovetail Way
Gilroy, CA 95020
|
3,012 sq. feet
|
3 baths 5 beds |
show details | |

|
#20
Venetian Way
Morgan Hill, CA 95037
|
1,858 sq. feet
|
2 baths 3 beds |
show details |
| Photo | Address | Area | Beds / Baths | Price | Details |
|---|---|---|---|---|---|

|
#21
W San Martin Ave
San Martin, CA 95046
|
1,120 sq. feet
|
2 baths 3 beds |
show details | |

|
#22
Berta Canyon Rd
Salinas, CA 93907
|
1,620 sq. feet
|
2 baths 3 beds |
show details | |

|
#23
Acorn Way
Gilroy, CA 95020
|
2,104 sq. feet
|
2 baths 4 beds |
show details | |

|
#24
Acorn Way
Gilroy, CA 95020
|
2,062 sq. feet
|
2 baths 4 beds |
show details | |

|
#25
Campo De Casa Dr
Castroville, CA 95012
|
1,146 sq. feet
|
2 baths 3 beds |
show details | |

|
#26
Comunidad Way
Castroville, CA 95012
|
1,246 sq. feet
|
2 baths 4 beds |
show details | |

|
#27
Rosanna St
Gilroy, CA 95020
|
1,058 sq. feet
|
1 baths 3 beds |
show details | |

|
#28
W Dunne Ave
Morgan Hill, CA 95037
|
1,215 sq. feet
|
2 baths 3 beds |
show details | |

|
#29
Silk Oak Pl
Salinas, CA 93907
|
1,966 sq. feet
|
2 baths 4 beds |
show details | |

|
#30
Wright Ave
Morgan Hill, CA 95037
|
1,563 sq. feet
|
2 baths 3 beds |
show details |
| Photo | Address | Area | Beds / Baths | Price | Details |
|---|---|---|---|---|---|

|
#31
Berta Canyon Rd
Salinas, CA 93907
|
1,390 sq. feet
|
1 baths 2 beds |
show details | |

|
#32
Creekside Cir
Morgan Hill, CA 95037
|
1,613 sq. feet
|
2 baths 2 beds |
show details | |

|
#33
Carlson Rd
Salinas, CA 93907
|
1,550 sq. feet
|
1 baths 2 beds |
show details | |

|
#34
Carpenteria Rd
Aromas, CA 95004
|
1,270 sq. feet
|
3 baths 5 beds |
show details | |

|
#35
Foothill Ave
San Martin, CA 95046
|
4,827 sq. feet
|
5 baths 6 beds |
show details | |

|
#36
Rosemary Cir
Morgan Hill, CA 95037
|
1,068 sq. feet
|
1 baths 2 beds |
show details | |

|
#37
Johnson Rd
Watsonville, CA 95076
|
1,852 sq. feet
|
3 baths 6 beds |
show details | |

|
#38
Las Lomas Dr
Watsonville, CA 95076
|
1,120 sq. feet
|
1 baths 3 beds |
show details | |

|
#39
Willow Rd
Watsonville, CA 95076
|
1,976 sq. feet
|
1 baths 4 beds |
show details | |

|
#40
Gregory Rd
Watsonville, CA 95076
|
1,619 sq. feet
|
2 baths 4 beds |
show details |
| Photo | Address | Area | Beds / Baths | Price | Details |
|---|---|---|---|---|---|

|
#41
Osborn Rd
Watsonville, CA 95076
|
1,228 sq. feet
|
1 baths 3 beds |
show details | |

|
#42
Canyon Oak Rd
Salinas, CA 93907
|
1,724 sq. feet
|
2 baths 3 beds |
show details | |

|
#43
Gaunt Ave
Gilroy, CA 95020
|
1,102 sq. feet
|
2 baths 3 beds |
show details | |

|
#44
W 9th St
Gilroy, CA 95020
|
2,059 sq. feet
|
2 baths 4 beds |
show details | |

|
#45
Bennett St
Gilroy, CA 95020
|
1,452 sq. feet
|
2 baths 3 beds |
show details | |

|
#46
Lawrence Dr
Gilroy, CA 95020
|
1,719 sq. feet
|
2 baths 3 beds |
show details | |

|
#47
Williamsburg Way
Gilroy, CA 95020
|
1,663 sq. feet
|
2 baths 3 beds |
show details | |

|
#48
Palmer St
Castroville, CA 95012
|
900 sq. feet
|
1 baths 2 beds |
show details | |

|
#49
Blackberry Ct
Gilroy, CA 95020
|
3,028 sq. feet
|
3 baths 5 beds |
show details | |

|
Check over 1 million property listings on Foreclosure.com!
|
browse all offers | |||

Latest news about housing in Freedom, CA collected exclusively by city-data.com from local newspapers, TV, and radio stations


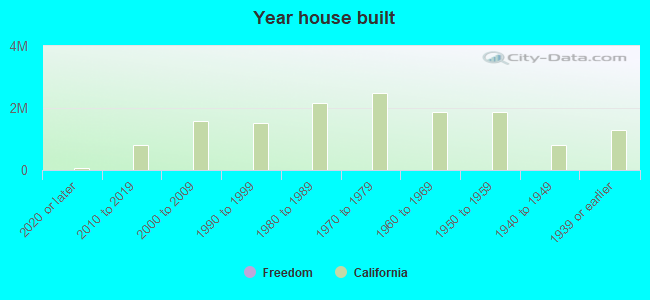
Median year apartment built: 1969
Household type by relationship:
Households: 3,307- Male householders: 438 (126 living alone), Female householders: 468 (23 living alone)
395 spouses (395 opposite-sex spouses), 112 unmarried partners, (112 opposite-sex unmarried partners), 1,027 children (1,024 natural, 0 adopted, 2 stepchildren), 152 grandchildren, 96 brothers or sisters, 137 parents, 0 foster children, 182 other relatives, 290 non-relatives
- In group quarters: 5
Size of family households: 143 2-persons, 179 3-persons, 164 4-persons, 74 5-persons, 65 6-persons, 83 7-or-more-persons.
Size of nonfamily households: 152 1-person, 24 2-persons, 12 5-persons.
373 married couples with children.
302 single-parent households (135 men, 167 women).
42.9% of residents of Freedom speak English at home.
53.0% of residents speak Spanish at home (49% speak English very well, 23% speak English well, 12% speak English not well, 16% don't speak English at all).
0.9% of residents speak other Indo-European language at home (100% speak English very well).
1.9% of residents speak Asian or Pacific Island language at home (92% speak English very well, 8% speak English well).
1.0% of residents speak other language at home (74% speak English very well, 26% speak English well).
Foreign born population: 902 (27.3%)
(41.7% of them are naturalized citizens)
| Here: | 5.7 |
| State: | 6.0 |
| Here: | 4.4 |
| State: | 3.9 |
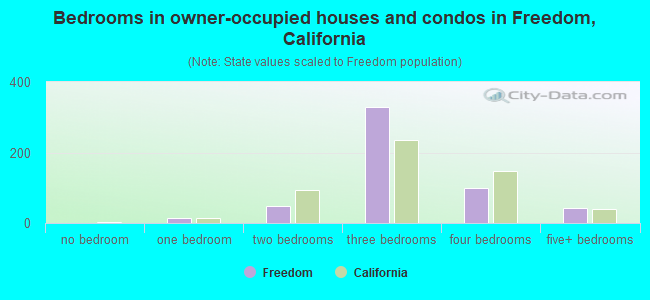
- Bedrooms in owner-occupied houses and condos in Freedom, California
- 0no bedroom
- 131 bedroom
- 492 bedrooms
- 3293 bedrooms
- 1004 bedrooms
- 425+ bedrooms
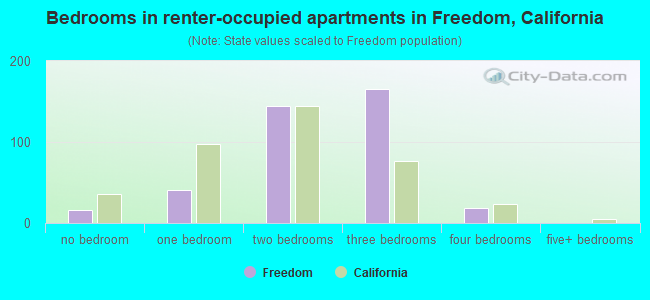
- Bedrooms in renter-occupied apartments in Freedom, California
- 16no bedroom
- 411 bedroom
- 1442 bedrooms
- 1653 bedrooms
- 184 bedrooms
- 05+ bedrooms
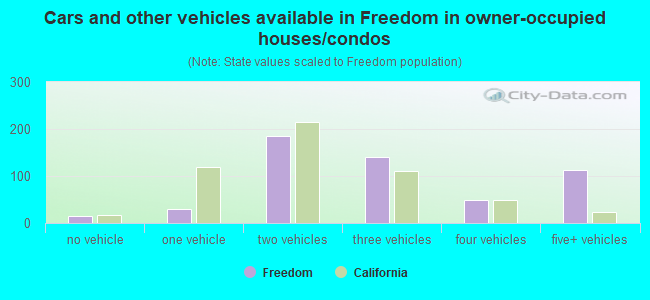
- Cars and other vehicles available in Freedom in owner-occupied houses/condos
- 14no vehicle
- 291 vehicle
- 1862 vehicles
- 1413 vehicles
- 494 vehicles
- 1135+ vehicles
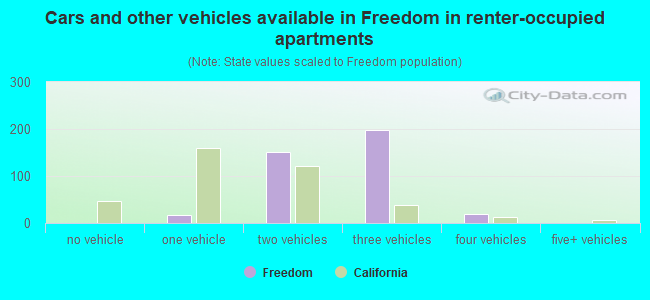
- Cars and other vehicles available in Freedom in renter-occupied apartments
- 0no vehicle
- 161 vehicle
- 1512 vehicles
- 1973 vehicles
- 204 vehicles
- 05+ vehicles
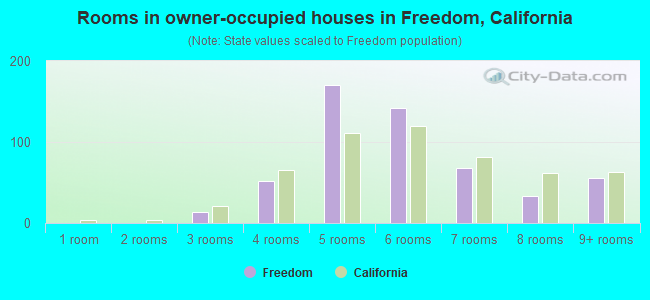
- Rooms in owner-occupied houses in Freedom, California
- 01 room
- 02 rooms
- 133 rooms
- 524 rooms
- 1705 rooms
- 1426 rooms
- 687 rooms
- 338 rooms
- 559+ rooms
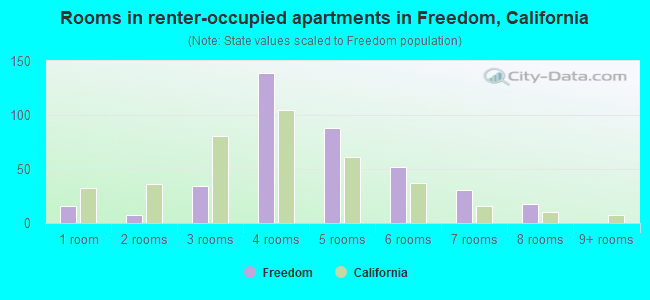
- Rooms in renter-occupied apartments in Freedom, California
- 161 room
- 72 rooms
- 343 rooms
- 1394 rooms
- 885 rooms
- 526 rooms
- 317 rooms
- 188 rooms
- 09+ rooms
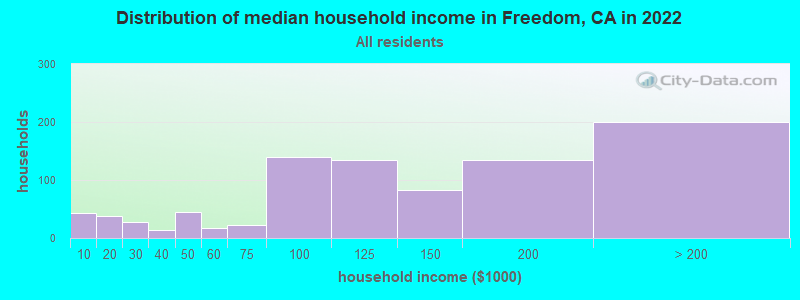
Freedom, CA household income distribution

- 43Less than $10,000
- 38$10,000 to $19,999
- 28$20,000 to $29,999
- 14$30,000 to $39,999
- 45$40,000 to $49,999
- 18$50,000 to $59,999
- 22$60,000 to $74,999
- 139$75,000 to $99,999
- 135$100,000 to $124,999
- 83$125,000 to $149,999
- 134$150,000 to $199,999
- 200$200,000 or more
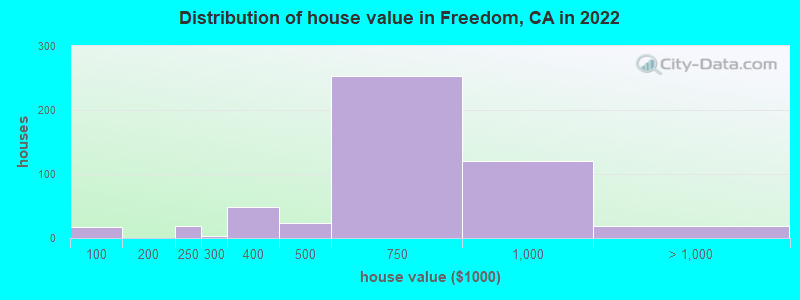
Home value of owner - occupied houses in 2022 in Freedom, CA
-
- 2$25,000 to $29,999
- 17$70,000 to $79,999
- 18$200,000 to $249,999
- 2$250,000 to $299,999
- 48$300,000 to $399,999
- 23$400,000 to $499,999
- 253$500,000 to $749,999
- 119$750,000 to $999,999
- 16$1,000,000 to $1,499,999
- 2$1,500,000 to $1,999,999
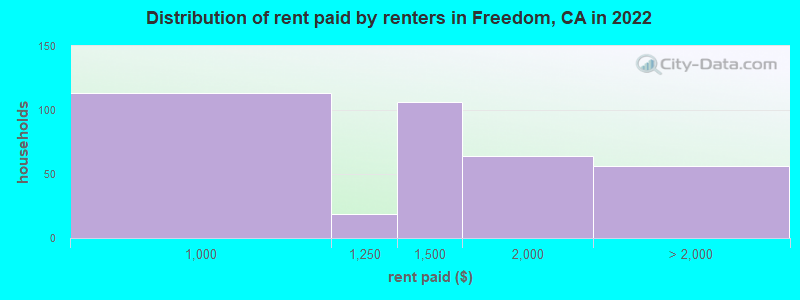
Rent paid by renters in 2022 in Freedom, CA
-
- 113$900 to $999
- 19$1,000 to $1,249
- 106$1,250 to $1,499
- 64$1,500 to $1,999
- 25$2,500 to $2,999
- 30No cash rent
Percentage of workers working in this county: 81.4%
Number of people working at home: 88 (5.7% of all workers)
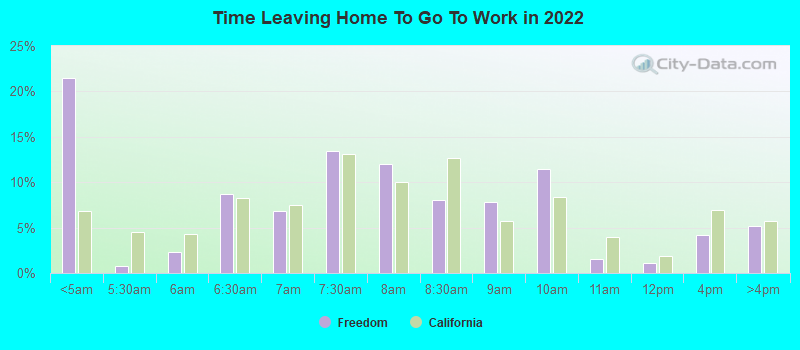
Travel time to work (commute)
- Less than 5 minutes: 27
- 5 to 9 minutes: 114
- 10 to 14 minutes: 310
- 15 to 19 minutes: 228
- 20 to 24 minutes: 100
- 25 to 29 minutes: 28
- 30 to 34 minutes: 102
- 35 to 39 minutes: 55
- 40 to 44 minutes: 122
- 45 to 59 minutes: 188
- 60 to 89 minutes: 59
- 90 or more minutes: 85
Means of transportation to work:
- Drove a car alone: 1,409 (62.0%)
- Carpooled: 650 (28.6%)
- Bus or trolley bus: 58 (2.6%)
- Walked: 49 (2.2%)
- Other means: 47 (2.1%)
- Worked at home: 61 (2.7%)
- Unemployment by race in 2022
- Unemployment rate for White non-Hispanic residents
- 9.2%Females
- Unemployment rate for other race residents
- 3.9%Males
- 34.5%Females
- Unemployment rate for Hispanic or Latino residents
- 3.2%Males
- 14.7%Females
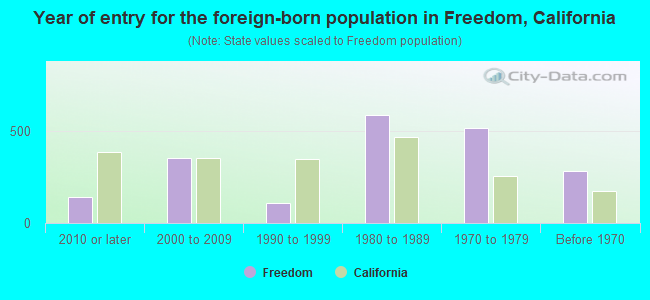
- Year of entry for the foreign-born population in Freedom, California
- 1432010 or later
- 3522000 to 2009
- 1101990 to 1999
- 5891980 to 1989
- 5191970 to 1979
- 281Before 1970
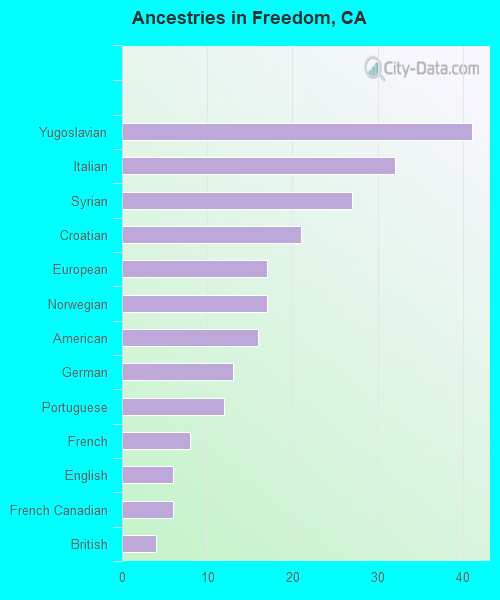
First ancestries reported:
- Yugoslavian: 41 (2.2%)
- Italian: 32 (1.7%)
- Syrian: 27 (1.5%)
- Croatian: 21 (1.1%)
- European: 17 (0.9%)
- Norwegian: 17 (0.9%)
- American: 16 (0.9%)
- German: 13 (0.7%)
- Portuguese: 12 (0.7%)
- French: 8 (0.4%)
- English: 6 (0.3%)
- French Canadian: 6 (0.3%)
- British: 4 (0.2%)
Most common places of birth for foreign-born residents (%):
| Freedom: | 90.7% (797) |
| California: | 37.2% (3,881,193) |
| Freedom: | 3.1% (27) |
| California: | 0.3% (30,949) |
| Freedom: | 2.8% (25) |
| California: | 0.0% (4,947) |
Place of birth for U.S.-born residents:
- This state: 2,278
- Other state: 122
- Northeast: 11
- Midwest: 44
- South: 43
- West: 20
93.7% of Freedom residents lived in the same house 1 years ago.
Out of people who lived in different houses, 25.4% lived in this county.
Out of people who lived in different counties, 100.0% lived in California.
| Freedom: | 93.7% |
| State average: | 88.9% |
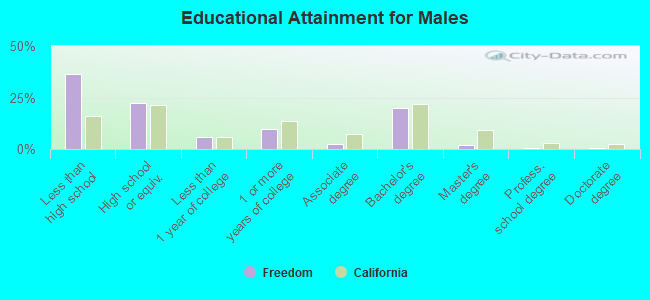
Education attainment for males 25 years and older:
- No schooling: 121
- Nursery to 4th grade: 23
- 5th and 6th grade: 143
- 7th and 8th grade: 32
- 9th grade: 5
- 10th grade: 20
- 11th grade: 0
- 12th grade, no diploma: 13
- High school graduate (or equivalency): 217
- Less than 1 year of college: 57
- Some college more than 1 year, no degree: 94
- Associate degree: 22
- Bachelor's degree: 195
- Master's degree: 21
- Professional school degree: 4
- Doctorate degree: 7
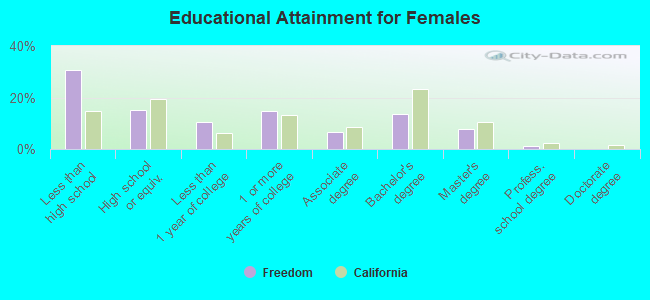
Education attainment for females 25 years and older:
- No schooling: 71
- Nursery to 4th grade: 32
- 5th and 6th grade: 94
- 7th and 8th grade: 14
- 9th grade: 0
- 10th grade: 6
- 11th grade: 6
- 12th grade, no diploma: 56
- High school graduate (or equivalency): 137
- Less than 1 year of college: 96
- Some college more than 1 year, no degree: 135
- Associate degree: 60
- Bachelor's degree: 125
- Master's degree: 71
- Professional school degree: 12
- Doctorate degree: 0
Housing units in structures:
- One, detached: 669
- One, attached: 152
- 5 to 9: 57
- 50 or more: 37
- Mobile homes: 20
- Boats, RVs, vans, etc.: 21
Housing units lacking complete kitchen facilities in 2022: 2.4%
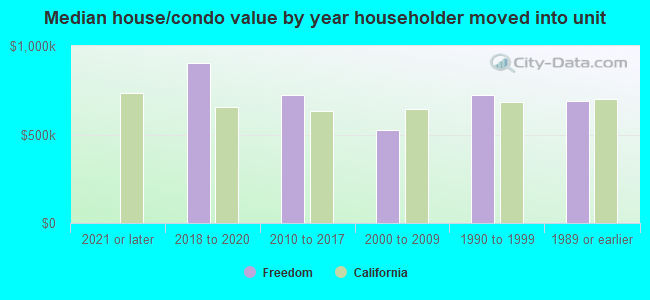
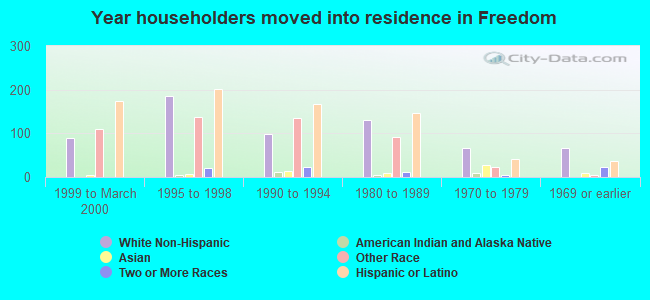
House/condo owner moved in on average 19 years ago
Renter moved in on average 14 years ago
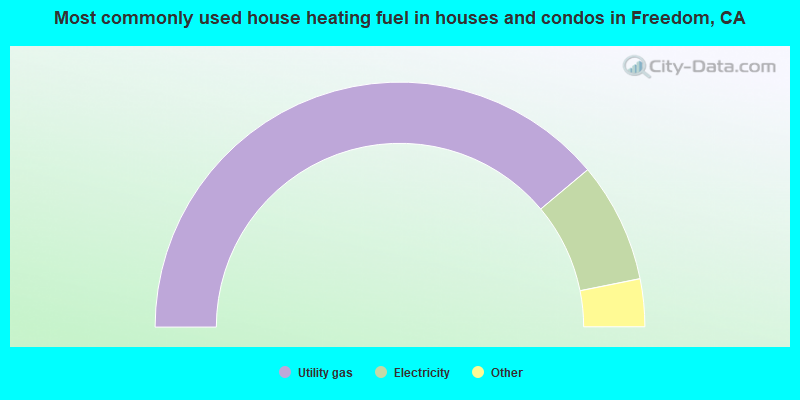
- 77.9%Utility gas
- 15.9%Electricity
- 2.2%Bottled, tank, or LP gas
- 1.5%No fuel used
- 1.3%Wood
- 1.1%Solar energy
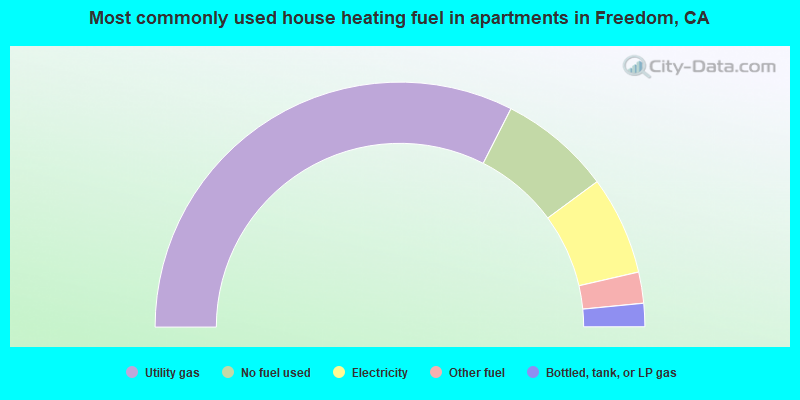
- 65.0%Utility gas
- 14.8%No fuel used
- 13.0%Electricity
- 4.1%Other fuel
- 3.1%Bottled, tank, or LP gas
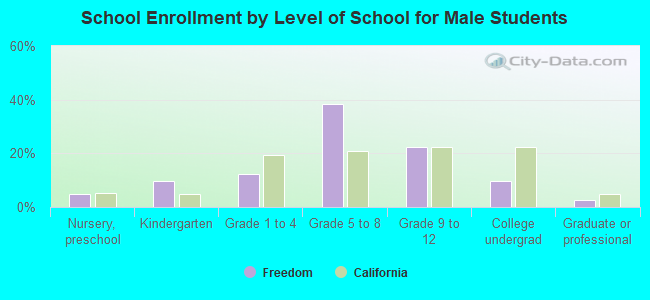
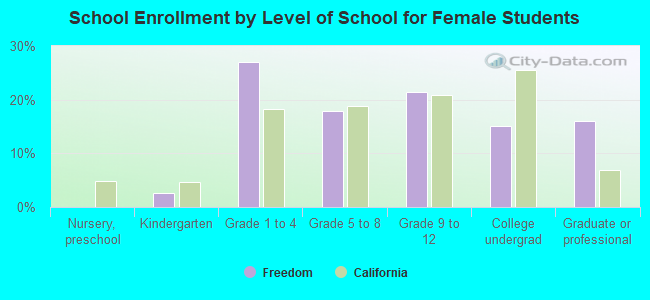
Private vs. public school enrollment:
| Here: | 0.0% |
| California: | 10.5% |
| Here: | 0.0% |
| California: | 8.5% |
| Here: | 0.0% |
| California: | 15.9% |