Gardnerville, NV (Nevada) Houses and Residents
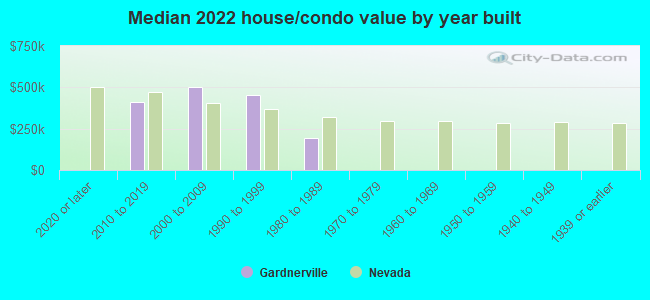
| Gardnerville: | $471,681 |
| Nevada: | $434,700 |
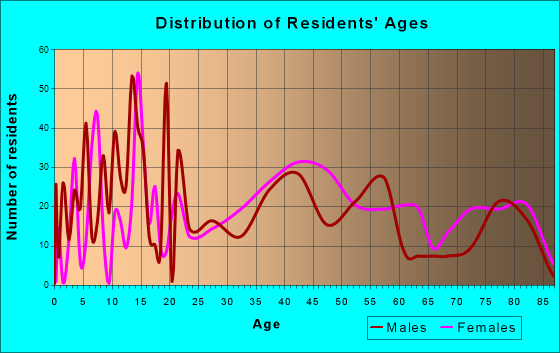
Total population: 5,656 (Urban population: 3,223 (all inside urban clusters), Rural population: 161 (all nonfarm))
Houses: 2,992 (2,880 occupied: 1,517 owner occupied, 1,358 renter occupied)
| % of renters here: | 47% |
| State: | 40% |
Housing density: 624 houses/condos per square mile
Median price asked for vacant for-sale houses and condos in 2022 in this county: $629,655.
Median contract rent in 2022: $1,272 (lower quartile is $916, upper quartile is $1,845)
Median rent asked for vacant for-rent units in 2022: $2,785
Median gross rent in Gardnerville, NV in 2022: $1,319
Housing units in Gardnerville with a mortgage: 959 (114 second mortgage, 0 home equity loan, 67 both second mortgage and home equity loan)
Houses without a mortgage: 27
Median household income for houses/condos with a mortgage: $87,009
Median household income for apartments without a mortgage: $77,651
Median monthly housing costs: $1,372
Compare current foreclosures near Gardnerville, NV:
| Photo | Address | Area | Beds / Baths | Price | Details |
|---|---|---|---|---|---|

|
#1
Acres Of Vacant Land, No Site Address, Topaz, Nv
Gardnerville, NV 89410
|
- sq. feet
|
- baths - beds |
$681
|
show details |

|
#2
Hussman Ave Apt 7a
Gardnerville, NV 89410
|
- sq. feet
|
- baths - beds |
show details | |

|
#3
Zinfandel Dr Unit A
Gardnerville, NV 89460
|
- sq. feet
|
- baths - beds |
show details | |

|
#4
Kimmerling Rd Apt B
Gardnerville, NV 89460
|
- sq. feet
|
- baths - beds |
show details | |

|
#5
Sugar Maple Ave
Gardnerville, NV 89410
|
2,082 sq. feet
|
- baths - beds |
show details | |

|
#6
Mark St
Gardnerville, NV 89410
|
1,425 sq. feet
|
- baths - beds |
show details | |

|
#7
Chardonnay Dr Unit C
Gardnerville, NV 89460
|
- sq. feet
|
- baths - beds |
show details | |

|
#8
Petar Dr
Gardnerville, NV 89410
|
1,431 sq. feet
|
- baths - beds |
show details | |

|
#9
Centerville Ln
Gardnerville, NV 89460
|
- sq. feet
|
- baths - beds |
show details | |

|
#10
Dresslerville Rd
Gardnerville, NV 89460
|
1,694 sq. feet
|
- baths - beds |
show details |
| Photo | Address | Area | Beds / Baths | Price | Details |
|---|---|---|---|---|---|

|
#11
Heybourne Rd
Gardnerville, NV 89410
|
- sq. feet
|
- baths - beds |
show details | |

|
#12
Patricia Dr
Gardnerville, NV 89460
|
- sq. feet
|
- baths - beds |
show details | |

|
#13
Crestmore Dr Apt 119
Gardnerville, NV 89410
|
- sq. feet
|
- baths - beds |
show details | |

|
#14
Glenwood Dr
Gardnerville, NV 89460
|
1,749 sq. feet
|
- baths - beds |
show details | |

|
#15
Red Cedar Ave
Gardnerville, NV 89410
|
2,082 sq. feet
|
- baths - beds |
show details | |

|
#16
Stonegate Ct
Gardnerville, NV 89410
|
- sq. feet
|
- baths - beds |
show details | |

|
#17
Peleu Way
Gardnerville, NV 89460
|
- sq. feet
|
- baths - beds |
show details | |

|
#18
W Aylesbury Ct
Gardnerville, NV 89410
|
- sq. feet
|
- baths - beds |
show details | |

|
#19
Joette Dr
Gardnerville, NV 89460
|
1,876 sq. feet
|
- baths - beds |
show details | |

|
#20
Mark St
Gardnerville, NV 89410
|
1,917 sq. feet
|
- baths - beds |
show details |
| Photo | Address | Area | Beds / Baths | Price | Details |
|---|---|---|---|---|---|

|
#21
Us Highway 395 N
Gardnerville, NV 89410
|
- sq. feet
|
- baths - beds |
show details | |

|
#22
Stodick Ln
Gardnerville, NV 89410
|
- sq. feet
|
- baths - beds |
show details | |

|
#23
Mustang Ln
Gardnerville, NV 89410
|
2,161 sq. feet
|
- baths - beds |
show details | |

|
#24
Autumn Hills Rd
Gardnerville, NV 89460
|
- sq. feet
|
- baths - beds |
show details | |

|
#25
Chip Ct
Minden, NV 89423
|
2,051 sq. feet
|
2 baths 4 beds |
show details | |

|
#26
Highlands Dr
South Lake Tahoe, CA 96150
|
- sq. feet
|
2 baths 4 beds |
show details | |

|
#27
Fallen Leaf Rd
South Lake Tahoe, CA 96150
|
2,628 sq. feet
|
2 baths 3 beds |
show details | |

|
#28
Modesto Ave
South Lake Tahoe, CA 96150
|
1,221 sq. feet
|
2 baths 3 beds |
show details | |

|
#29
Sonoma St
Carson City, NV 89701
|
2,513 sq. feet
|
2 baths 5 beds |
show details | |

|
#30
Ponderosa Dr
Carson City, NV 89701
|
1,421 sq. feet
|
2 baths 3 beds |
show details |
| Photo | Address | Area | Beds / Baths | Price | Details |
|---|---|---|---|---|---|

|
#31
Ponderosa Dr
Carson City, NV 89701
|
1,421 sq. feet
|
2 baths 3 beds |
show details | |

|
#32
Kingsley Ln
Carson City, NV 89701
|
1,176 sq. feet
|
2 baths 3 beds |
show details | |

|
#33
Koontz Ln
Carson City, NV 89701
|
1,809 sq. feet
|
2 baths 3 beds |
show details | |

|
#34
Village Dr
Carson City, NV 89701
|
2,256 sq. feet
|
3 baths 6 beds |
show details | |

|
#35
Maple Creek Ln
Carson City, NV 89701
|
1,768 sq. feet
|
2 baths 4 beds |
show details | |

|
#36
Sitka Cir
South Lake Tahoe, CA 96150
|
1,258 sq. feet
|
2 baths 3 beds |
show details | |

|
#37
Cornelian Dr
South Lake Tahoe, CA 96150
|
1,092 sq. feet
|
1 baths 3 beds |
show details | |

|
#38
Beecher Ave
South Lake Tahoe, CA 96150
|
1,594 sq. feet
|
2 baths 3 beds |
show details | |

|
#39
Molly Dr
Carson City, NV 89706
|
870 sq. feet
|
1 baths 2 beds |
show details | |

|
#40
Tamarisk St
Carson City, NV 89701
|
1,080 sq. feet
|
2 baths 3 beds |
show details |
| Photo | Address | Area | Beds / Baths | Price | Details |
|---|---|---|---|---|---|

|
#41
Merced Ave
South Lake Tahoe, CA 96150
|
2,284 sq. feet
|
3 baths 4 beds |
show details | |

|
#42
Knox Ave
South Lake Tahoe, CA 96150
|
1,744 sq. feet
|
2 baths 4 beds |
show details | |

|
#43
Dana Ct
South Lake Tahoe, CA 96150
|
1,556 sq. feet
|
2 baths 3 beds |
show details | |

|
#44
Conte Dr
Carson City, NV 89701
|
1,923 sq. feet
|
2 baths 4 beds |
show details | |

|
#45
Rancho Way
South Lake Tahoe, CA 96150
|
1,440 sq. feet
|
2 baths 3 beds |
show details | |

|
#46
Ralph Dr
South Lake Tahoe, CA 96150
|
1,014 sq. feet
|
1 baths 3 beds |
show details | |

|
#47
Ralph Dr
South Lake Tahoe, CA 96150
|
1,014 sq. feet
|
1 baths 3 beds |
show details | |

|
#48
Colorado St
Carson City, NV 89701
|
2,236 sq. feet
|
3 baths 4 beds |
show details | |

|
#49
Royal Ave
South Lake Tahoe, CA 96150
|
1,647 sq. feet
|
2 baths 2 beds |
show details | |

|
Check over 1 million property listings on Foreclosure.com!
|
browse all offers | |||

Latest news about housing in Gardnerville, NV collected exclusively by city-data.com from local newspapers, TV, and radio stations

 | homes for sale in area of Ponderosa Pines in Carson city (6 replies) |
| Northwest Bound! (239 replies) |
| Carson City/Gardnerville-Minden-Genoa/Dayton Real Estate Report by area (20 replies) |
| Thinking About South Las Vegas (194 replies) |
| Move To Carson City? (95 replies) |
| Carson City and Henderson-Top Retirement Cities? (195 replies) |
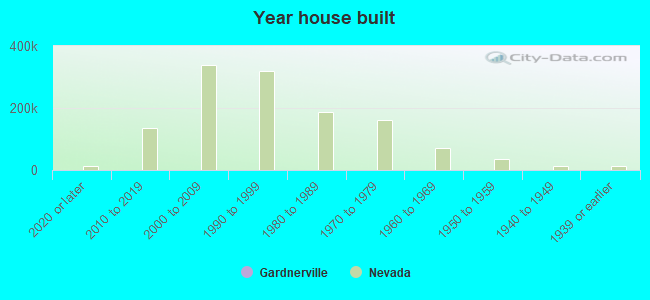
Median year apartment built: 2000
Household type by relationship:
Households: 6,291- Male householders: 1,578 (443 living alone), Female householders: 1,280 (615 living alone)
1,226 spouses (1,197 opposite-sex spouses), 159 unmarried partners, (159 opposite-sex unmarried partners), 1,301 children (1,151 natural, 118 adopted, 31 stepchildren), 107 grandchildren, 30 brothers or sisters, 168 parents, 0 foster children, 222 other relatives, 72 non-relatives
- In group quarters: 143
Size of family households: 707 2-persons, 443 3-persons, 286 4-persons, 154 5-persons, 33 6-persons, 6 7-or-more-persons.
Size of nonfamily households: 1,049 1-person, 191 2-persons.
583 married couples with children.
149 single-parent households (141 men, 8 women).
80.6% of residents of Gardnerville speak English at home.
15.9% of residents speak Spanish at home (78% speak English very well, 5% speak English well, 18% speak English not well).
3.0% of residents speak other Indo-European language at home (83% speak English very well, 17% speak English well).
0.6% of residents speak Asian or Pacific Island language at home (100% speak English well).
Foreign born population: 788 (12.5%)
(50.8% of them are naturalized citizens)
| Here: | 5.7 |
| State: | 6.0 |
| Here: | 4.3 |
| State: | 4.2 |
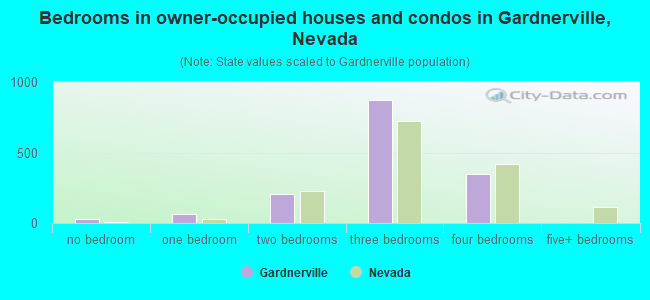
- Bedrooms in owner-occupied houses and condos in Gardnerville, Nevada
- 28no bedroom
- 611 bedroom
- 2072 bedrooms
- 8723 bedrooms
- 3504 bedrooms
- 05+ bedrooms
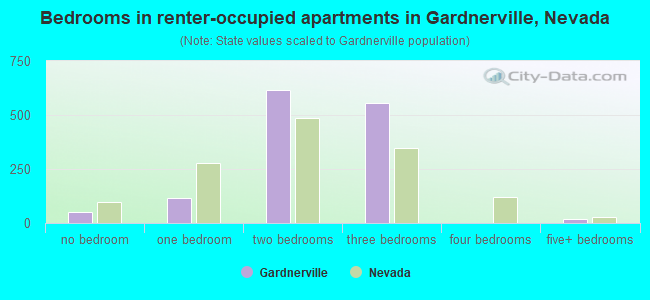
- Bedrooms in renter-occupied apartments in Gardnerville, Nevada
- 53no bedroom
- 1151 bedroom
- 6182 bedrooms
- 5543 bedrooms
- 04 bedrooms
- 195+ bedrooms
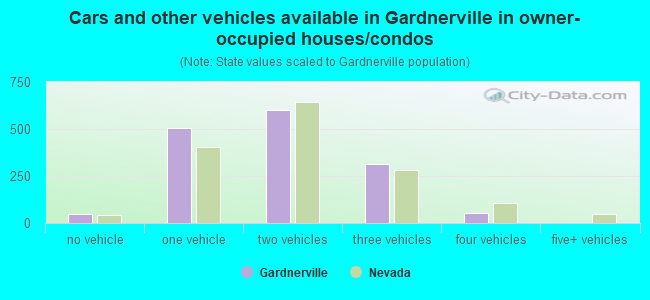
- Cars and other vehicles available in Gardnerville in owner-occupied houses/condos
- 48no vehicle
- 5051 vehicle
- 6002 vehicles
- 3133 vehicles
- 514 vehicles
- 05+ vehicles
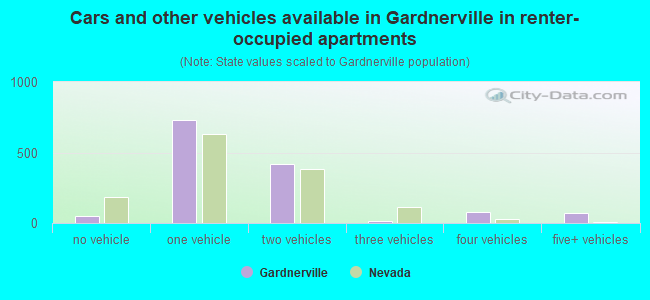
- Cars and other vehicles available in Gardnerville in renter-occupied apartments
- 47no vehicle
- 7291 vehicle
- 4182 vehicles
- 143 vehicles
- 794 vehicles
- 705+ vehicles
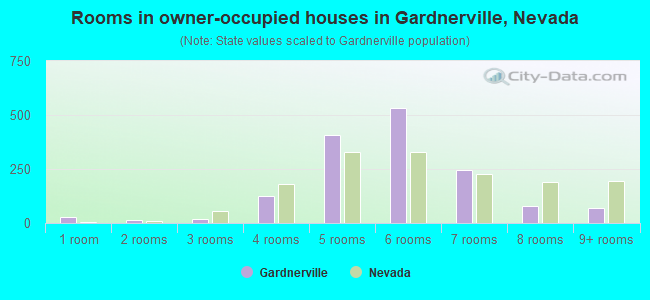
- Rooms in owner-occupied houses in Gardnerville, Nevada
- 281 room
- 122 rooms
- 203 rooms
- 1234 rooms
- 4075 rooms
- 5346 rooms
- 2447 rooms
- 818 rooms
- 699+ rooms
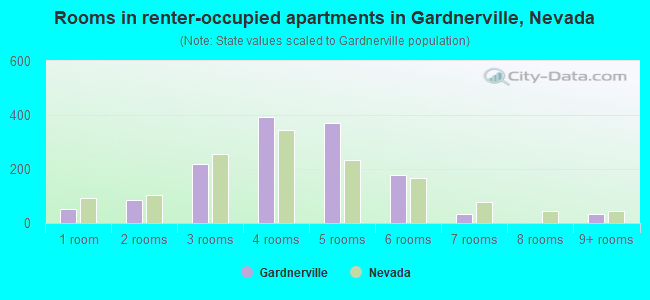
- Rooms in renter-occupied apartments in Gardnerville, Nevada
- 531 room
- 842 rooms
- 2193 rooms
- 3914 rooms
- 3695 rooms
- 1766 rooms
- 327 rooms
- 08 rooms
- 349+ rooms
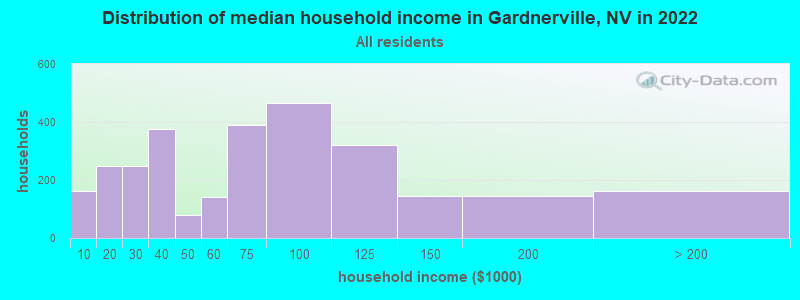
Gardnerville, NV household income distribution

- 161Less than $10,000
- 248$10,000 to $19,999
- 250$20,000 to $29,999
- 376$30,000 to $39,999
- 80$40,000 to $49,999
- 140$50,000 to $59,999
- 388$60,000 to $74,999
- 465$75,000 to $99,999
- 322$100,000 to $124,999
- 146$125,000 to $149,999
- 144$150,000 to $199,999
- 163$200,000 or more
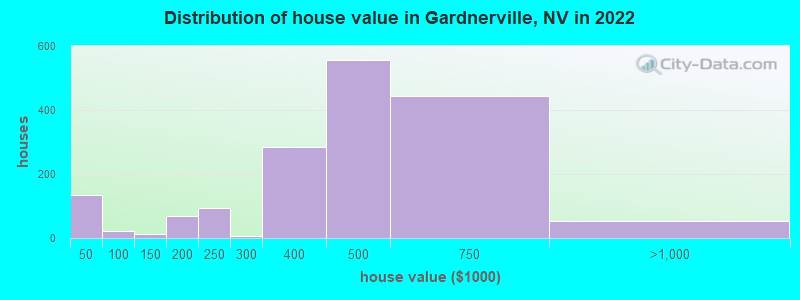
Home value of owner - occupied houses in 2022 in Gardnerville, NV
-
- 41Less than $10,000
- 8$10,000 to $14,999
- 39$20,000 to $24,999
- 23$35,000 to $39,999
- 22$40,000 to $49,999
- 12$100,000 to $124,999
- 52$150,000 to $174,999
- 15$175,000 to $199,999
- 93$200,000 to $249,999
- 6$250,000 to $299,999
- 283$300,000 to $399,999
- 557$400,000 to $499,999
- 444$500,000 to $749,999
- 53$750,000 to $999,999
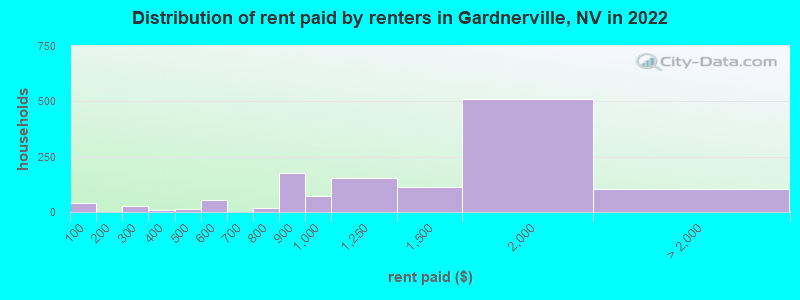
Rent paid by renters in 2022 in Gardnerville, NV
-
- 38Less than $100
- 17$200 to $249
- 10$250 to $299
- 10$300 to $349
- 14$450 to $499
- 23$500 to $549
- 31$550 to $599
- 15$700 to $749
- 176$800 to $899
- 71$900 to $999
- 154$1,000 to $1,249
- 112$1,250 to $1,499
- 512$1,500 to $1,999
- 42$2,000 to $2,499
- 59No cash rent
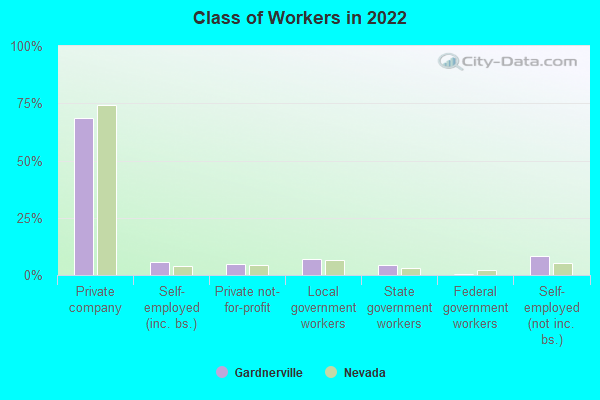
Percentage of workers working in this county: 74.4%
Number of people working at home: 268 (8.9% of all workers)
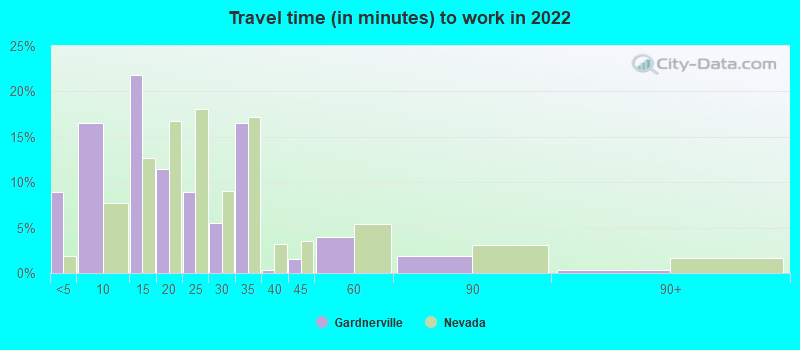
Travel time to work (commute)
- Less than 5 minutes: 287
- 5 to 9 minutes: 481
- 10 to 14 minutes: 627
- 15 to 19 minutes: 261
- 20 to 24 minutes: 127
- 25 to 29 minutes: 185
- 30 to 34 minutes: 359
- 35 to 39 minutes: 0
- 40 to 44 minutes: 34
- 45 to 59 minutes: 208
- 60 to 89 minutes: 46
- 90 or more minutes: 25
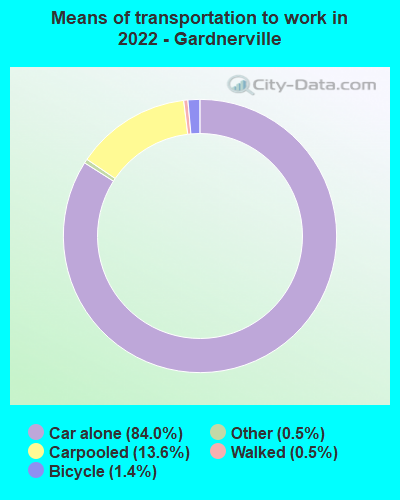
Means of transportation to work:
- Drove a car alone: 3,062 (75.9%)
- Carpooled: 547 (13.6%)
- Taxi: 20 (0.5%)
- Bicycle: 64 (1.6%)
- Walked: 19 (0.5%)
- Worked at home: 268 (6.6%)
- Unemployment by race in 2022
- Unemployment rate for White non-Hispanic residents
- 1.4%Males
- 9.0%Females
- Unemployment rate for Hispanic or Latino residents
- 5.2%Females
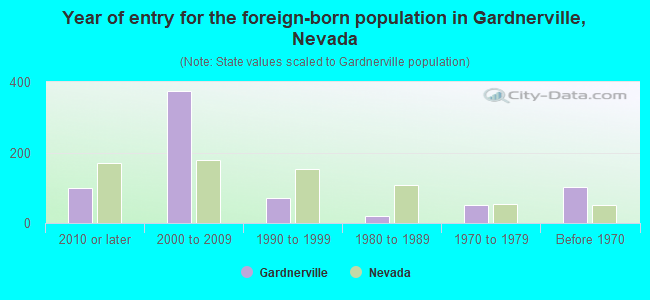
- Year of entry for the foreign-born population in Gardnerville, Nevada
- 992010 or later
- 3752000 to 2009
- 711990 to 1999
- 191980 to 1989
- 511970 to 1979
- 101Before 1970
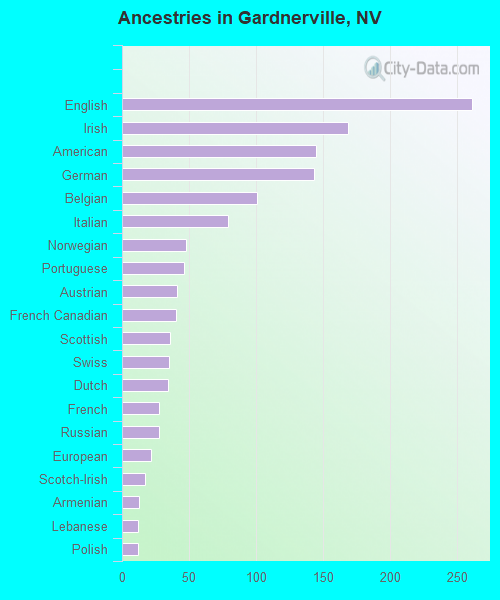
First ancestries reported:
- English: 261 (10.0%)
- Irish: 169 (6.5%)
- American: 145 (5.5%)
- German: 143 (5.5%)
- Belgian: 101 (3.9%)
- Italian: 79 (3.0%)
- Norwegian: 48 (1.8%)
- Portuguese: 46 (1.8%)
- Austrian: 41 (1.6%)
- French Canadian: 40 (1.5%)
- Scottish: 36 (1.4%)
- Swiss: 35 (1.3%)
- Dutch: 34 (1.3%)
- French: 28 (1.1%)
- Russian: 28 (1.1%)
- European: 22 (0.8%)
- Scotch-Irish: 17 (0.6%)
- Armenian: 13 (0.5%)
- Lebanese: 12 (0.5%)
- Polish: 12 (0.5%)
Most common places of birth for foreign-born residents (%):
| Gardnerville: | 49.0% (386) |
| Nevada: | 36.8% (218,248) |
| Gardnerville: | 7.6% (60) |
| Nevada: | 1.9% (11,407) |
| Gardnerville: | 6.7% (53) |
| Nevada: | 0.9% (5,149) |
| Gardnerville: | 6.5% (51) |
| Nevada: | 0.1% (763) |
| Gardnerville: | 5.6% (44) |
| Nevada: | 0.2% (1,323) |
| Gardnerville: | 4.6% (36) |
| Nevada: | 2.0% (11,718) |
| Gardnerville: | 4.4% (35) |
| Nevada: | 0.9% (5,045) |
| Gardnerville: | 2.9% (23) |
| Nevada: | 1.1% (6,392) |
| Gardnerville: | 1.9% (15) |
| Nevada: | 0.3% (1,951) |
| Gardnerville: | 1.9% (15) |
| Nevada: | 0.2% (946) |
| Gardnerville: | 1.6% (13) |
| Nevada: | 0.0% (75) |
Place of birth for U.S.-born residents:
- This state: 1,035
- Other state: 4,376
- Northeast: 275
- Midwest: 508
- South: 723
- West: 2,888
86.4% of Gardnerville residents lived in the same house 1 years ago.
Out of people who lived in different houses, 21.2% lived in this county.
Out of people who lived in different counties, 36.0% lived in Nevada.
| Gardnerville: | 86.4% |
| State average: | 86.4% |
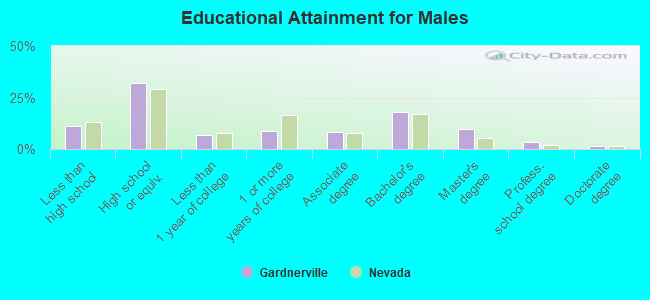
Education attainment for males 25 years and older:
- No schooling: 0
- Nursery to 4th grade: 0
- 5th and 6th grade: 149
- 7th and 8th grade: 13
- 9th grade: 0
- 10th grade: 0
- 11th grade: 23
- 12th grade, no diploma: 109
- High school graduate (or equivalency): 836
- Less than 1 year of college: 180
- Some college more than 1 year, no degree: 228
- Associate degree: 218
- Bachelor's degree: 471
- Master's degree: 250
- Professional school degree: 87
- Doctorate degree: 43
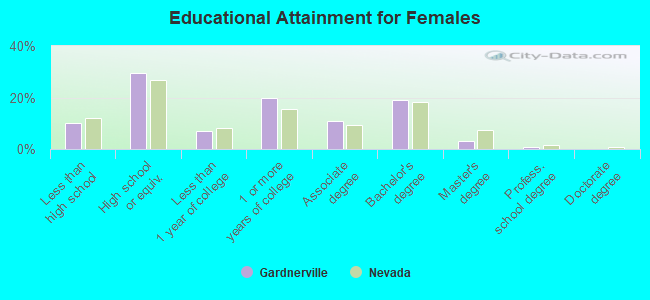
Education attainment for females 25 years and older:
- No schooling: 16
- Nursery to 4th grade: 0
- 5th and 6th grade: 0
- 7th and 8th grade: 0
- 9th grade: 173
- 10th grade: 16
- 11th grade: 30
- 12th grade, no diploma: 15
- High school graduate (or equivalency): 733
- Less than 1 year of college: 173
- Some college more than 1 year, no degree: 485
- Associate degree: 266
- Bachelor's degree: 472
- Master's degree: 76
- Professional school degree: 15
- Doctorate degree: 0
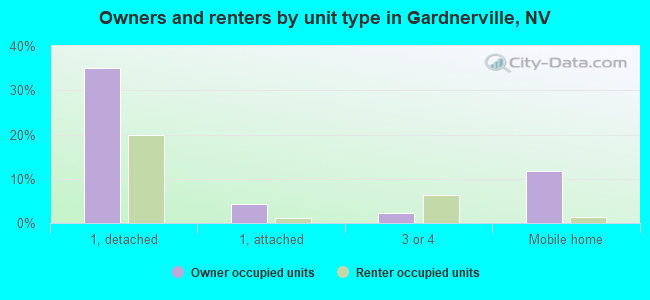
Housing units in structures:
- One, detached: 1,603
- One, attached: 141
- Two: 167
- 3 or 4: 318
- 5 to 9: 155
- 10 to 19: 103
- 20 to 49: 43
- 50 or more: 63
- Mobile homes: 367
- Boats, RVs, vans, etc.: 27
Median worth of mobile homes: $195,194
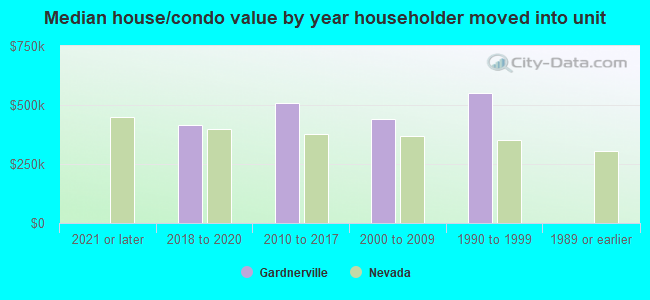
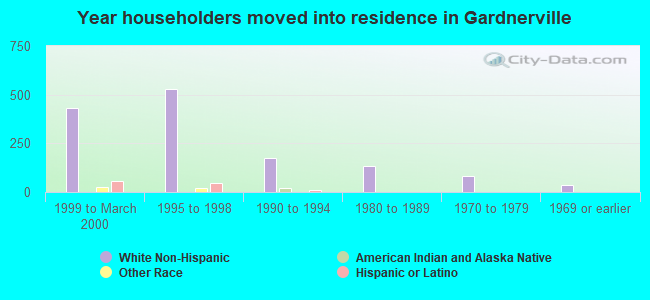
House/condo owner moved in on average 6 years ago
Renter moved in on average 4 years ago
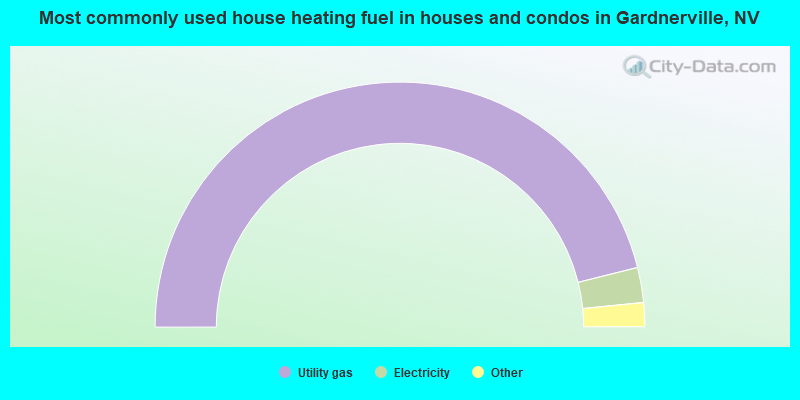
- 92.3%Utility gas
- 4.6%Electricity
- 1.8%Other fuel
- 1.3%Bottled, tank, or LP gas
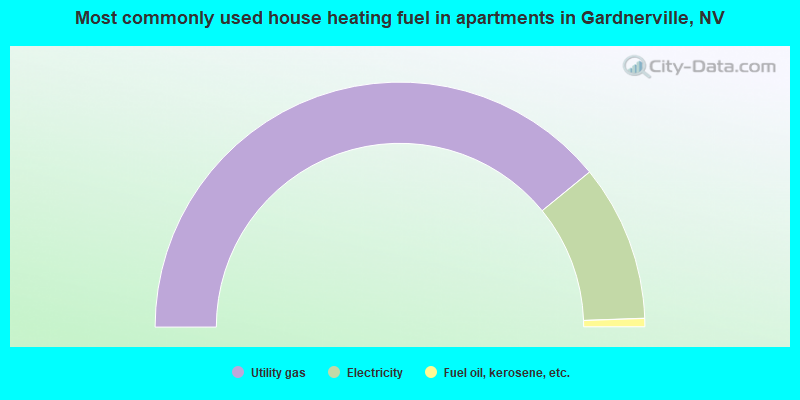
- 78.2%Utility gas
- 20.7%Electricity
- 1.1%Fuel oil, kerosene, etc.
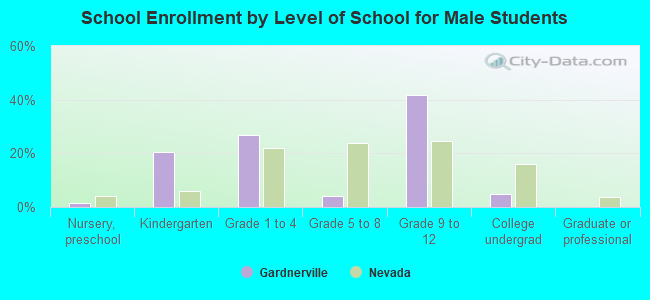
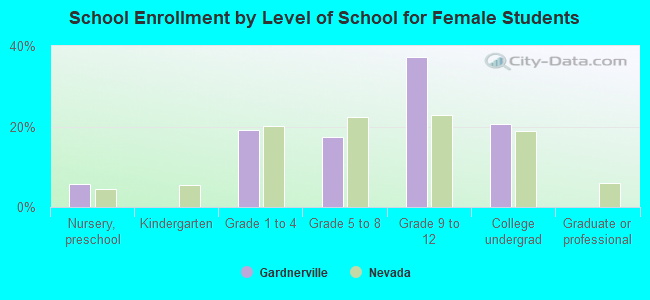
Private vs. public school enrollment:
| Here: | 2.9% |
| Nevada: | 12.9% |
| Here: | 0.0% |
| Nevada: | 6.9% |
| Here: | 6.7% |
| Nevada: | 16.0% |