Gilford, NH (New Hampshire) Houses and Residents
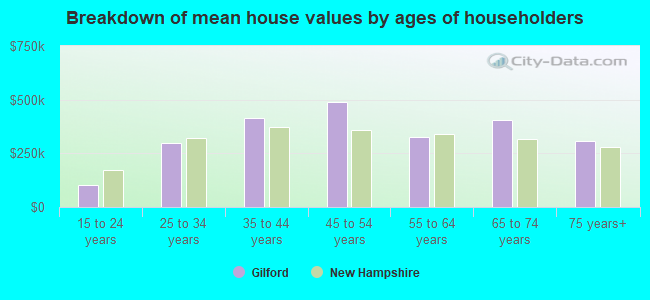
| Gilford: | $401,586 |
| New Hampshire: | $384,700 |
Total population: 7,126 (Urban population: 3,958 (all inside urban clusters), Rural population: 2,845 (all nonfarm))
Houses: 4,312 (2,766 occupied: 2,385 owner occupied, 381 renter occupied)
| % of renters here: | 14% |
| State: | 28% |
Housing density: 111 houses/condos per square mile
Median price asked for vacant for-sale houses and condos in 2022 in this county: $93,849.
Median contract rent in 2022: $1,258 (lower quartile is $966, upper quartile is $1,633)
Median rent asked for vacant for-rent units in 2022: $1,336
Median gross rent in Gilford, NH in 2022: $1,487
Housing units in Gilford with a mortgage: 1,145 (71 second mortgage, 172 home equity loan, 0 both second mortgage and home equity loan)
Houses without a mortgage: 607
Compare current foreclosures near Gilford, NH:
| Photo | Address | Area | Beds / Baths | Price | Details |
|---|---|---|---|---|---|

|
#1
Sand Hill Rd
Gilford, NH 03249
|
- sq. feet
|
- baths - beds |
show details | |

|
#2
Annis Dr Unit 10
Gilford, NH 03249
|
- sq. feet
|
- baths - beds |
show details | |

|
#3
Cheshire Cir
Gilford, NH 03249
|
- sq. feet
|
- baths - beds |
show details | |

|
#4
Kimball Rd
Gilford, NH 03249
|
- sq. feet
|
- baths - beds |
show details | |

|
#5
Kimball Rd
Gilford, NH 03249
|
- sq. feet
|
- baths - beds |
show details | |

|
#6
N Main St
Wolfeboro, NH 03894
|
1,598 sq. feet
|
2 baths 2 beds |
show details | |

|
#7
Taylor Rd
Sanbornton, NH 03269
|
2,446 sq. feet
|
2 baths 4 beds |
show details | |

|
#8
Summit View Dr
Moultonborough, NH 03254
|
840 sq. feet
|
2 baths 3 beds |
show details | |

|
#9
Shaw Hill Rd
Sanbornton, NH 03269
|
1,976 sq. feet
|
1 baths 3 beds |
show details | |

|
#10
Brook Rd # 2
Sanbornton, NH 03269
|
2,128 sq. feet
|
2 baths 4 beds |
show details |
| Photo | Address | Area | Beds / Baths | Price | Details |
|---|---|---|---|---|---|

|
#11
Frank C Gilman Hwy
Alton, NH 03809
|
1,712 sq. feet
|
1 baths 3 beds |
show details | |

|
#12
Drake Rd
Sanbornton, NH 03269
|
2,376 sq. feet
|
2 baths 3 beds |
show details | |

|
#13
Governor Wentworth Hwy
Moultonborough, NH 03254
|
1,510 sq. feet
|
1 baths 3 beds |
show details | |

|
#14
Plymouth St
Meredith, NH 03253
|
2,232 sq. feet
|
2 baths 4 beds |
show details | |

|
#15
Pleasant St
Meredith, NH 03253
|
3,096 sq. feet
|
2 baths 4 beds |
show details | |

|
#16
Eastman Hill Rd
Sanbornton, NH 03269
|
4,836 sq. feet
|
2 baths 4 beds |
show details | |

|
#17
Mechanic St
Laconia, NH 03246
|
2,537 sq. feet
|
2 baths 4 beds |
show details | |

|
#18
Strafford St
Laconia, NH 03246
|
1,820 sq. feet
|
2 baths 4 beds |
show details | |

|
#19
Adams St
Laconia, NH 03246
|
1,956 sq. feet
|
1 baths 3 beds |
show details | |

|
#20
Province St
Laconia, NH 03246
|
818 sq. feet
|
1 baths 2 beds |
show details |
| Photo | Address | Area | Beds / Baths | Price | Details |
|---|---|---|---|---|---|

|
#21
Union Ave
Laconia, NH 03246
|
6,055 sq. feet
|
2 baths - beds |
show details | |

|
#22
Durkee St # B
Laconia, NH 03246
|
- sq. feet
|
- baths - beds |
show details | |

|
#23
Endicott St N Unit 420
Laconia, NH 03246
|
- sq. feet
|
- baths - beds |
show details | |

|
#24
Scribner Rd # 78
Tilton, NH 03276
|
- sq. feet
|
- baths - beds |
show details | |

|
#25
Winona Rd
New Hampton, NH 03256
|
- sq. feet
|
- baths - beds |
show details | |

|
#26
Prospect St Apt 2
Tilton, NH 03276
|
- sq. feet
|
- baths - beds |
show details | |

|
#27
Merrimac St # 1
Laconia, NH 03246
|
- sq. feet
|
- baths - beds |
show details | |

|
#28
Bay Hill Rd # 1
Tilton, NH 03276
|
- sq. feet
|
- baths - beds |
show details | |

|
#29
River St Apt 1k
Franklin, NH 03235
|
- sq. feet
|
- baths - beds |
show details | |

|
#30
Friar Tuck Rd
Canterbury, NH 03224
|
- sq. feet
|
- baths - beds |
show details |
| Photo | Address | Area | Beds / Baths | Price | Details |
|---|---|---|---|---|---|

|
#31
Lynnewood Rd
Laconia, NH 03246
|
- sq. feet
|
- baths - beds |
show details | |

|
#32
Wethersfield Dr
Tilton, NH 03276
|
- sq. feet
|
- baths - beds |
show details | |

|
#33
Central St
Franklin, NH 03235
|
- sq. feet
|
- baths - beds |
show details | |

|
#34
Arianna Dr
Alton, NH 03809
|
- sq. feet
|
- baths - beds |
show details | |

|
#35
Clark St
Belmont, NH 03220
|
960 sq. feet
|
- baths - beds |
show details | |

|
#36
Horne Rd
Belmont, NH 03220
|
1,491 sq. feet
|
- baths - beds |
show details | |

|
#37
Academy St Apt 3
Laconia, NH 03246
|
- sq. feet
|
- baths - beds |
show details | |

|
#38
Estates Cir Apt 24
Laconia, NH 03246
|
- sq. feet
|
- baths - beds |
show details | |

|
#39
Waumbeck Rd
Wolfeboro, NH 03894
|
- sq. feet
|
- baths - beds |
show details | |

|
#40
Hurricane Rd
Belmont, NH 03220
|
1,280 sq. feet
|
- baths - beds |
show details |
| Photo | Address | Area | Beds / Baths | Price | Details |
|---|---|---|---|---|---|

|
#41
Benjamin Dr
Ossipee, NH 03864
|
- sq. feet
|
- baths - beds |
show details | |

|
#42
Leisure Ln
Belmont, NH 03220
|
- sq. feet
|
- baths - beds |
show details | |

|
#43
Karen Dr
Belmont, NH 03220
|
1,920 sq. feet
|
- baths - beds |
show details | |

|
#44
Union Rd
Belmont, NH 03220
|
1,104 sq. feet
|
- baths - beds |
show details | |

|
#45
N Main St Apt 33
Laconia, NH 03246
|
- sq. feet
|
- baths - beds |
show details | |

|
#46
Landing Ln # 131
Laconia, NH 03246
|
- sq. feet
|
- baths - beds |
show details | |

|
#47
Pine Grove Rd
Belmont, NH 03220
|
1,188 sq. feet
|
- baths - beds |
show details | |

|
#48
Center St
Wolfeboro, NH 03894
|
- sq. feet
|
- baths - beds |
show details | |

|
#49
Hill Rd
Franklin, NH 03235
|
- sq. feet
|
- baths - beds |
show details | |

|
Check over 1 million property listings on Foreclosure.com!
|
browse all offers | |||
Latest news about housing in Gilford, NH collected exclusively by city-data.com from local newspapers, TV, and radio stations

 | Whats up with NH houses? (117 replies) |
| Move to NH - Suggested Areas & Towns? (108 replies) |
| What's it like to live in or near Plymouth? (6 replies) |
| Harmony Montgomery case (44 replies) |
| Drugs in Laconia & Gilford (14 replies) |
| Lake living for retirees (17 replies) |

Household type by relationship:
Households: 59,230- In family households: 48,885 (11,375 male householders, 5,234 female householders)
12,991 spouses, 15,131 children (13,859 natural, 380 adopted, 892 stepchildren), 967 grandchildren, 328 brothers or sisters, 471 parents, foster children, 404 other relatives, 1,667 non-relatives
- In nonfamily households: 10,345 (3,846 male householders (2,885 living alone)), 4,311 female householders (3,475 living alone)), 2,188 nonrelatives
- In group quarters: 858 (719 institutionalized population)
9,297 married couples with children.
3,111 single-parent households (871 men, 2,240 women).
93.7% of residents of Gilford speak English at home.
0.7% of residents speak Spanish at home (34% speak English very well, 11% speak English well, 55% speak English not well).
5.1% of residents speak other Indo-European language at home (60% speak English very well, 28% speak English well, 12% speak English not well).
0.5% of residents speak Asian or Pacific Island language at home (50% speak English very well, 50% speak English well).
Foreign born population: 246 (3.2%)
(111.0% of them are naturalized citizens)
| Here: | 6.3 |
| State: | 6.4 |
| Here: | 4.0 |
| State: | 4.0 |
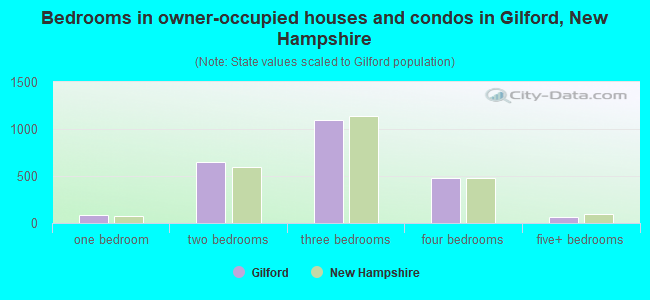
- Bedrooms in owner-occupied houses and condos in Gilford, New Hampshire
- 0no bedroom
- 861 bedroom
- 6482 bedrooms
- 1,0983 bedrooms
- 4844 bedrooms
- 695+ bedrooms
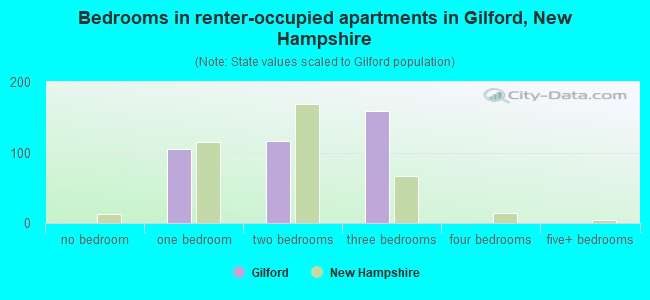
- Bedrooms in renter-occupied apartments in Gilford, New Hampshire
- 0no bedroom
- 1051 bedroom
- 1172 bedrooms
- 1593 bedrooms
- 04 bedrooms
- 05+ bedrooms
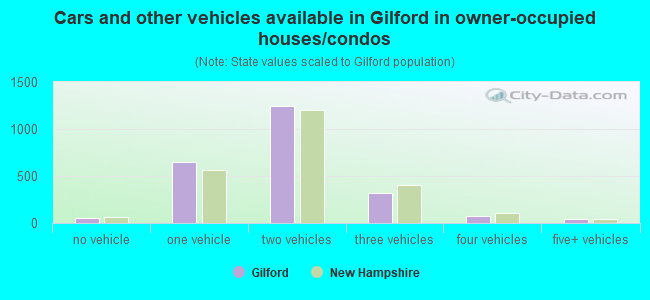
- Cars and other vehicles available in Gilford in owner-occupied houses/condos
- 49no vehicle
- 6531 vehicle
- 1,2402 vehicles
- 3203 vehicles
- 794 vehicles
- 445+ vehicles
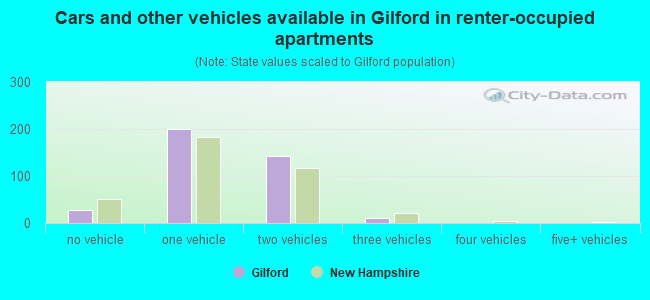
- Cars and other vehicles available in Gilford in renter-occupied apartments
- 27no vehicle
- 2011 vehicle
- 1422 vehicles
- 113 vehicles
- 04 vehicles
- 05+ vehicles
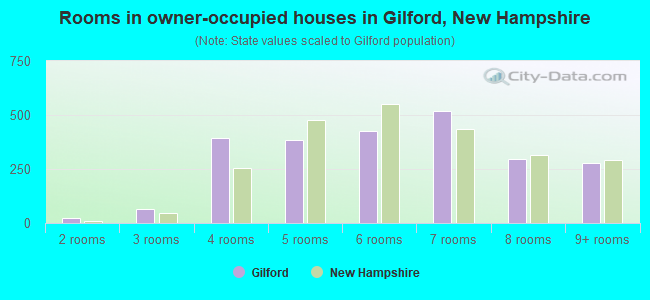
- Rooms in owner-occupied houses in Gilford, New Hampshire
- 01 room
- 222 rooms
- 653 rooms
- 3924 rooms
- 3835 rooms
- 4286 rooms
- 5177 rooms
- 2988 rooms
- 2809+ rooms
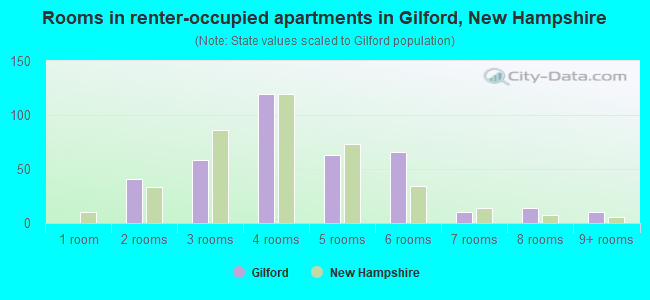
- Rooms in renter-occupied apartments in Gilford, New Hampshire
- 01 room
- 412 rooms
- 583 rooms
- 1194 rooms
- 635 rooms
- 666 rooms
- 107 rooms
- 148 rooms
- 109+ rooms
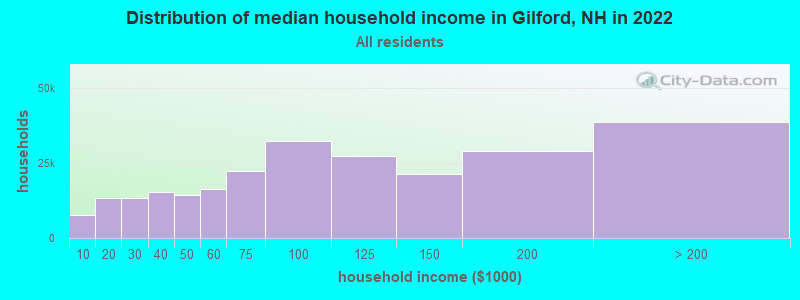
Gilford, NH household income distribution

- 9,298Less than $10,000
- 15,968$10,000 to $19,999
- 16,521$20,000 to $29,999
- 16,877$30,000 to $39,999
- 17,546$40,000 to $49,999
- 20,928$50,000 to $59,999
- 26,862$60,000 to $74,999
- 38,821$75,000 to $99,999
- 29,978$100,000 to $124,999
- 22,586$125,000 to $149,999
- 33,613$150,000 to $199,999
- 42,860$200,000 or more
Percentage of workers working in this county: 81.7%
Number of people working at home: 656 (17.2% of all workers)
Travel time to work (commute)
- Less than 5 minutes: 106
- 5 to 9 minutes: 456
- 10 to 14 minutes: 787
- 15 to 19 minutes: 628
- 20 to 24 minutes: 344
- 25 to 29 minutes: 81
- 30 to 34 minutes: 133
- 35 to 39 minutes: 38
- 40 to 44 minutes: 85
- 45 to 59 minutes: 239
- 60 to 89 minutes: 135
- 90 or more minutes: 134
Means of transportation to work:
- Drove a car alone: 2,875 (87.3%)
- Carpooled: 216 (6.6%)
- Bus or trolley bus: 8 (0.2%)
- Walked: 58 (1.8%)
- Other means: 9 (0.3%)
- Worked at home: 129 (3.9%)
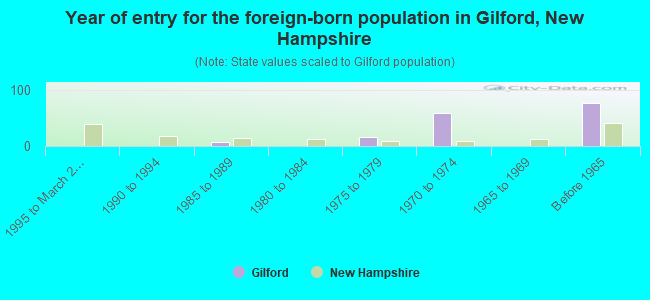
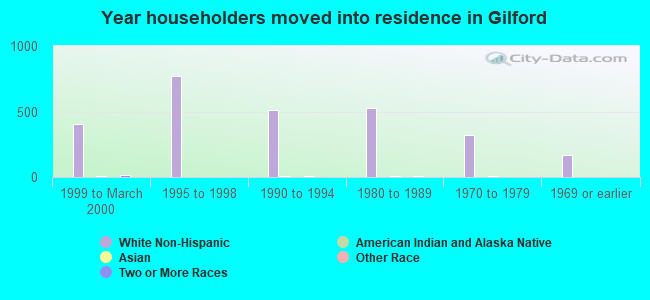
- Year of entry for the foreign-born population in Gilford, New Hampshire
- 01995 to March 2000
- 01990 to 1994
- 71985 to 1989
- 01980 to 1984
- 161975 to 1979
- 581970 to 1974
- 01965 to 1969
- 76Before 1965
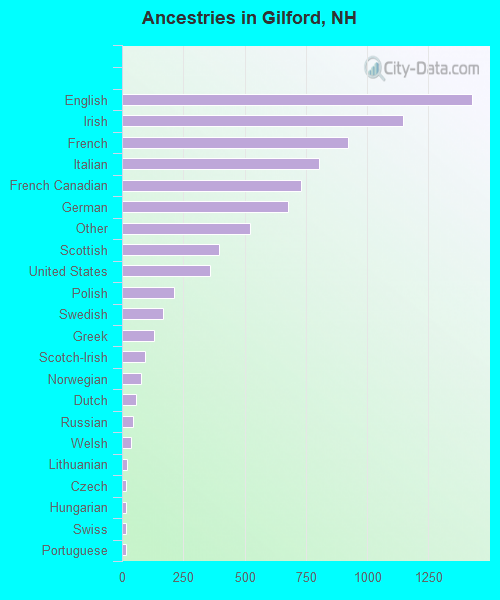
First ancestries reported:
- English: 1,426 (18.0%)
- Irish: 1,146 (14.5%)
- French: 921 (11.7%)
- Italian: 805 (10.2%)
- French Canadian: 732 (9.3%)
- German: 678 (8.6%)
- Other: 522 (6.6%)
- Scottish: 397 (5.0%)
- United States: 357 (4.5%)
- Polish: 212 (2.7%)
- Swedish: 168 (2.1%)
- Greek: 131 (1.7%)
- Scotch-Irish: 92 (1.2%)
- Norwegian: 79 (1.0%)
- Dutch: 58 (0.7%)
- Russian: 46 (0.6%)
- Welsh: 35 (0.4%)
- Lithuanian: 20 (0.3%)
- Czech: 18 (0.2%)
- Hungarian: 17 (0.2%)
- Swiss: 16 (0.2%)
- Portuguese: 15 (0.2%)
- Danish: 11 (0.1%)
Most common places of birth for foreign-born residents (%):
| Gilford: | 19.7% (31) |
| New Hampshire: | 8.1% (4,396) |
| Gilford: | 15.3% (24) |
| New Hampshire: | 4.9% (2,670) |
| Gilford: | 10.8% (17) |
| New Hampshire: | 4.7% (2,530) |
| Gilford: | 10.2% (16) |
| New Hampshire: | 1.5% (837) |
| Gilford: | 9.6% (15) |
| New Hampshire: | 2.7% (1,440) |
| Gilford: | 8.3% (13) |
| New Hampshire: | 2.3% (1,261) |
| Gilford: | 8.3% (13) |
| New Hampshire: | 22.9% (12,397) |
| Gilford: | 7.6% (12) |
| New Hampshire: | 1.5% (813) |
| Gilford: | 5.7% (9) |
| New Hampshire: | 1.9% (1,031) |
| Gilford: | 4.5% (7) |
| New Hampshire: | 1.5% (786) |
Place of birth for U.S.-born residents:
- This state: 3,024
- Other state: 3,593
- Northeast: 2,946
- Midwest: 230
- South: 282
- West: 135
59% of Gilford residents lived in the same house 5 years ago.
Out of people who lived in different houses, 50% lived in this county.
Out of people who lived in different counties, 34% lived in New Hampshire.
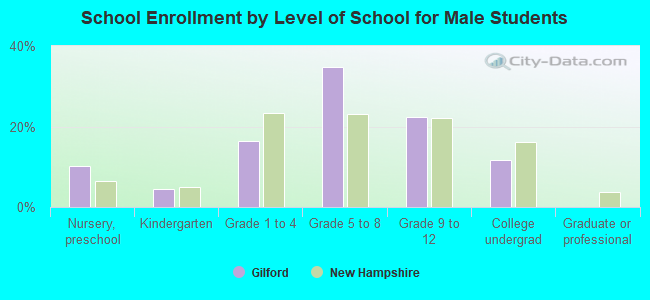
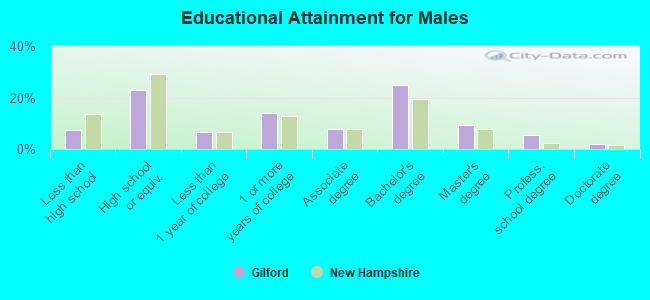
Education attainment for males 25 years and older:
- No schooling: 0
- Nursery to 4th grade: 9
- 5th and 6th grade: 0
- 7th and 8th grade: 45
- 9th grade: 8
- 10th grade: 13
- 11th grade: 62
- 12th grade, no diploma: 41
- High school graduate (or equivalency): 548
- Less than 1 year of college: 158
- Some college more than 1 year, no degree: 336
- Associate degree: 188
- Bachelor's degree: 596
- Master's degree: 220
- Professional school degree: 135
- Doctorate degree: 49
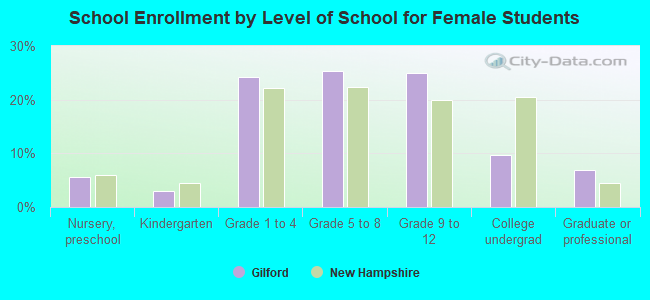
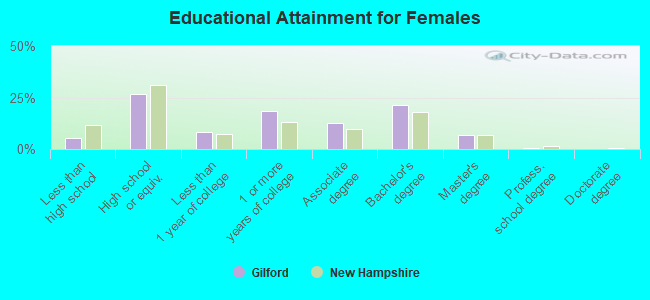
Education attainment for females 25 years and older:
- No schooling: 0
- Nursery to 4th grade: 0
- 5th and 6th grade: 8
- 7th and 8th grade: 13
- 9th grade: 8
- 10th grade: 23
- 11th grade: 33
- 12th grade, no diploma: 50
- High school graduate (or equivalency): 691
- Less than 1 year of college: 218
- Some college more than 1 year, no degree: 475
- Associate degree: 326
- Bachelor's degree: 550
- Master's degree: 175
- Professional school degree: 16
- Doctorate degree: 0
Housing units in structures:
- One, detached: 3,200
- One, attached: 90
- Two: 82
- 3 or 4: 167
- 5 to 9: 95
- 10 to 19: 17
- 20 to 49: 70
- 50 or more: 10
- Mobile homes: 581
Median worth of mobile homes: $63,085
Housing units lacking complete kitchen facilities: 0.6%
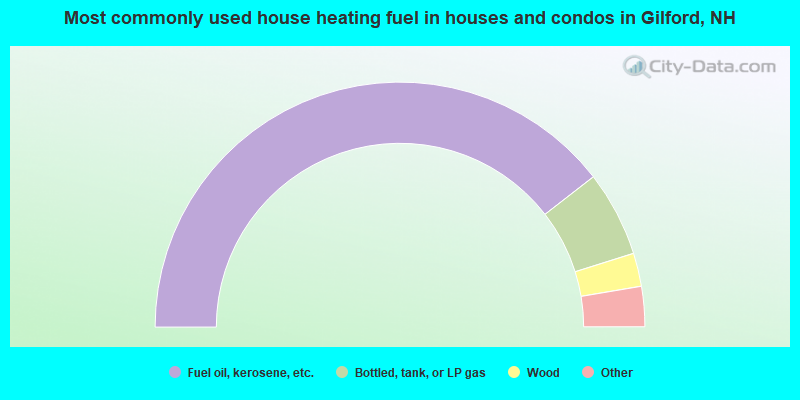
- 79.0%Fuel oil, kerosene, etc.
- 11.3%Bottled, tank, or LP gas
- 4.4%Wood
- 3.1%Electricity
- 1.1%Coal or coke
- 1.0%Utility gas
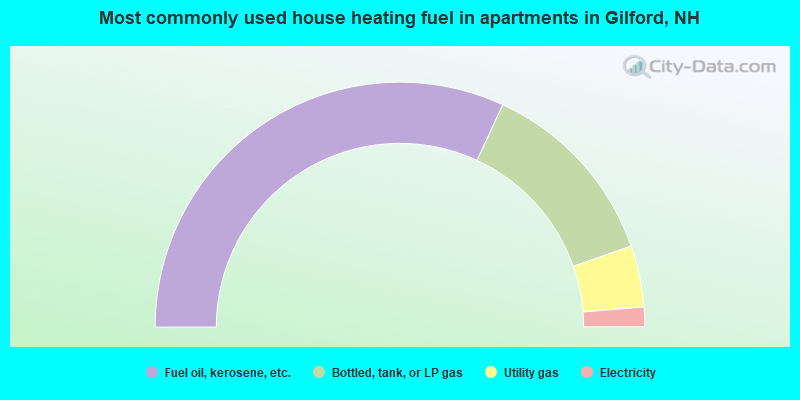
- 63.8%Fuel oil, kerosene, etc.
- 25.5%Bottled, tank, or LP gas
- 8.1%Utility gas
- 2.6%Electricity
Private vs. public school enrollment:
| Here: | 5.5% |
| New Hampshire: | 8.9% |
| Here: | 7.5% |
| New Hampshire: | 10.7% |
| Here: | 27.0% |
| New Hampshire: | 36.4% |