Glen Allen, VA (Virginia) Houses and Residents
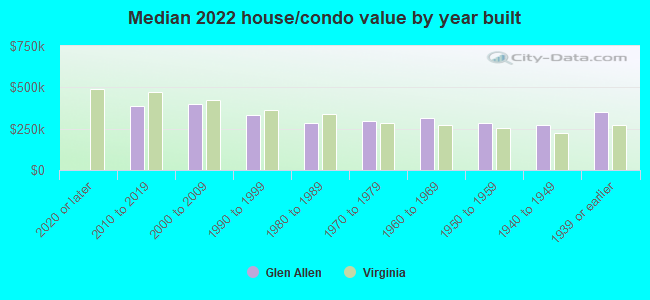
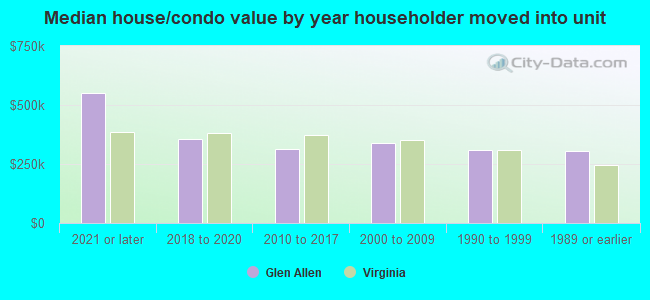
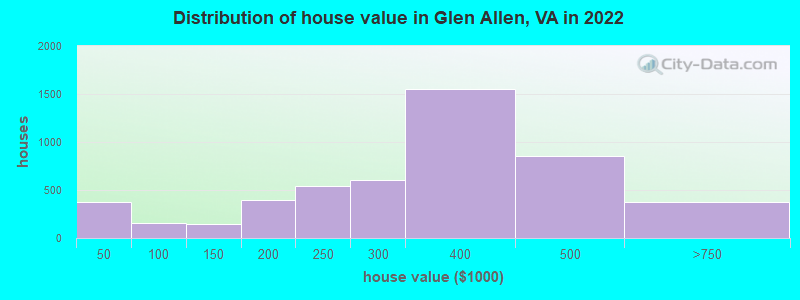
Estimated median house or condo value in 2022: $337,145 (it was $127,100 in 2000 )
Glen Allen:
$337,145Virginia:
$365,700
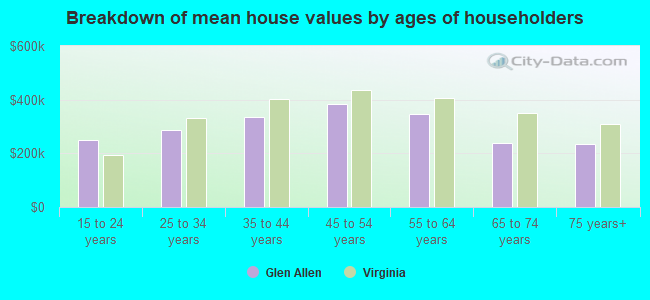
Lower value quartile - upper value quartile: $234,433 - $417,872Mean price in 2022: Detached houses: $363,936 Here:
$363,936State:
$472,865
Townhouses or other attached units: $235,758 Here:
$235,758State:
$457,437
In 5-or-more-unit structures: $150,367 Here:
$150,367State:
$382,551
Total population: 14,774 (Urban population: 12,091, Rural population: 679 (all nonfarm) )
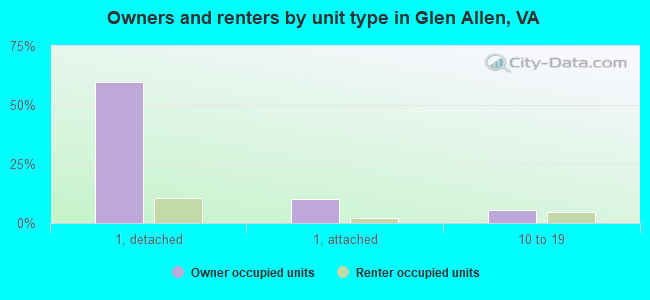
Houses: 6,652 (6,488 occupied: 4,791 owner occupied, 1,702 renter occupied )
% of renters here:
26%State:
33%
Housing density: 752 houses/condos per square mile
Median price asked for vacant for-sale houses and condos in 2022: $831,747.
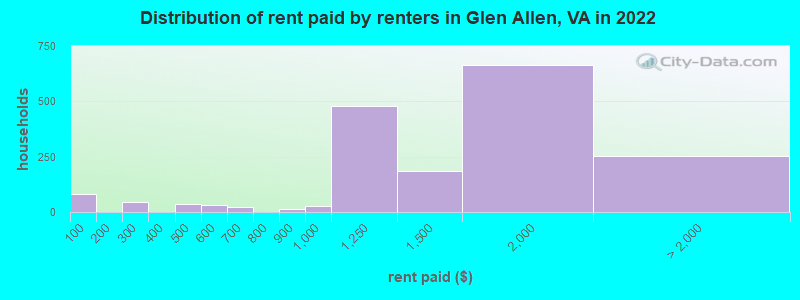
Median contract rent in 2022: $1,297 (lower quartile is $1,074, upper quartile is $1,847)
Median rent asked for vacant for-rent units in 2022: $3,371
Median gross rent in Glen Allen, VA in 2022: $1,476
Housing units in Glen Allen with a mortgage: 3,572 (410 second mortgage, 6 home equity loan, 295 both second mortgage and home equity loan )Houses without a mortgage: 241
Median household income for houses/condos with a mortgage: $101,070
Median household income for apartments without a mortgage: $77,627
Median monthly housing costs: $1,428
Data:
Median house or condo value ($)
Median house or condo value ($ change since 2000)
Median house or condo value ($) - White
Median house or condo value ($) - Black or African American
Median house or condo value ($) - Asian
Median house or condo value ($) - Hispanic or Latino
Median house or condo value ($) - American Indian and Alaska Native
Median house or condo value ($) - Multirace
Median house or condo value ($) - Other Race
Median price asked for mobile homes ($)
Household density (households per square mile)
Mean house or condo value by units in structure - 1, detached ($)
Mean house or condo value by units in structure - 1, attached ($)
Mean house or condo value by units in structure - 2 ($)
Mean house or condo value by units in structure by units in structure - 3 or 4 ($)
Mean house or condo value by units in structure - 5 or more ($)
Mean house or condo value by units in structure - Boat, RV, van, etc. ($)
Mean house or condo value by units in structure - Mobile home ($)
Median contract rent ($)
Median contract rent - Lower quartile ($)
Median contract rent - Upper quartile ($)
Median gross rent ($)
Urban houses (%)
Rural houses (%)
Houses occupied (%)
Houses occupied (% change since 2000)
Houses owner occupied (%)
Houses owner occupied (% change since 2000)
Houses renter occupied (%)
Houses renter occupied (% change since 2000)
Vacant housing units - For rent (%)
Vacant housing units - For rent (% change since 2000)
Vacant housing units - For sale only (%)
Vacant housing units - For sale only (% change since 2000)
Vacant housing units - Rented or sold, not occupied (%)
Vacant housing units - Rented or sold, not occupied (% change since 2000)
Vacant housing units - For seasonal, recreational, or occasional use (%)
Vacant housing units - For seasonal, recreational, or occasional use (% change since 2000)
Vacant housing units - For migrant workers (%)
Vacant housing units - For migrant workers (% change since 2000)
Vacant housing units - Other vacant (%)
Vacant housing units - Other vacant (% change since 2000)
Median monthly housing costs ($)
Median household income for houses/condos with a mortgage ($)
Median household income for houses/condos without a mortgage ($)
Median household income ($)
Median household income ($) - White
Median household income ($) - Black or African American
Median household income ($) - Asian
Median household income ($) - Hispanic or Latino
Median household income ($) - American Indian and Alaska Native
Median household income ($) - Multirace
Median household income ($) - Other Race
Mortgage status - with mortgage (%)
Mortgage status - with second mortgage (%)
Mortgage status - with home equity loan (%)
Mortgage status - with both second mortgage and home equity loan (%)
Mortgage status - without a mortgage (%)
Median year house/condo built
Median year apartment built
Household type by relationship - Male householder living alone (%)
Household type by relationship - Male householder not living alone (%)
Household type by relationship - Female householder living alone (%)
Household type by relationship - Female householder not living alone (%)
Household type by relationship - Opposite-Sex spouse (%)
Household type by relationship - Same-Sex spouse (%)
Household type by relationship - Opposite-Sex unmarried partner (%)
Household type by relationship - Same-Sex unmarried partner (%)
Household type by relationship - In group quarters (%)
Size of family households - 2-person household (%)
Size of family households - 3-person household (%)
Size of family households - 4-person household (%)
Size of family households - 5-person household (%)
Size of family households - 6-person household (%)
Size of family households - 7-or-more-person household (%)
Size of nonfamily households - 1-person household (%)
Size of nonfamily households - 2-person household (%)
Size of nonfamily households - 3-person household (%)
Size of nonfamily households - 4-person household (%)
Size of nonfamily households - 5-person household (%)
Size of nonfamily households - 6-person household (%)
Size of nonfamily households - 7-or-moreperson household (%)
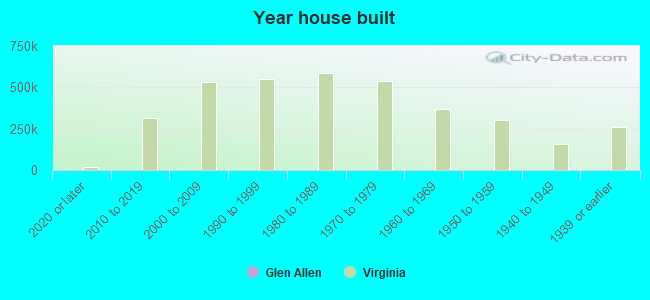
Year house built - Built 2010 or later (%)
Year house built - Built 2000 to 2009 (%)
Year house built - Built 1990 to 1999 (%)
Year house built - Built 1980 to 1989 (%)
Year house built - Built 1970 to 1979 (%)
Year house built - Built 1960 to 1969 (%)
Year house built - Built 1950 to 1959 (%)
Year house built - Built 1940 to 1949 (%)
Year house built - Built 1939 or earlier (%)
Median number of rooms in houses and condos
Median number of rooms in apartments
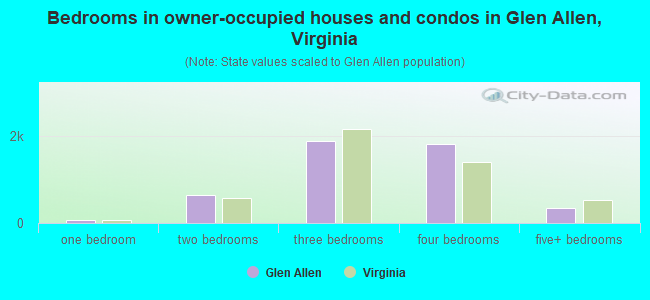
Median number of bedrooms in owner occupied houses
Mean number of bedrooms in owner occupied houses
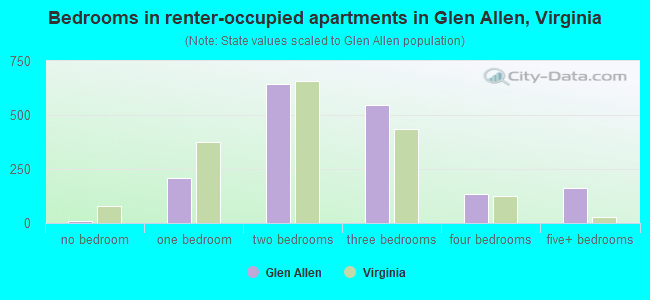
Median number of bedrooms in renter occupied houses
Mean number of bedrooms in renter occupied houses
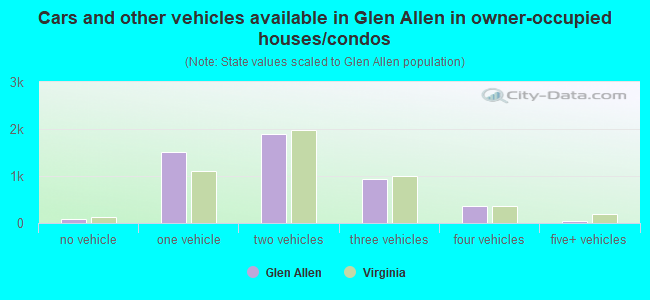
Median number of vehichles in owner occupied houses
Mean number of vehichles in owner occupied houses
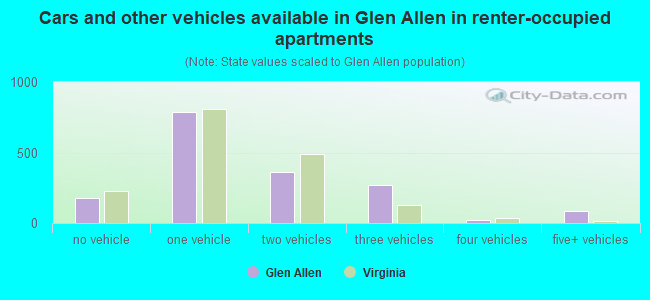
Median number of vehichles in renter occupied houses
Mean number of vehichles in renter occupied houses
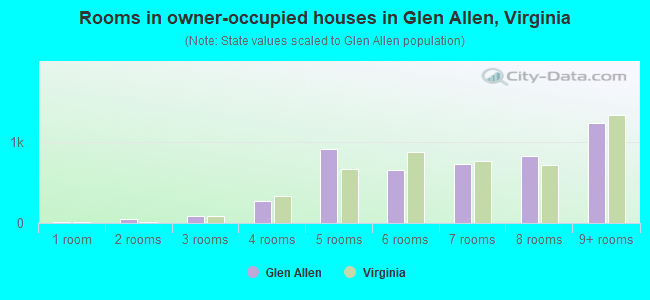
Rooms in owner-occupied houses - 1 room (%)
Rooms in owner-occupied houses - 2 rooms (%)
Rooms in owner-occupied houses - 3 rooms (%)
Rooms in owner-occupied houses - 4 rooms (%)
Rooms in owner-occupied houses - 5 rooms (%)
Rooms in owner-occupied houses - 6 rooms (%)
Rooms in owner-occupied houses - 7 rooms (%)
Rooms in owner-occupied houses - 8 rooms (%)
Rooms in owner-occupied houses - 9+ rooms (%)
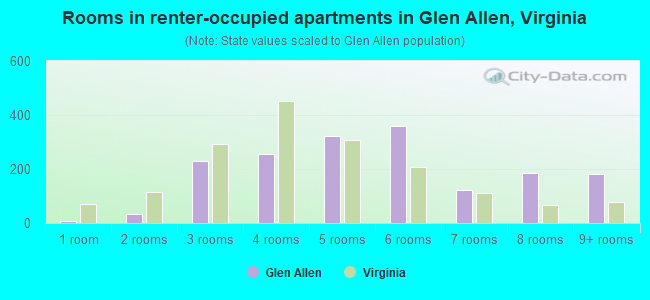
Rooms in renter-occupied houses - 1 room (%)
Rooms in renter-occupied houses - 2 rooms (%)
Rooms in renter-occupied houses - 3 rooms (%)
Rooms in renter-occupied houses - 4 rooms (%)
Rooms in renter-occupied houses - 5 rooms (%)
Rooms in renter-occupied houses - 6 rooms (%)
Rooms in renter-occupied houses - 7 rooms (%)
Rooms in renter-occupied houses - 8 rooms (%)
Rooms in renter-occupied houses - 9+ rooms (%)
Bedrooms in owner-occupied houses - no bedrooms (%)
Bedrooms in owner-occupied houses - 1 bedroom (%)
Bedrooms in owner-occupied houses - 2 bedrooms (%)
Bedrooms in owner-occupied houses - 3 bedrooms (%)
Bedrooms in owner-occupied houses - 4 bedrooms (%)
Bedrooms in owner-occupied houses - 5+ bedrooms (%)
Bedrooms in renter-occupied houses - no bedrooms (%)
Bedrooms in renter-occupied houses - 1 bedroom (%)
Bedrooms in renter-occupied houses - 2 bedrooms (%)
Bedrooms in renter-occupied houses - 3 bedrooms (%)
Bedrooms in renter-occupied houses - 4 bedrooms (%)
Bedrooms in renter-occupied houses - 5+ bedrooms (%)
Vehicles available in owner-occupied houses - no vehicle available (%)
Vehicles available in owner-occupied houses - 1 vehicle available(%)
Vehicles available in owner-occupied houses - 2 Vehicles available (%)
Vehicles available in owner-occupied houses - 3 Vehicles available (%)
Vehicles available in owner-occupied houses - 4 Vehicles available (%)
Vehicles available in owner-occupied houses - 5+ Vehicles available (%)
Vehicles available in renter-occupied houses - no vehicle available (%)
Vehicles available in renter-occupied houses - 1 vehicle available (%)
Vehicles available in renter-occupied houses - 2 Vehicles available (%)
Vehicles available in renter-occupied houses - 3 Vehicles available (%)
Vehicles available in renter-occupied houses - 4 Vehicles available (%)
Vehicles available in renter-occupied houses - 5+ Vehicles available (%)
Housing units in structures - 1, detached (%)
Housing units in structures - 1, attached (%)
Housing units in structures - 2 (%)
Housing units in structures - 3 or 4 (%)
Housing units in structures - 5 to 9 (%)
Housing units in structures - 10 to 19 (%)
Housing units in structures - 20 to 49 (%)
Housing units in structures - 50 or more (%)
Housing units in structures - Mobile home (%)
Housing units in structures - Boat, RV, van, etc. (%)
Housing units in structures - Owners - 1, detached (%)
Housing units in structures - Owners - 1, attached (%)
Housing units in structures - Owners - 2 (%)
Housing units in structures - Owners - 3 or 4 (%)
Housing units in structures - Owners - 5 to 9 (%)
Housing units in structures - Owners - 10 to 19 (%)
Housing units in structures - Owners - 20 to 49 (%)
Housing units in structures - Owners - 50 or more (%)
Housing units in structures - Owners - Mobile home (%)
Housing units in structures - Owners - Boat, RV, van, etc. (%)
Housing units in structures - Renters - 1, detached (%)
Housing units in structures - Renters - 1, attached (%)
Housing units in structures - Renters - 2 (%)
Housing units in structures - Renters - 3 or 4 (%)
Housing units in structures - Renters - 5 to 9 (%)
Housing units in structures - Renters - 10 to 19 (%)
Housing units in structures - Renters - 20 to 49 (%)
Housing units in structures - Renters - 50 or more (%)
Housing units in structures - Renters - Mobile home (%)
Housing units in structures - Renters - Boat, RV, van, etc. (%)
House/condo owner moved in on average (years ago)
Renter moved in on average (years ago)
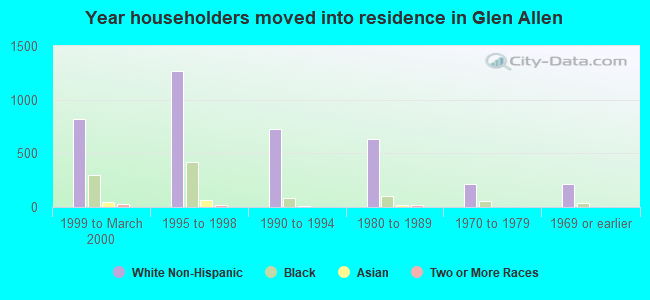
Year householder moved into unit - Moved in 1999 to March 2000 (%)
Year householder moved into unit - Moved in 1999 to March 2000 (%) - White
Year householder moved into unit - Moved in 1999 to March 2000 (%) - Black or African American
Year householder moved into unit - Moved in 1999 to March 2000 (%) - Asian
Year householder moved into unit - Moved in 1999 to March 2000 (%) - Hispanic or Latino
Year householder moved into unit - Moved in 1999 to March 2000 (%) - American Indian and Alaska Native
Year householder moved into unit - Moved in 1999 to March 2000 (%) - Multirace
Year householder moved into unit - Moved in 1999 to March 2000 (%) - Other Race
Year householder moved into unit - Moved in 1995 to 1998 (%)
Year householder moved into unit - Moved in 1995 to 1998 (%) - White
Year householder moved into unit - Moved in 1995 to 1998 (%) - Black or African American
Year householder moved into unit - Moved in 1995 to 1998 (%) - Asian
Year householder moved into unit - Moved in 1995 to 1998 (%) - Hispanic or Latino
Year householder moved into unit - Moved in 1995 to 1998 (%) - American Indian and Alaska Native
Year householder moved into unit - Moved in 1995 to 1998 (%) - Multirace
Year householder moved into unit - Moved in 1995 to 1998 (%) - Other Race
Year householder moved into unit - Moved in 1990 to 1994 (%)
Year householder moved into unit - Moved in 1990 to 1994 (%) - White
Year householder moved into unit - Moved in 1990 to 1994 (%) - Black or African American
Year householder moved into unit - Moved in 1990 to 1994 (%) - Asian
Year householder moved into unit - Moved in 1990 to 1994 (%) - Hispanic or Latino
Year householder moved into unit - Moved in 1990 to 1994 (%) - American Indian and Alaska Native
Year householder moved into unit - Moved in 1990 to 1994 (%) - Multirace
Year householder moved into unit - Moved in 1990 to 1994 (%) - Other Race
Year householder moved into unit - Moved in 1980 to 1989 (%)
Year householder moved into unit - Moved in 1980 to 1989 (%) - White
Year householder moved into unit - Moved in 1980 to 1989 (%) - Black or African American
Year householder moved into unit - Moved in 1980 to 1989 (%) - Asian
Year householder moved into unit - Moved in 1980 to 1989 (%) - Hispanic or Latino
Year householder moved into unit - Moved in 1980 to 1989 (%) - American Indian and Alaska Native
Year householder moved into unit - Moved in 1980 to 1989 (%) - Multirace
Year householder moved into unit - Moved in 1980 to 1989 (%) - Other Race
Year householder moved into unit - Moved in 1970 to 1979 (%)
Year householder moved into unit - Moved in 1970 to 1979 (%) - White
Year householder moved into unit - Moved in 1970 to 1979 (%) - Black or African American
Year householder moved into unit - Moved in 1970 to 1979 (%) - Asian
Year householder moved into unit - Moved in 1970 to 1979 (%) - Hispanic or Latino
Year householder moved into unit - Moved in 1970 to 1979 (%) - American Indian and Alaska Native
Year householder moved into unit - Moved in 1970 to 1979 (%) - Multirace
Year householder moved into unit - Moved in 1970 to 1979 (%) - Other Race
Year householder moved into unit - Moved in 1969 or earlier (%)
Year householder moved into unit - Moved in 1969 or earlier (%) - White
Year householder moved into unit - Moved in 1969 or earlier (%) - Black or African American
Year householder moved into unit - Moved in 1969 or earlier (%) - Asian
Year householder moved into unit - Moved in 1969 or earlier (%) - Hispanic or Latino
Year householder moved into unit - Moved in 1969 or earlier (%) - American Indian and Alaska Native
Year householder moved into unit - Moved in 1969 or earlier (%) - Multirace
Year householder moved into unit - Moved in 1969 or earlier (%) - Other Race
Housing units lacking complete plumbing facilities (%)
Housing units lacking complete kitchen facilities (%)
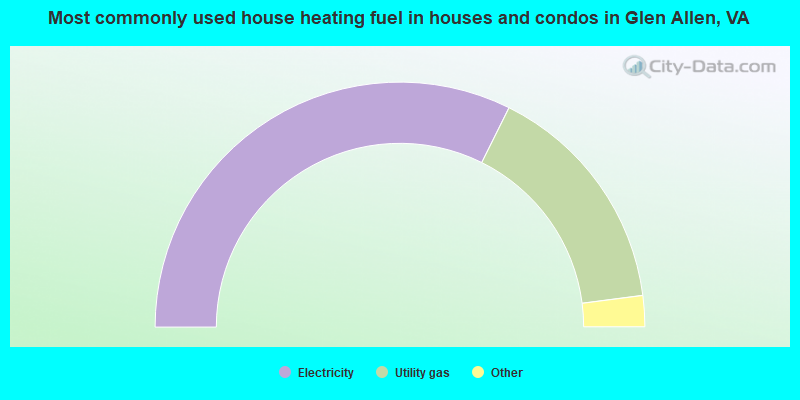
House heating fuel used in houses and condos - Utility gas (%)
House heating fuel used in houses and condos - Bottled, tank, or LP gas (%)
House heating fuel used in houses and condos - Electricity (%)
House heating fuel used in houses and condos - Fuel oil, kerosene, etc. (%)
House heating fuel used in houses and condos - Coal or coke (%)
House heating fuel used in houses and condos - Wood (%)
House heating fuel used in houses and condos - Solar energy (%)
House heating fuel used in houses and condos - Other fuel (%)
House heating fuel used in houses and condos - No fuel used (%)
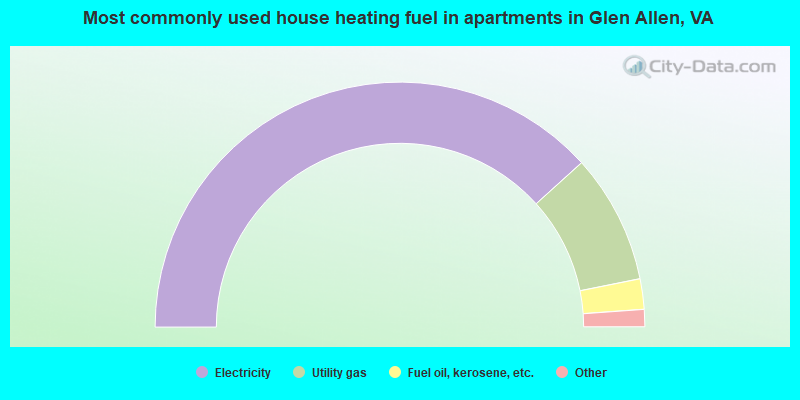
House heating fuel used in apartments - Utility gas (%)
House heating fuel used in apartments - Bottled, tank, or LP gas (%)
House heating fuel used in apartments - Electricity (%)
House heating fuel used in apartments - Fuel oil, kerosene, etc. (%)
House heating fuel used in apartments - Coal or coke (%)
House heating fuel used in apartments - Wood (%)
House heating fuel used in apartments - Solar energy (%)
House heating fuel used in apartments - Other fuel (%)
House heating fuel used in apartments - No fuel used (%)
Median year house/condo built: 1995Median year apartment built: 1997Household type by relationship:
Households: 16,287
Male householders: 2,622 (601 living alone ), Female householders: 3,732 (1,150 living alone )3,244 spouses (3,244 opposite-sex spouses ), 189 unmarried partners , (183 opposite-sex unmarried partners ), 5,504 children (5,356 natural , 10 adopted , 138 stepchildren ), 186 grandchildren , 128 brothers or sisters , 394 parents , 0 foster children , 90 other relatives , 164 non-relatives In group quarters: 29
Size of family households: 2,180 2-persons , 911 3-persons , 678 4-persons , 489 5-persons , 217 6-persons , 17 7-or-more-persons .
Size of nonfamily households: 1,807 1-person , 147 2-persons , 20 3-persons , 6 4-persons .
3,038 married couples with children. single-parent households (179 men , 472 women ).
87.5% of residents of Glen Allen speak English at home. of residents speak Spanish at home (53% speak English very well , 43% speak English well , 1% speak English not well , 3% don't speak English at all ).of residents speak other Indo-European language at home (66% speak English very well , 19% speak English well , 16% speak English not well ).of residents speak Asian or Pacific Island language at home (40% speak English very well , 10% speak English well , 50% speak English not well ).of residents speak other language at home (96% speak English very well , 4% speak English well ).
Foreign born population: 2,150 (13.2%)of them are naturalized citizens )
Median number of rooms in houses and condos:
Median number of rooms in apartments
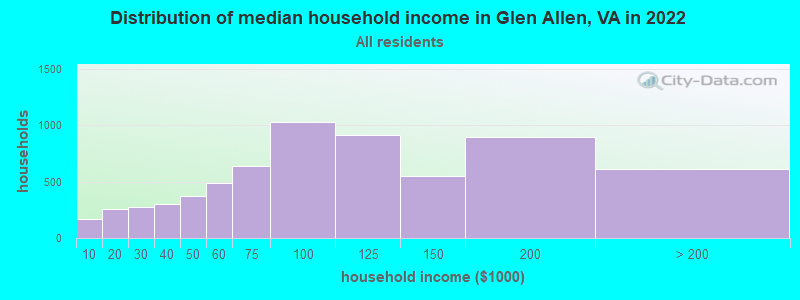
Glen Allen, VA household income distribution 166 Less than $10,000256 $10,000 to $19,999277 $20,000 to $29,999298 $30,000 to $39,999374 $40,000 to $49,999488 $50,000 to $59,999643 $60,000 to $74,9991,031 $75,000 to $99,999915 $100,000 to $124,999547 $125,000 to $149,999901 $150,000 to $199,999613 $200,000 or more
Home value of owner - occupied houses in 2022 in Glen Allen, VA 67 Less than $10,00021 $15,000 to $19,999128 $20,000 to $24,99910 $25,000 to $29,99917 $30,000 to $34,999125 $40,000 to $49,9991 $50,000 to $59,99911 $70,000 to $79,99918 $90,000 to $99,9996 $100,000 to $124,999134 $125,000 to $149,999234 $150,000 to $174,999157 $175,000 to $199,999537 $200,000 to $249,999605 $250,000 to $299,9991,548 $300,000 to $399,999859 $400,000 to $499,999358 $500,000 to $749,99912 $2,000,000 or moreRent paid by renters in 2022 in Glen Allen, VA 81 Less than $10037 $200 to $2498 $250 to $29936 $400 to $44930 $550 to $59920 $650 to $69913 $800 to $89926 $900 to $999477 $1,000 to $1,249185 $1,250 to $1,499662 $1,500 to $1,999113 $2,000 to $2,49922 $2,500 to $2,999114 No cash rent
Percentage of workers working in this county: 64.0%Number of people working at home: 2,288 (27.3% of all workers )
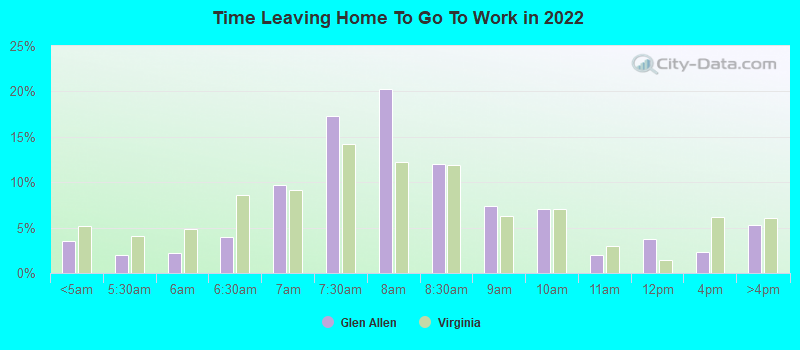
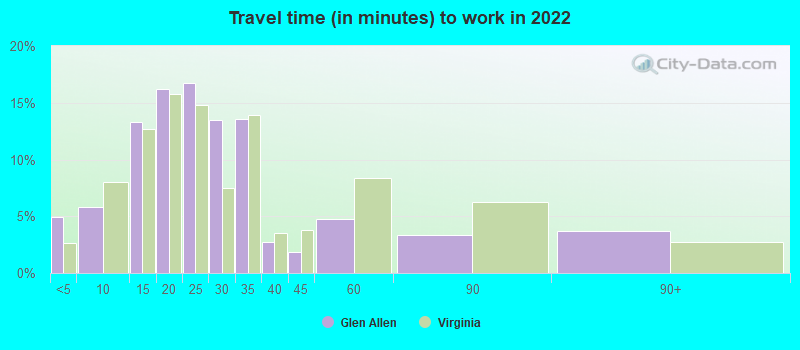
Travel time to work (commute)
Less than 5 minutes: 2985 to 9 minutes: 36810 to 14 minutes: 81915 to 19 minutes: 1,62220 to 24 minutes: 93325 to 29 minutes: 86630 to 34 minutes: 81735 to 39 minutes: 13440 to 44 minutes: 7045 to 59 minutes: 5060 to 89 minutes: 24290 or more minutes: 129
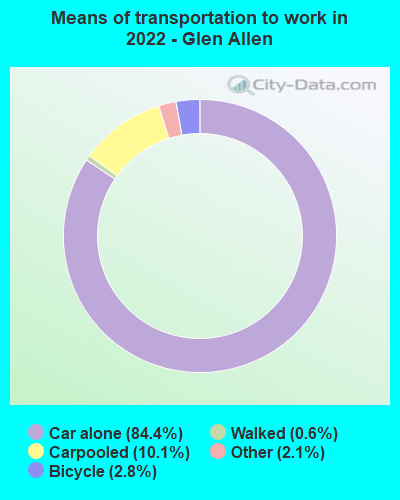
Means of transportation to work:
Drove a car alone: 3,504 (56.1%)Carpooled: 454 (7.3%)Taxi: 160 (2.6%)Bicycle: 125 (2.0%)Walked: 35 (0.6%)Worked at home: 2,288 (36.6%)
Unemployment by race in 2022
Unemployment rate for White non-Hispanic residents 3.0% Males5.3% FemalesUnemployment rate for Black residents 2.7% Males4.8% FemalesUnemployment rate for Asian residents 9.0% FemalesUnemployment rate for two or more race residents 23.0% Males42.8% FemalesUnemployment rate for Hispanic or Latino residents 8.1% Females
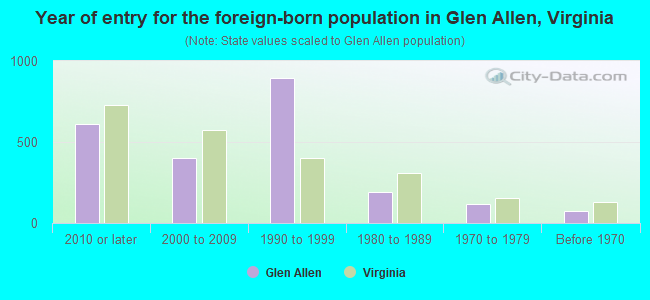
Year of entry for the foreign-born population in Glen Allen, Virginia
613 2010 or later 403 2000 to 2009 895 1990 to 1999 194 1980 to 1989 115 1970 to 1979 77 Before 1970
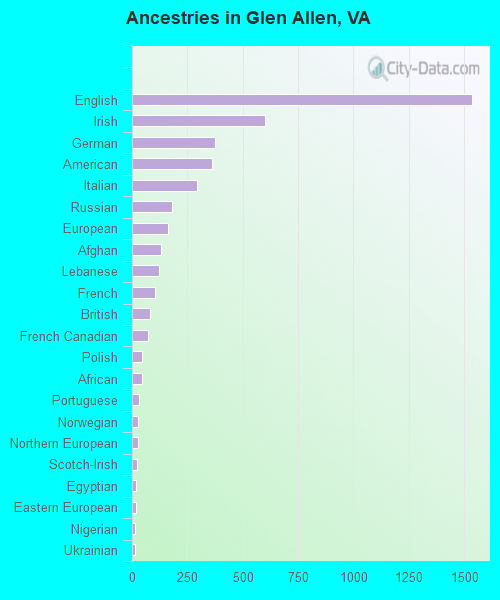
First ancestries reported:
English: 1,536 (16.6%)
Irish: 603 (6.5%)
German: 373 (4.0%)
American: 362 (3.9%)
Italian: 292 (3.2%)
Russian: 179 (1.9%)
European: 164 (1.8%)
Afghan: 129 (1.4%)
Lebanese: 123 (1.3%)
French: 106 (1.1%)
British: 82 (0.9%)
French Canadian: 72 (0.8%)
Polish: 45 (0.5%)
African: 44 (0.5%)
Portuguese: 30 (0.3%)
Norwegian: 27 (0.3%)
Northern European: 26 (0.3%)
Scotch-Irish: 23 (0.2%)
Egyptian: 19 (0.2%)
Eastern European: 19 (0.2%)
Nigerian: 14 (0.2%)
Ukrainian: 14 (0.2%)
Austrian: 13 (0.1%)
Dutch: 11 (0.1%)
Sierra Leonean: 10 (0.1%)
Serbian: 9 (0.10%)
Scottish: 7 (0.08%)
Welsh: 7 (0.08%)
Ethiopian: 1 (0.01%) Most common places of birth for foreign-born residents (%): China, excluding Hong Kong and Taiwan Glen Allen:
15.2% (339)Virginia:
3.9% (42,989)
India Glen Allen:
13.7% (306)Virginia:
9.0% (97,830)
Liberia Glen Allen:
7.1% (158)Virginia:
0.2% (2,214)
Sudan Glen Allen:
7.1% (158)Virginia:
0.4% (4,442)
Bangladesh Glen Allen:
6.9% (154)Virginia:
1.1% (12,049)
Mexico Glen Allen:
6.5% (146)Virginia:
5.3% (57,498)
El Salvador Glen Allen:
5.4% (121)Virginia:
9.9% (107,534)
Russia Glen Allen:
4.9% (109)Virginia:
0.9% (9,440)
Canada Glen Allen:
4.7% (105)Virginia:
1.2% (12,984)
Vietnam Glen Allen:
4.4% (99)Virginia:
4.2% (45,750)
Afghanistan Glen Allen:
3.8% (85)Virginia:
1.8% (19,426)
Korea Glen Allen:
3.0% (67)Virginia:
4.9% (52,857)
Iraq Glen Allen:
2.6% (58)Virginia:
0.9% (9,351)
Lebanon Glen Allen:
1.9% (43)Virginia:
0.5% (5,428)
Singapore Glen Allen:
1.7% (38)Virginia:
0.1% (711)
Place of birth for U.S.-born residents:
This state: 9,414Other state: 4,504Northeast: 1,593Midwest: 606South: 1,856West: 451 87.3% of Glen Allen residents lived in the same house 1 years ago.
Out of people who lived in different houses, 40.4% lived in this county.
Out of people who lived in different counties, 48.7% lived in Virginia.
Glen Allen:
87.3%State average:
86.6%
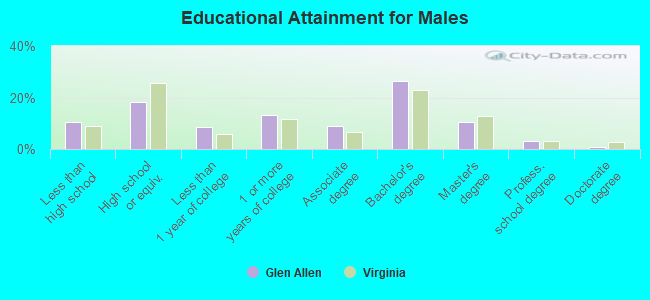
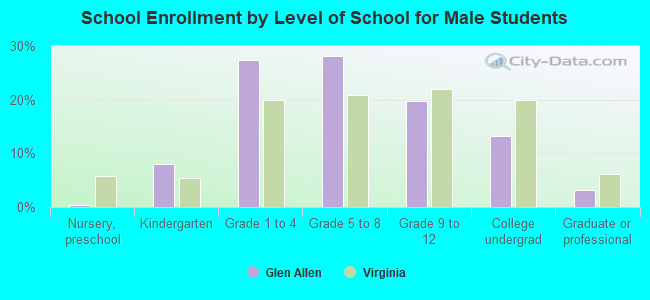
Education attainment for males 25 years and older:
No schooling: 169Nursery to 4th grade: 05th and 6th grade: 577th and 8th grade: 119th grade: 1310th grade: 1911th grade: 512th grade, no diploma: 269High school graduate (or equivalency): 932Less than 1 year of college: 431Some college more than 1 year, no degree: 676Associate degree: 449Bachelor's degree: 1,344Master's degree: 543Professional school degree: 152Doctorate degree: 43
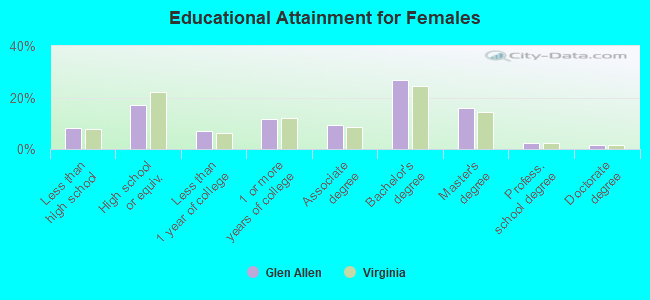
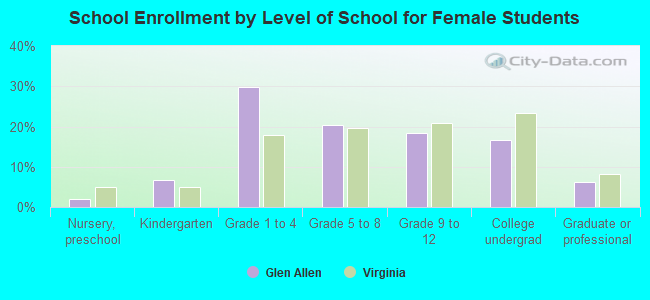
Education attainment for females 25 years and older:
No schooling: 127Nursery to 4th grade: 85th and 6th grade: 267th and 8th grade: 209th grade: 1110th grade: 11111th grade: 1212th grade, no diploma: 180High school graduate (or equivalency): 1,043Less than 1 year of college: 430Some college more than 1 year, no degree: 711Associate degree: 566Bachelor's degree: 1,639Master's degree: 962Professional school degree: 132Doctorate degree: 100
Housing units in structures:
One, detached: 4,594One, attached: 7443 or 4: 735 to 9: 33910 to 19: 69320 to 49: 10750 or more: 99Housing units lacking complete kitchen facilities in 2022: 0.6%House/condo owner moved in on average 12 years ago
Renter moved in on average 2 years ago
Private vs. public school enrollment:
Students in private schools in grades 1 to 8 (elementary and middle school): 200 Students in private schools in grades 9 to 12 (high school): 78 Students in private undergraduate colleges: 45