Grass Valley, CA (California) Houses and Residents
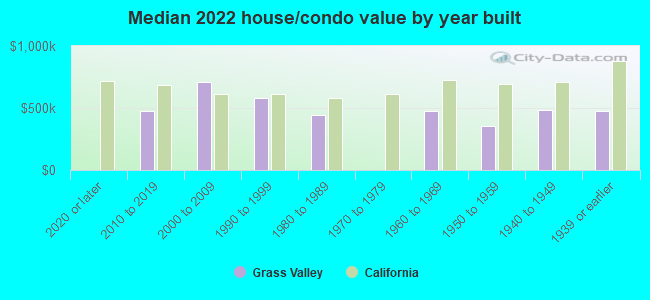
| Grass Valley: | $491,184 |
| California: | $715,900 |
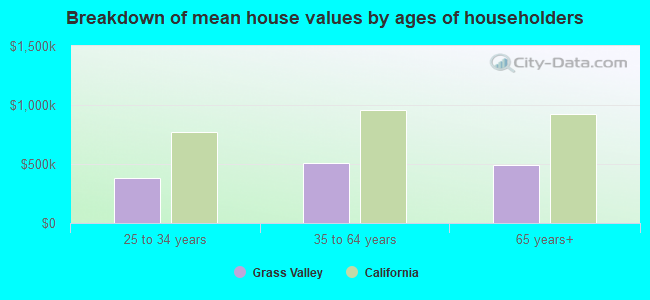
Mean price in 2022:
Detached houses: $543,960
Here: $543,960 State: $988,808 Townhouses or other attached units: $754,305
Here: $754,305 State: $838,546 In 3-to-4-unit structures: $156,334
Here: $156,334 State: $824,253 In 5-or-more-unit structures: $615,873
Here: $615,873 State: $730,996 Mobile homes: $70,834
Here: $70,834 State: $184,506
Total population: 12,878 (Urban population: 11,141 (all inside urban clusters), Rural population: 20 (all nonfarm))
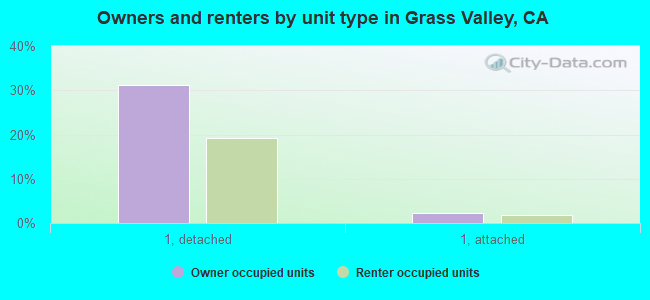
Houses: 7,352 (6,736 occupied: 2,902 owner occupied, 4,166 renter occupied)
| % of renters here: | 59% |
| State: | 44% |
Housing density: 1,791 houses/condos per square mile
Median price asked for vacant for-sale houses and condos in 2022: $570,192.
Median contract rent in 2022: $1,121 (lower quartile is $635, upper quartile is $1,445)
Median rent asked for vacant for-rent units in 2022: $1,055
Median gross rent in Grass Valley, CA in 2022: $1,305
Housing units in Grass Valley with a mortgage: 1,460 (54 second mortgage, 0 home equity loan, 63 both second mortgage and home equity loan)
Houses without a mortgage: 74
Median household income for houses/condos with a mortgage: $98,510
Median household income for apartments without a mortgage: $53,209
Median monthly housing costs: $1,284
Compare current foreclosures in Grass Valley, CA:
| Photo | Address | Area | Beds / Baths | Price | Details |
|---|---|---|---|---|---|

|
#1
Ball Rd
Grass Valley, CA 95949
|
2,150 sq. feet
|
3 baths 4 beds |
show details | |

|
#2
Kingswood Ct
Grass Valley, CA 95949
|
4,534 sq. feet
|
4 baths 4 beds |
show details | |

|
#3
Henson Way
Grass Valley, CA 95949
|
2,142 sq. feet
|
3 baths 3 beds |
show details | |

|
#4
Connie Dr
Grass Valley, CA 95949
|
2,304 sq. feet
|
2 baths 4 beds |
show details | |

|
#5
Gunstock Rd
Grass Valley, CA 95949
|
- sq. feet
|
3 baths 3 beds |
show details | |

|
#6
Carrie Dr
Grass Valley, CA 95949
|
- sq. feet
|
2 baths 4 beds |
show details | |

|
#7
Pekolee Dr
Grass Valley, CA 95949
|
- sq. feet
|
2 baths 3 beds |
show details | |

|
#8
Pine Peak Rd
Grass Valley, CA 95945
|
- sq. feet
|
2 baths 2 beds |
show details | |

|
#9
Salcido Ln
Grass Valley, CA 95949
|
- sq. feet
|
2 baths 3 beds |
show details | |

|
#10
Richardson St
Grass Valley, CA 95945
|
- sq. feet
|
2 baths 3 beds |
show details |
| Photo | Address | Area | Beds / Baths | Price | Details |
|---|---|---|---|---|---|

|
#11
Misty Dawn Ln
Grass Valley, CA 95949
|
- sq. feet
|
2 baths 3 beds |
show details | |

|
#12
Buck Ridge Rd
Grass Valley, CA 95949
|
- sq. feet
|
2 baths 2 beds |
show details | |

|
#13
Wolf Mountain Rd
Grass Valley, CA 95949
|
- sq. feet
|
2 baths 3 beds |
show details | |

|
#14
Rattlesnake Rd
Grass Valley, CA 95945
|
- sq. feet
|
3 baths 3 beds |
show details | |

|
#15
Manion Canyon Rd
Grass Valley, CA 95945
|
- sq. feet
|
2 baths 3 beds |
show details | |

|
#16
Meyer Way
Grass Valley, CA 95949
|
- sq. feet
|
3 baths 3 beds |
show details | |

|
#17
Pammy Way
Grass Valley, CA 95949
|
- sq. feet
|
2 baths 3 beds |
show details | |

|
#18
Magnolia Rd
Grass Valley, CA 95949
|
- sq. feet
|
2 baths 3 beds |
show details | |

|
#19
Oak Dr
Grass Valley, CA 95949
|
- sq. feet
|
2 baths 3 beds |
show details | |

|
#20
Oscar Dr
Grass Valley, CA 95949
|
- sq. feet
|
2 baths 3 beds |
show details |
| Photo | Address | Area | Beds / Baths | Price | Details |
|---|---|---|---|---|---|

|
#21
Norlene Way
Grass Valley, CA 95949
|
- sq. feet
|
3 baths 2 beds |
show details | |

|
#22
Bow Valley Rd
Grass Valley, CA 95945
|
- sq. feet
|
- baths - beds |
show details | |

|
#23
Lexington Way
Grass Valley, CA 95945
|
- sq. feet
|
- baths - beds |
show details | |

|
#24
Highway 20
Grass Valley, CA 95945
|
- sq. feet
|
- baths - beds |
show details | |

|
#25
Mill St
Grass Valley, CA 95945
|
- sq. feet
|
- baths - beds |
show details | |

|
#26
Brighton St
Grass Valley, CA 95945
|
- sq. feet
|
- baths - beds |
show details | |

|
#27
Stennett St
Grass Valley, CA 95945
|
- sq. feet
|
- baths - beds |
show details | |

|
#28
Pauls Pl
Grass Valley, CA 95945
|
- sq. feet
|
- baths - beds |
show details | |

|
#29
Oliver Ln
Grass Valley, CA 95945
|
- sq. feet
|
- baths - beds |
show details | |

|
#30
Mccourtney Rd
Grass Valley, CA 95949
|
- sq. feet
|
- baths - beds |
show details |
| Photo | Address | Area | Beds / Baths | Price | Details |
|---|---|---|---|---|---|

|
#31
Glenwood Ave
Grass Valley, CA 95945
|
- sq. feet
|
5 baths - beds |
show details | |

|
#32
Pampas Dr
Grass Valley, CA 95945
|
- sq. feet
|
- baths - beds |
show details | |

|
#33
Lauren Ln
Grass Valley, CA 95949
|
- sq. feet
|
- baths - beds |
show details | |

|
#34
Mccourtney Rd
Grass Valley, CA 95949
|
- sq. feet
|
- baths - beds |
show details | |

|
#35
Mccourtney Rd
Grass Valley, CA 95949
|
- sq. feet
|
- baths - beds |
show details | |

|
#36
Meyer Rd
Grass Valley, CA 95945
|
- sq. feet
|
- baths - beds |
show details | |

|
#37
Thoroughbred Loop
Grass Valley, CA 95949
|
- sq. feet
|
- baths - beds |
show details | |

|
#38
Elster Pl
Grass Valley, CA 95949
|
- sq. feet
|
- baths - beds |
show details | |

|
Check over 1 million property listings on Foreclosure.com!
|
browse all offers | |||


 | Grass Valley questions please? Snow? Apartments? dog friendly culture? (2 replies) |
| Grass Valley rent prices? (5 replies) |
| Grass Valley vs. Nevada City (18 replies) |
| Nevada City-Grass Valley (27 replies) |
| CA Cities, Counties and Metro Areas by Number of Affluent Households, 2005-2009 (22 replies) |
| Love SoCal, Can't Afford a House Here, where to folks go? (232 replies) |
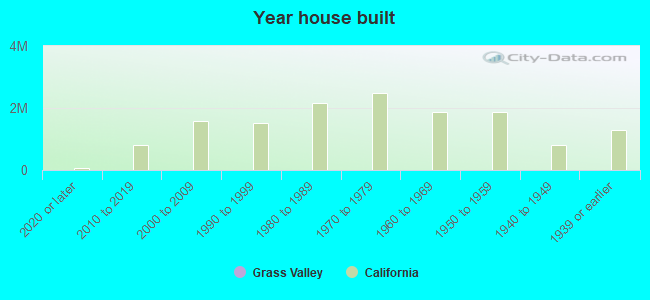
Median year apartment built: 1981
Household type by relationship:
Households: 13,960- Male householders: 2,631 (942 living alone), Female householders: 4,020 (2,270 living alone)
1,428 spouses (1,391 opposite-sex spouses), 689 unmarried partners, (689 opposite-sex unmarried partners), 3,394 children (3,111 natural, 48 adopted, 233 stepchildren), 42 grandchildren, 87 brothers or sisters, 93 parents, 0 foster children, 357 other relatives, 385 non-relatives
- In group quarters: 826
Size of family households: 1,585 2-persons, 696 3-persons, 543 4-persons, 219 5-persons, 6 6-persons, 5 7-or-more-persons.
Size of nonfamily households: 3,033 1-person, 836 2-persons, 29 3-persons.
1,155 married couples with children.
1,453 single-parent households (404 men, 1,049 women).
89.2% of residents of Grass Valley speak English at home.
4.3% of residents speak Spanish at home (85% speak English very well, 13% speak English well, 2% speak English not well).
1.6% of residents speak other Indo-European language at home (88% speak English very well, 3% speak English well, 8% speak English not well).
2.2% of residents speak Asian or Pacific Island language at home (95% speak English very well, 2% speak English not well, 3% don't speak English at all).
3.1% of residents speak other language at home (78% speak English very well, 22% speak English well).
Foreign born population: 1,239 (8.9%)
(52.5% of them are naturalized citizens)
| Here: | 5.4 |
| State: | 6.0 |
| Here: | 3.9 |
| State: | 3.9 |
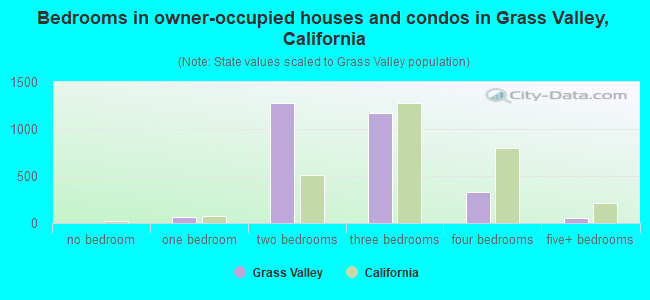
- Bedrooms in owner-occupied houses and condos in Grass Valley, California
- 0no bedroom
- 691 bedroom
- 1,2752 bedrooms
- 1,1653 bedrooms
- 3354 bedrooms
- 585+ bedrooms
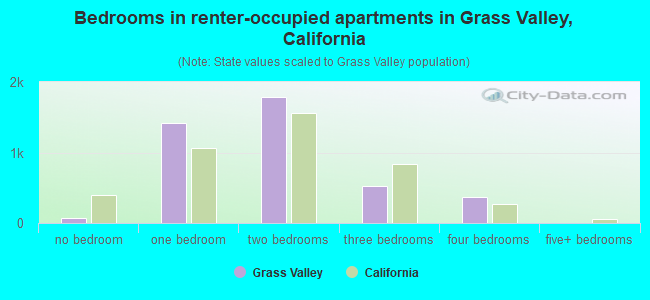
- Bedrooms in renter-occupied apartments in Grass Valley, California
- 71no bedroom
- 1,4241 bedroom
- 1,7822 bedrooms
- 5213 bedrooms
- 3704 bedrooms
- 05+ bedrooms
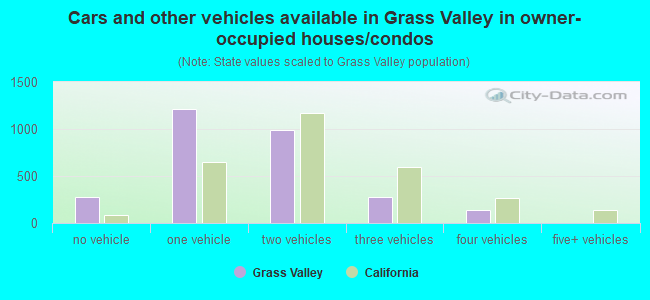
- Cars and other vehicles available in Grass Valley in owner-occupied houses/condos
- 280no vehicle
- 1,2151 vehicle
- 9902 vehicles
- 2783 vehicles
- 1384 vehicles
- 05+ vehicles
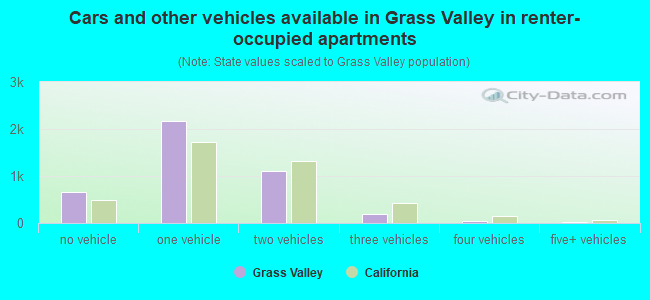
- Cars and other vehicles available in Grass Valley in renter-occupied apartments
- 658no vehicle
- 2,1661 vehicle
- 1,1062 vehicles
- 1883 vehicles
- 334 vehicles
- 165+ vehicles
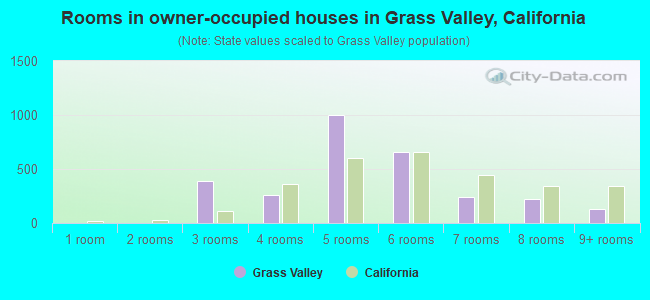
- Rooms in owner-occupied houses in Grass Valley, California
- 01 room
- 02 rooms
- 3873 rooms
- 2564 rooms
- 1,0015 rooms
- 6626 rooms
- 2457 rooms
- 2238 rooms
- 1299+ rooms
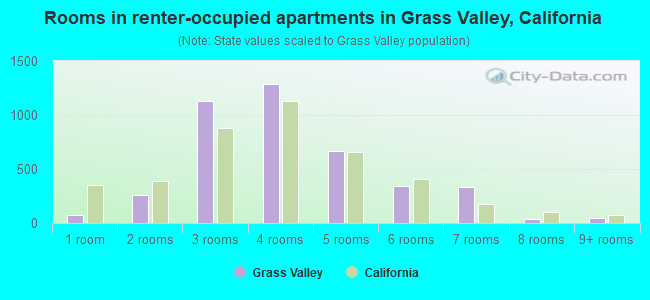
- Rooms in renter-occupied apartments in Grass Valley, California
- 711 room
- 2582 rooms
- 1,1263 rooms
- 1,2904 rooms
- 6685 rooms
- 3416 rooms
- 3297 rooms
- 368 rooms
- 479+ rooms
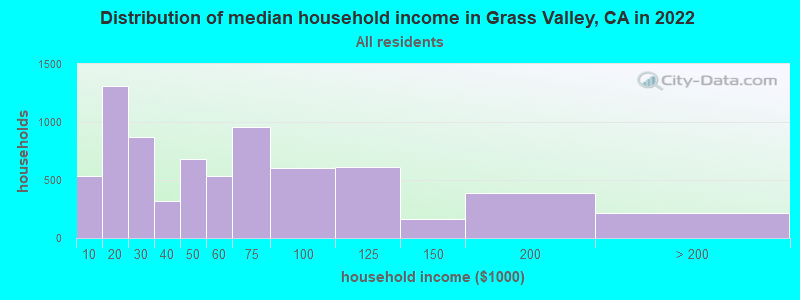
Grass Valley, CA household income distribution

- 536Less than $10,000
- 1,308$10,000 to $19,999
- 874$20,000 to $29,999
- 318$30,000 to $39,999
- 685$40,000 to $49,999
- 535$50,000 to $59,999
- 956$60,000 to $74,999
- 601$75,000 to $99,999
- 610$100,000 to $124,999
- 166$125,000 to $149,999
- 391$150,000 to $199,999
- 212$200,000 or more
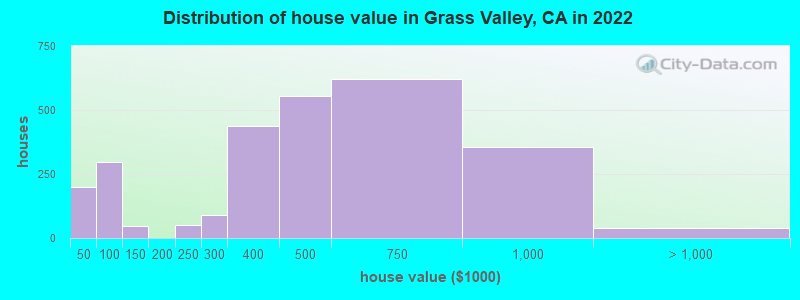
Home value of owner - occupied houses in 2022 in Grass Valley, CA
-
- 56Less than $10,000
- 21$15,000 to $19,999
- 20$30,000 to $34,999
- 99$40,000 to $49,999
- 188$50,000 to $59,999
- 7$90,000 to $99,999
- 45$100,000 to $124,999
- 49$200,000 to $249,999
- 88$250,000 to $299,999
- 437$300,000 to $399,999
- 553$400,000 to $499,999
- 621$500,000 to $749,999
- 353$750,000 to $999,999
- 21$1,000,000 to $1,499,999
- 17$1,500,000 to $1,999,999
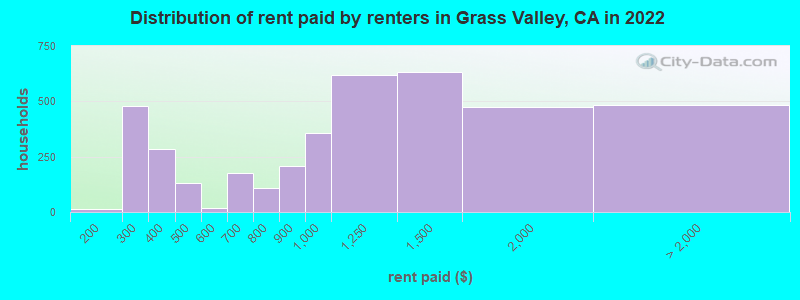
Rent paid by renters in 2022 in Grass Valley, CA
-
- 13$150 to $199
- 357$200 to $249
- 119$250 to $299
- 7$300 to $349
- 277$350 to $399
- 119$400 to $449
- 10$450 to $499
- 19$550 to $599
- 129$600 to $649
- 48$650 to $699
- 17$700 to $749
- 89$750 to $799
- 208$800 to $899
- 354$900 to $999
- 616$1,000 to $1,249
- 632$1,250 to $1,499
- 475$1,500 to $1,999
- 133$2,000 to $2,499
- 208$2,500 to $2,999
- 65$3,500 or more
- 77No cash rent
Percentage of workers working in this county: 91.5%
Number of people working at home: 780 (14.4% of all workers)
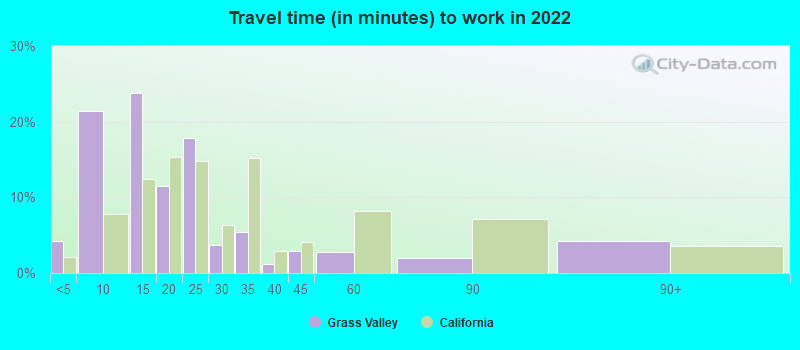
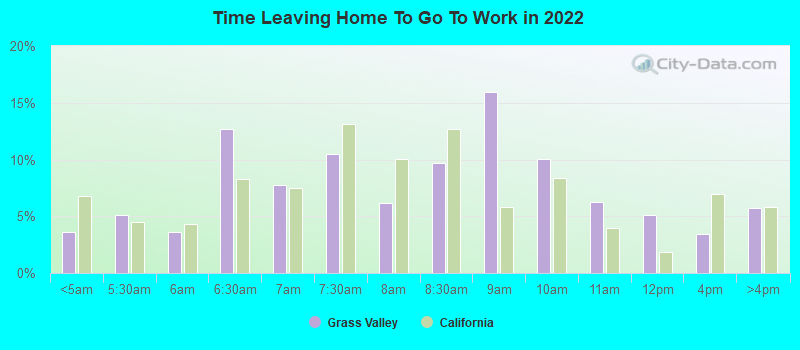
Travel time to work (commute)
- Less than 5 minutes: 405
- 5 to 9 minutes: 1,783
- 10 to 14 minutes: 1,197
- 15 to 19 minutes: 431
- 20 to 24 minutes: 219
- 25 to 29 minutes: 0
- 30 to 34 minutes: 110
- 35 to 39 minutes: 44
- 40 to 44 minutes: 72
- 45 to 59 minutes: 117
- 60 to 89 minutes: 174
- 90 or more minutes: 180
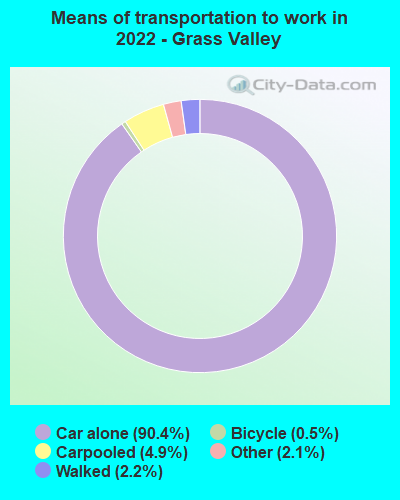
Means of transportation to work:
- Drove a car alone: 10,671 (81.3%)
- Carpooled: 619 (4.7%)
- Taxi: 262 (2.0%)
- Bicycle: 60 (0.5%)
- Walked: 270 (2.1%)
- Worked at home: 982 (7.5%)
- Unemployment by race in 2022
- Unemployment rate for White non-Hispanic residents
- 3.3%Males
- 1.4%Females
- Unemployment rate for two or more race residents
- 1.1%Females
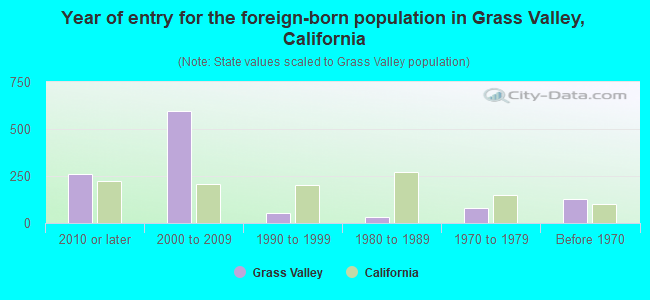
- Year of entry for the foreign-born population in Grass Valley, California
- 2602010 or later
- 5942000 to 2009
- 531990 to 1999
- 341980 to 1989
- 801970 to 1979
- 129Before 1970
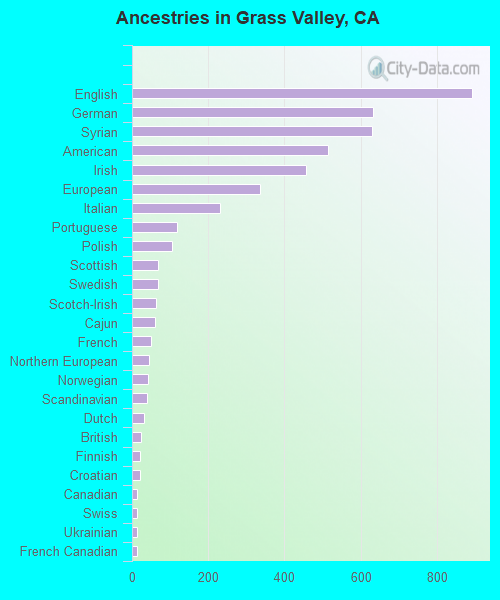
First ancestries reported:
- English: 892 (14.3%)
- German: 631 (10.1%)
- Syrian: 629 (10.1%)
- American: 515 (8.3%)
- Irish: 457 (7.3%)
- European: 336 (5.4%)
- Italian: 231 (3.7%)
- Portuguese: 119 (1.9%)
- Polish: 104 (1.7%)
- Scottish: 68 (1.1%)
- Swedish: 67 (1.1%)
- Scotch-Irish: 63 (1.0%)
- Cajun: 60 (1.0%)
- French: 51 (0.8%)
- Northern European: 44 (0.7%)
- Norwegian: 41 (0.7%)
- Scandinavian: 40 (0.6%)
- Dutch: 32 (0.5%)
- British: 24 (0.4%)
- Finnish: 22 (0.4%)
- Croatian: 20 (0.3%)
- Canadian: 14 (0.2%)
- Swiss: 13 (0.2%)
- Ukrainian: 13 (0.2%)
- French Canadian: 12 (0.2%)
- Eastern European: 11 (0.2%)
- Slovene: 8 (0.1%)
- Jamaican: 2 (0.03%)
Most common places of birth for foreign-born residents (%):
| Grass Valley: | 26.6% (315) |
| California: | 37.2% (3,881,193) |
| Grass Valley: | 22.2% (262) |
| California: | 0.3% (30,949) |
| Grass Valley: | 11.1% (131) |
| California: | 0.7% (73,304) |
| Grass Valley: | 9.3% (110) |
| California: | 0.4% (39,097) |
| Grass Valley: | 5.6% (66) |
| California: | 0.2% (16,541) |
| Grass Valley: | 4.6% (54) |
| California: | 1.2% (127,477) |
| Grass Valley: | 2.4% (28) |
| California: | 0.6% (65,335) |
| Grass Valley: | 2.4% (28) |
| California: | 7.8% (818,297) |
| Grass Valley: | 1.9% (22) |
| California: | 0.2% (16,042) |
| Grass Valley: | 1.9% (22) |
| California: | 0.1% (10,213) |
| Grass Valley: | 1.5% (18) |
| California: | 0.6% (57,953) |
| Grass Valley: | 1.5% (18) |
| California: | 0.2% (16,586) |
Place of birth for U.S.-born residents:
- This state: 8,775
- Other state: 3,793
- Northeast: 854
- Midwest: 1,393
- South: 753
- West: 795
85.2% of Grass Valley residents lived in the same house 1 years ago.
Out of people who lived in different houses, 34.8% lived in this county.
Out of people who lived in different counties, 90.0% lived in California.
| Grass Valley: | 85.2% |
| State average: | 88.9% |
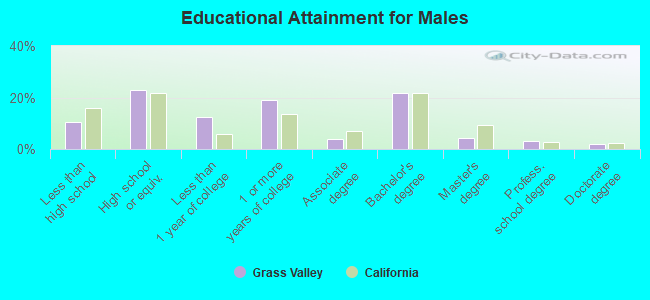
Education attainment for males 25 years and older:
- No schooling: 83
- Nursery to 4th grade: 0
- 5th and 6th grade: 3
- 7th and 8th grade: 5
- 9th grade: 0
- 10th grade: 42
- 11th grade: 141
- 12th grade, no diploma: 171
- High school graduate (or equivalency): 993
- Less than 1 year of college: 533
- Some college more than 1 year, no degree: 823
- Associate degree: 162
- Bachelor's degree: 940
- Master's degree: 188
- Professional school degree: 137
- Doctorate degree: 84
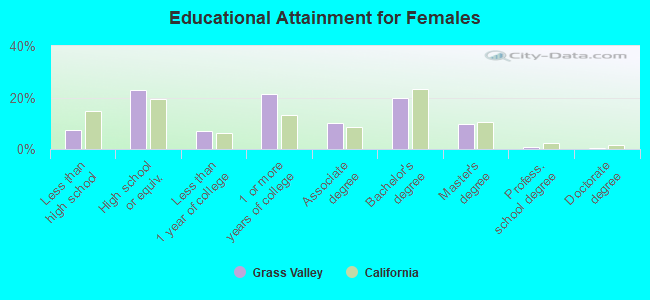
Education attainment for females 25 years and older:
- No schooling: 7
- Nursery to 4th grade: 29
- 5th and 6th grade: 23
- 7th and 8th grade: 0
- 9th grade: 5
- 10th grade: 58
- 11th grade: 126
- 12th grade, no diploma: 209
- High school graduate (or equivalency): 1,430
- Less than 1 year of college: 447
- Some college more than 1 year, no degree: 1,339
- Associate degree: 636
- Bachelor's degree: 1,226
- Master's degree: 616
- Professional school degree: 58
- Doctorate degree: 20
Housing units in structures:
- One, detached: 3,755
- One, attached: 280
- Two: 259
- 3 or 4: 453
- 5 to 9: 523
- 10 to 19: 410
- 20 to 49: 292
- 50 or more: 803
- Mobile homes: 535
- Boats, RVs, vans, etc.: 38
Median worth of mobile homes: $74,561
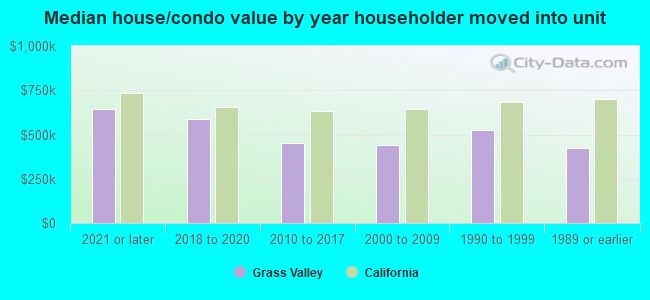
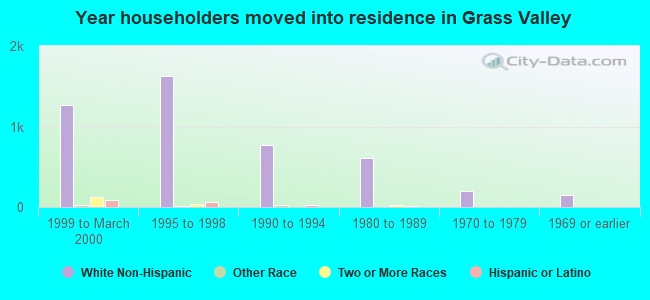
House/condo owner moved in on average 8 years ago
Renter moved in on average 4 years ago
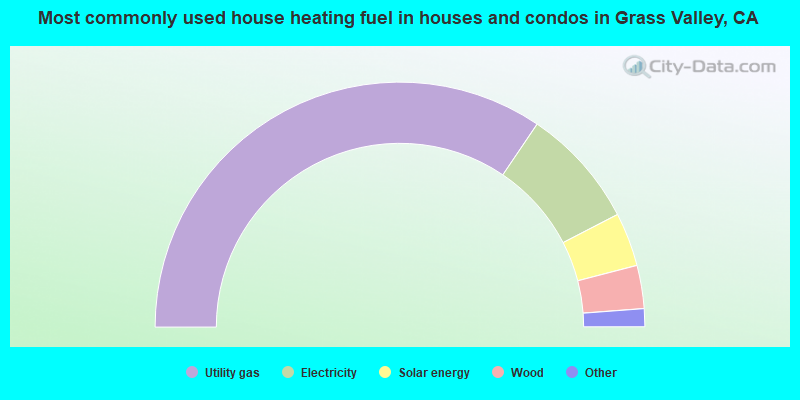
- 69.0%Utility gas
- 15.9%Electricity
- 7.1%Solar energy
- 5.7%Wood
- 1.2%Other fuel
- 0.6%No fuel used
- 0.5%Bottled, tank, or LP gas
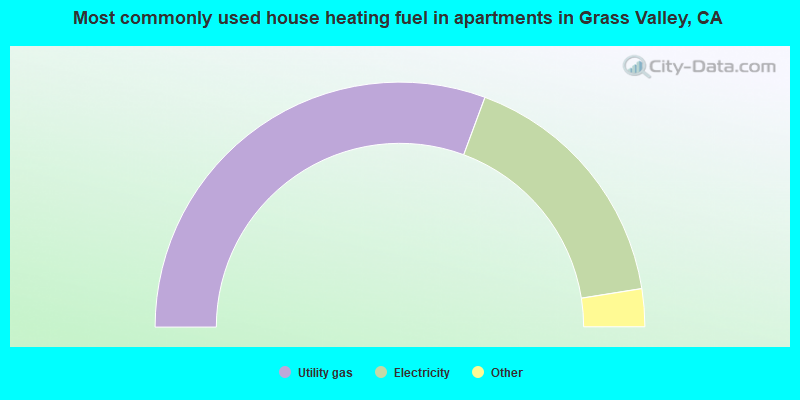
- 61.3%Utility gas
- 33.7%Electricity
- 3.1%No fuel used
- 1.1%Wood
- 0.7%Bottled, tank, or LP gas
- 0.1%Solar energy
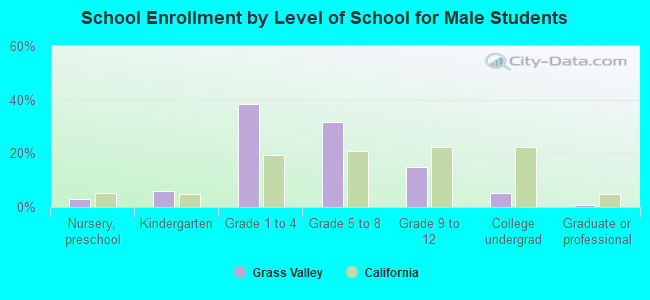
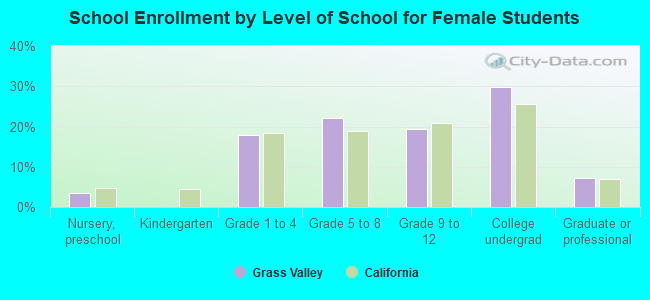
Private vs. public school enrollment:
| Here: | 4.9% |
| California: | 10.5% |
| Here: | 3.7% |
| California: | 8.5% |
| Here: | 4.2% |
| California: | 15.9% |