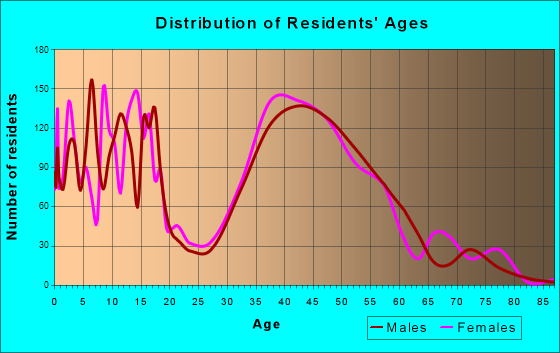
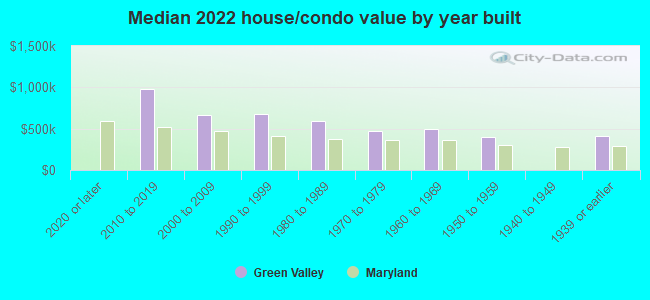
Green Valley, MD (Maryland) Houses and Residents
| Green Valley: | $600,247 |
| Maryland: | $398,100 |
Total population: 14,037 (Urban population: 10,799, Rural population: 1,393 (all nonfarm))
Houses: 4,357 (4,311 occupied: 4,204 owner occupied, 124 renter occupied)
| % of renters here: | 3% |
| State: | 32% |
Housing density: 211 houses/condos per square mile
Median price asked for vacant for-sale houses and condos in 2022 in this county: $402,870.
Median contract rent in 2022: over $2,000 (lower quartile is over $2,000, upper quartile is over $2,000)
Median gross rent in Green Valley, MD in 2022: over $2,000
Housing units in Green Valley with a mortgage: 3,481 (472 second mortgage, 0 home equity loan, 420 both second mortgage and home equity loan)
Houses without a mortgage: 35
Median household income for houses/condos with a mortgage: $173,874
Median household income for apartments without a mortgage: $161,296
Median monthly housing costs: $2,470
Compare current foreclosures near Green Valley, MD:
| Photo | Address | Area | Beds / Baths | Price | Details |
|---|---|---|---|---|---|

|
#1
Brooke Knolls Rd
Gaithersburg, MD 20882
|
1,704 sq. feet
|
3 baths 4 beds |
$681,500
|
show details |

|
#2
Caledonia Ct Apt K
Germantown, MD 20874
|
1,087 sq. feet
|
2 baths 2 beds |
show details | |

|
#3
W Broadway St
Union Bridge, MD 21791
|
- sq. feet
|
2 baths 4 beds |
$239,900
|
show details |

|
#4
Buhrstone Dr
Montgomery Village, MD 20886
|
1,060 sq. feet
|
3 baths 3 beds |
show details | |

|
#5
Polaris Dr
Walkersville, MD 21793
|
2,858 sq. feet
|
4 baths 4 beds |
show details | |

|
#6
Brassie Pl Apt 201
Montgomery Village, MD 20886
|
1,050 sq. feet
|
2 baths 2 beds |
show details | |

|
#7
Cove Ledge Ct
Montgomery Village, MD 20886
|
- sq. feet
|
3 baths 4 beds |
show details | |

|
#8
Dockside Ct
Frederick, MD 21701
|
1,360 sq. feet
|
1 baths 2 beds |
show details | |

|
#9
Brookshire Run
Point Of Rocks, MD 21777
|
844 sq. feet
|
2 baths 3 beds |
show details | |

|
#10
Braeburn Dr
Walkersville, MD 21793
|
2,032 sq. feet
|
3 baths 3 beds |
show details |
| Photo | Address | Area | Beds / Baths | Price | Details |
|---|---|---|---|---|---|

|
#11
Coriander Dr
Gaithersburg, MD 20879
|
774 sq. feet
|
1 baths 1 beds |
show details | |

|
#12
Gaither Rd
Sykesville, MD 21784
|
2,191 sq. feet
|
2 baths 3 beds |
show details | |

|
#13
Sweet Autumn Dr Apt 301
Gaithersburg, MD 20879
|
785 sq. feet
|
1 baths 1 beds |
show details | |

|
#14
Maycrest Way
Germantown, MD 20876
|
2,452 sq. feet
|
2 baths 3 beds |
show details | |

|
#15
Gallop Ter
Germantown, MD 20874
|
1,360 sq. feet
|
2 baths 3 beds |
show details | |

|
#16
Colonial Way
Frederick, MD 21702
|
- sq. feet
|
2 baths 4 beds |
show details | |

|
#17
Ridgeline Dr
Montgomery Village, MD 20886
|
1,794 sq. feet
|
2 baths 3 beds |
show details | |

|
#18
Maitland Ter
Frederick, MD 21703
|
3,147 sq. feet
|
2 baths - beds |
show details | |

|
#19
Hillcrest Dr
Frederick, MD 21703
|
1,432 sq. feet
|
2 baths - beds |
show details | |

|
#20
Buhrstone Dr
Montgomery Village, MD 20886
|
1,060 sq. feet
|
2 baths - beds |
show details |
| Photo | Address | Area | Beds / Baths | Price | Details |
|---|---|---|---|---|---|

|
#21
Sycamore Valley Run
Glenwood, MD 21738
|
5,880 sq. feet
|
5 baths - beds |
show details | |

|
#22
Transhire Rd
Montgomery Village, MD 20886
|
1,370 sq. feet
|
2 baths - beds |
show details | |

|
#23
Curiosity Ct
Walkersville, MD 21793
|
1,792 sq. feet
|
2 baths - beds |
show details | |

|
#24
Boller Dr
Westminster, MD 21157
|
1,862 sq. feet
|
2 baths - beds |
show details | |

|
#25
Glen Echo Rd
Frederick, MD 21703
|
2,056 sq. feet
|
2 baths - beds |
show details | |

|
#26
Nicodemus Rd
Westminster, MD 21157
|
1,160 sq. feet
|
1 baths - beds |
show details | |

|
#27
Twin Arch Rd
Mount Airy, MD 21771
|
988 sq. feet
|
1 baths - beds |
show details | |

|
#28
Carriage Hill Dr
Frederick, MD 21704
|
4,723 sq. feet
|
3 baths - beds |
show details | |

|
#29
Mussetter Rd
Ijamsville, MD 21754
|
4,200 sq. feet
|
5 baths 6 beds |
show details | |

|
#30
Hidden Ponds Way
Gaithersburg, MD 20878
|
6,217 sq. feet
|
4 baths - beds |
show details |
| Photo | Address | Area | Beds / Baths | Price | Details |
|---|---|---|---|---|---|

|
#31
Knoll Mist Ln
Gaithersburg, MD 20879
|
1,630 sq. feet
|
2 baths - beds |
show details | |

|
#32
Summer Oak Dr
Germantown, MD 20874
|
1,096 sq. feet
|
1 baths - beds |
show details | |

|
#33
Fieldstone Ct
Frederick, MD 21702
|
2,596 sq. feet
|
3 baths - beds |
show details | |

|
#34
Longfield Pl
Adamstown, MD 21710
|
3,102 sq. feet
|
2 baths - beds |
show details | |

|
#35
Cross Tie Ct
Gaithersburg, MD 20879
|
1,670 sq. feet
|
3 baths - beds |
show details | |

|
#36
Timber View Ct
Frederick, MD 21702
|
2,596 sq. feet
|
3 baths - beds |
show details | |

|
#37
Kilcreggan Ter
Gaithersburg, MD 20879
|
1,080 sq. feet
|
2 baths - beds |
show details | |

|
#38
Mourning Dove Ct
Gaithersburg, MD 20879
|
1,760 sq. feet
|
2 baths - beds |
show details | |

|
#39
Freestate Pl
Montgomery Village, MD 20886
|
3,964 sq. feet
|
3 baths - beds |
show details | |

|
#40
Brenish Dr
Gaithersburg, MD 20879
|
1,080 sq. feet
|
1 baths - beds |
show details |
| Photo | Address | Area | Beds / Baths | Price | Details |
|---|---|---|---|---|---|

|
#41
Pikeview Dr
Germantown, MD 20874
|
1,064 sq. feet
|
1 baths - beds |
show details | |

|
#42
Streamwood Ct
Sykesville, MD 21784
|
1,000 sq. feet
|
1 baths - beds |
show details | |

|
#43
High Timber Ct
Gaithersburg, MD 20879
|
1,438 sq. feet
|
2 baths - beds |
show details | |

|
#44
Timber Grove Rd
Frederick, MD 21702
|
2,281 sq. feet
|
2 baths - beds |
show details | |

|
#45
Flower Hill Way
Gaithersburg, MD 20879
|
1,782 sq. feet
|
2 baths - beds |
show details | |

|
#46
Grouse Ct
Frederick, MD 21703
|
1,940 sq. feet
|
2 baths - beds |
show details | |

|
#47
Horizon Run Rd # 5c
Montgomery Village, MD 20886
|
2,099 sq. feet
|
1 baths - beds |
show details | |

|
#48
Flower Hill Ter
Gaithersburg, MD 20879
|
1,680 sq. feet
|
2 baths - beds |
show details | |

|
#49
Metz Dr
Germantown, MD 20874
|
1,344 sq. feet
|
2 baths - beds |
show details | |

|
Check over 1 million property listings on Foreclosure.com!
|
browse all offers | |||

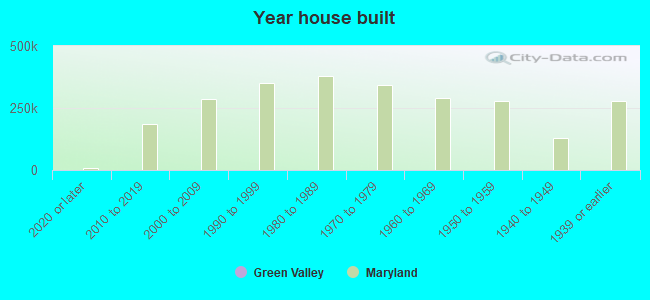
Median year apartment built: 1982
Household type by relationship:
Households: 13,608- Male householders: 2,480 (272 living alone), Female householders: 1,840 (208 living alone)
3,292 spouses (3,265 opposite-sex spouses), 115 unmarried partners, (115 opposite-sex unmarried partners), 4,700 children (4,274 natural, 87 adopted, 339 stepchildren), 227 grandchildren, 17 brothers or sisters, 290 parents, 0 foster children, 349 other relatives, 291 non-relatives
- In group quarters: 1
Size of family households: 1,396 2-persons, 792 3-persons, 719 4-persons, 636 5-persons, 89 6-persons, 91 7-or-more-persons.
Size of nonfamily households: 456 1-person, 153 2-persons, 27 3-persons, 28 4-persons.
2,577 married couples with children.
177 single-parent households (37 men, 140 women).
90.7% of residents of Green Valley speak English at home.
2.3% of residents speak Spanish at home (64% speak English very well, 27% speak English well, 9% speak English not well).
2.3% of residents speak other Indo-European language at home (70% speak English very well, 21% speak English well, 9% speak English not well).
1.4% of residents speak Asian or Pacific Island language at home (69% speak English very well, 5% speak English well, 22% speak English not well, 4% don't speak English at all).
2.8% of residents speak other language at home (37% speak English very well, 29% speak English well, 12% speak English not well, 22% don't speak English at all).
Foreign born population: 1,225 (9.0%)
(81.1% of them are naturalized citizens)
| Here: | 10.0 |
| State: | 7.3 |
| Here: | 10.0 |
| State: | 4.2 |
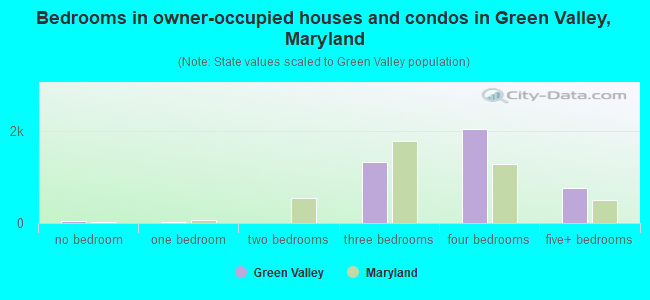
- Bedrooms in owner-occupied houses and condos in Green Valley, Maryland
- 45no bedroom
- 161 bedroom
- 92 bedrooms
- 1,3303 bedrooms
- 2,0494 bedrooms
- 7555+ bedrooms
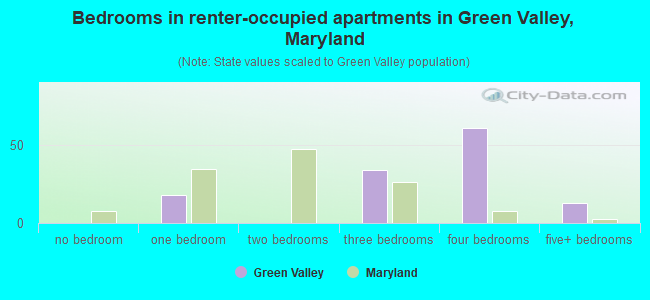
- Bedrooms in renter-occupied apartments in Green Valley, Maryland
- 0no bedroom
- 181 bedroom
- 02 bedrooms
- 343 bedrooms
- 614 bedrooms
- 135+ bedrooms
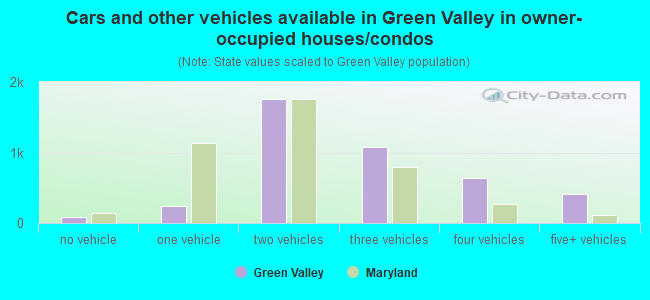
- Cars and other vehicles available in Green Valley in owner-occupied houses/condos
- 81no vehicle
- 2411 vehicle
- 1,7532 vehicles
- 1,0773 vehicles
- 6424 vehicles
- 4125+ vehicles
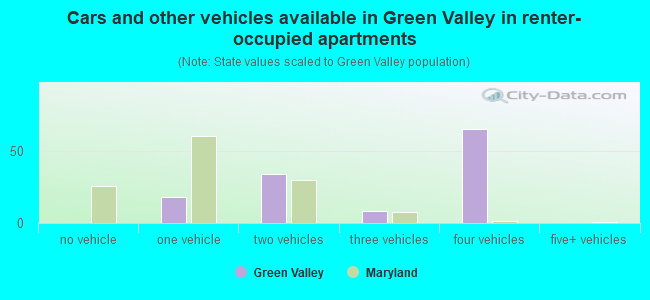
- Cars and other vehicles available in Green Valley in renter-occupied apartments
- 0no vehicle
- 181 vehicle
- 342 vehicles
- 83 vehicles
- 654 vehicles
- 05+ vehicles
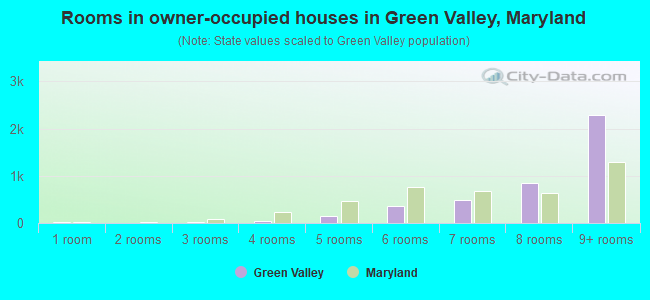
- Rooms in owner-occupied houses in Green Valley, Maryland
- 211 room
- 02 rooms
- 243 rooms
- 454 rooms
- 1405 rooms
- 3606 rooms
- 4797 rooms
- 8478 rooms
- 2,2899+ rooms
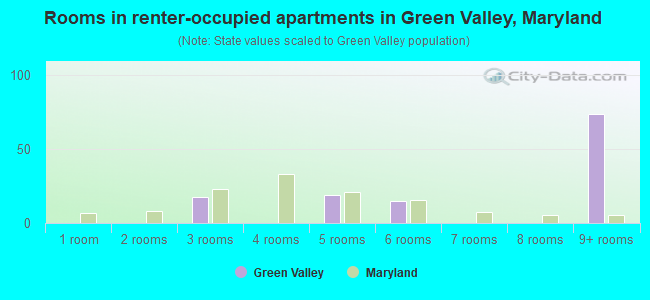
- Rooms in renter-occupied apartments in Green Valley, Maryland
- 01 room
- 02 rooms
- 183 rooms
- 04 rooms
- 195 rooms
- 156 rooms
- 07 rooms
- 08 rooms
- 749+ rooms
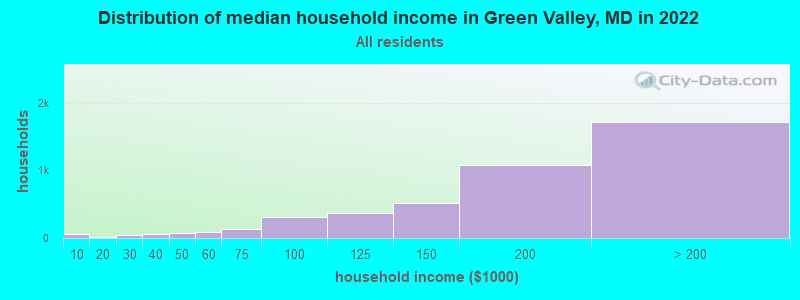
Green Valley, MD household income distribution

- 56Less than $10,000
- 13$10,000 to $19,999
- 45$20,000 to $29,999
- 62$30,000 to $39,999
- 76$40,000 to $49,999
- 93$50,000 to $59,999
- 129$60,000 to $74,999
- 304$75,000 to $99,999
- 369$100,000 to $124,999
- 524$125,000 to $149,999
- 1,072$150,000 to $199,999
- 1,714$200,000 or more
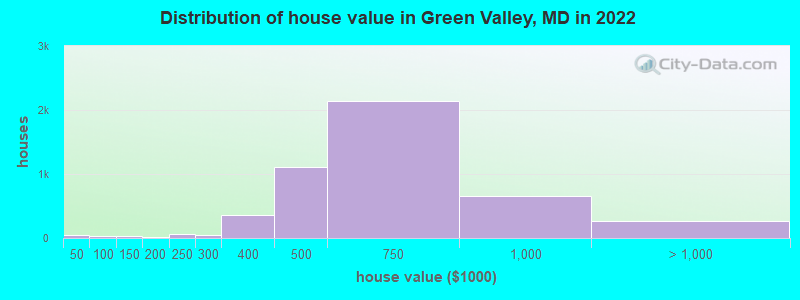
Home value of owner - occupied houses in 2022 in Green Valley, MD
-
- 53Less than $10,000
- 36$60,000 to $69,999
- 23$100,000 to $124,999
- 8$175,000 to $199,999
- 57$200,000 to $249,999
- 49$250,000 to $299,999
- 363$300,000 to $399,999
- 1,116$400,000 to $499,999
- 2,142$500,000 to $749,999
- 654$750,000 to $999,999
- 198$1,000,000 to $1,499,999
- 64$2,000,000 or more
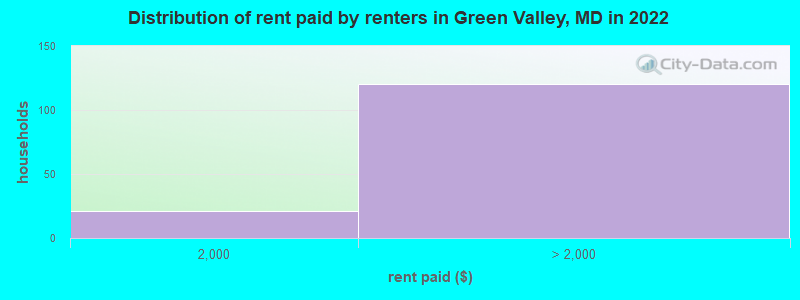
Rent paid by renters in 2022 in Green Valley, MD
-
- 21$1,500 to $1,999
- 58$2,000 to $2,499
- 25$2,500 to $2,999
- 21$3,500 or more
- 13No cash rent
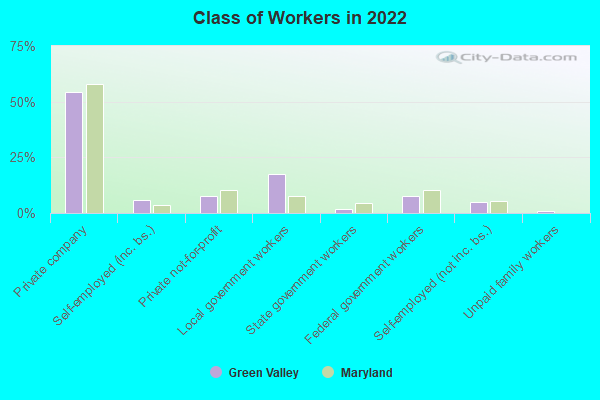
Percentage of workers working in this county: 52.0%
Number of people working at home: 1,681 (24.1% of all workers)
Travel time to work (commute)
- Less than 5 minutes: 7
- 5 to 9 minutes: 354
- 10 to 14 minutes: 339
- 15 to 19 minutes: 492
- 20 to 24 minutes: 799
- 25 to 29 minutes: 472
- 30 to 34 minutes: 556
- 35 to 39 minutes: 229
- 40 to 44 minutes: 206
- 45 to 59 minutes: 884
- 60 to 89 minutes: 895
- 90 or more minutes: 107
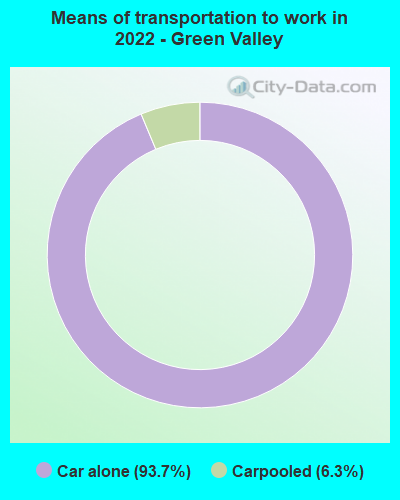
Means of transportation to work:
- Drove a car alone: 535 (28.6%)
- Carpooled: 39 (2.1%)
- Worked at home: 1,681 (89.7%)
- Unemployment by race in 2022
- Unemployment rate for White non-Hispanic residents
- 0.8%Males
- 2.1%Females
- Unemployment rate for Black residents
- 27.5%Males
- 11.5%Females
- Unemployment rate for Asian residents
- 19.0%Females
- Unemployment rate for two or more race residents
- 3.2%Males
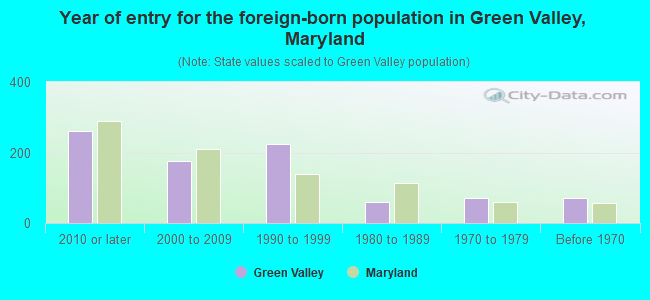
- Year of entry for the foreign-born population in Green Valley, Maryland
- 2622010 or later
- 1772000 to 2009
- 2251990 to 1999
- 591980 to 1989
- 721970 to 1979
- 72Before 1970
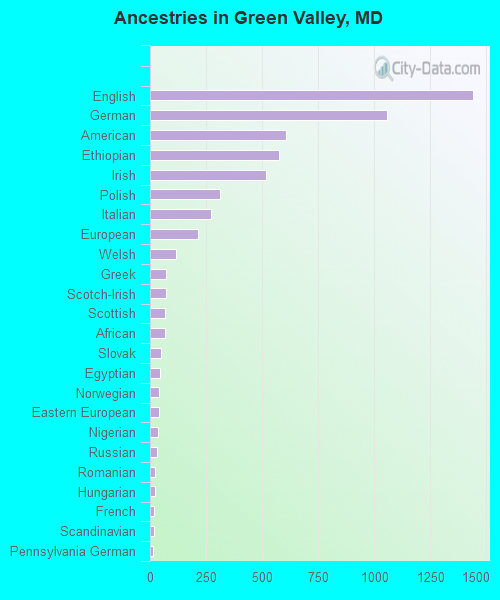
First ancestries reported:
- English: 1,440 (23.0%)
- German: 1,055 (16.8%)
- American: 606 (9.7%)
- Ethiopian: 577 (9.2%)
- Irish: 519 (8.3%)
- Polish: 312 (5.0%)
- Italian: 274 (4.4%)
- European: 212 (3.4%)
- Welsh: 117 (1.9%)
- Greek: 71 (1.1%)
- Scotch-Irish: 71 (1.1%)
- Scottish: 65 (1.0%)
- African: 65 (1.0%)
- Slovak: 51 (0.8%)
- Egyptian: 45 (0.7%)
- Norwegian: 42 (0.7%)
- Eastern European: 40 (0.6%)
- Nigerian: 34 (0.5%)
- Russian: 31 (0.5%)
- Romanian: 24 (0.4%)
- Hungarian: 24 (0.4%)
- French: 16 (0.3%)
- Scandinavian: 16 (0.3%)
- Pennsylvania German: 15 (0.2%)
- Brazilian: 13 (0.2%)
- Dutch: 13 (0.2%)
- Ukrainian: 12 (0.2%)
- Basque: 10 (0.2%)
- British: 10 (0.2%)
- Northern European: 10 (0.2%)
- Iranian: 7 (0.1%)
- Swedish: 7 (0.1%)
- Kenyan: 1 (0.02%)
Most common places of birth for foreign-born residents (%):
| Green Valley: | 33.1% (354) |
| Maryland: | 0.3% (2,915) |
| Green Valley: | 7.1% (76) |
| Maryland: | 3.2% (30,870) |
| Green Valley: | 7.0% (75) |
| Maryland: | 3.4% (32,635) |
| Green Valley: | 6.8% (73) |
| Maryland: | 6.4% (61,725) |
| Green Valley: | 6.0% (64) |
| Maryland: | 0.7% (7,000) |
| Green Valley: | 5.1% (55) |
| Maryland: | 0.5% (4,414) |
| Green Valley: | 4.4% (47) |
| Maryland: | 3.8% (36,698) |
| Green Valley: | 3.6% (39) |
| Maryland: | 1.2% (11,265) |
| Green Valley: | 3.6% (38) |
| Maryland: | 4.6% (44,825) |
| Green Valley: | 3.5% (37) |
| Maryland: | 0.1% (1,211) |
| Green Valley: | 3.3% (35) |
| Maryland: | 0.3% (2,547) |
| Green Valley: | 2.8% (30) |
| Maryland: | 4.6% (44,742) |
| Green Valley: | 2.5% (27) |
| Maryland: | 1.2% (11,481) |
| Green Valley: | 2.3% (25) |
| Maryland: | 1.3% (12,898) |
| Green Valley: | 2.0% (21) |
| Maryland: | 0.2% (2,108) |
| Green Valley: | 2.0% (21) |
| Maryland: | 12.0% (115,412) |
| Green Valley: | 1.9% (20) |
| Maryland: | 0.9% (8,520) |
| Green Valley: | 1.9% (20) |
| Maryland: | 0.6% (5,828) |
| Green Valley: | 1.8% (19) |
| Maryland: | 1.3% (12,074) |
| Green Valley: | 1.6% (17) |
| Maryland: | 1.8% (17,037) |
Place of birth for U.S.-born residents:
- This state: 6,496
- Other state: 5,739
- Northeast: 1,836
- Midwest: 1,173
- South: 2,346
- West: 392
94.2% of Green Valley residents lived in the same house 1 years ago.
Out of people who lived in different houses, 25.7% lived in this county.
Out of people who lived in different counties, 73.9% lived in Maryland.
| Green Valley: | 94.2% |
| State average: | 88.5% |
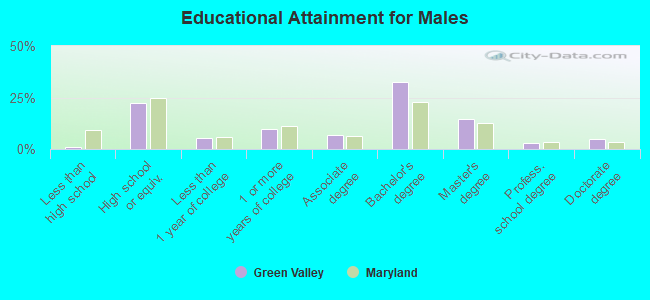
Education attainment for males 25 years and older:
- No schooling: 0
- Nursery to 4th grade: 0
- 5th and 6th grade: 0
- 7th and 8th grade: 0
- 9th grade: 0
- 10th grade: 0
- 11th grade: 39
- 12th grade, no diploma: 15
- High school graduate (or equivalency): 1,134
- Less than 1 year of college: 272
- Some college more than 1 year, no degree: 497
- Associate degree: 334
- Bachelor's degree: 1,654
- Master's degree: 730
- Professional school degree: 154
- Doctorate degree: 238
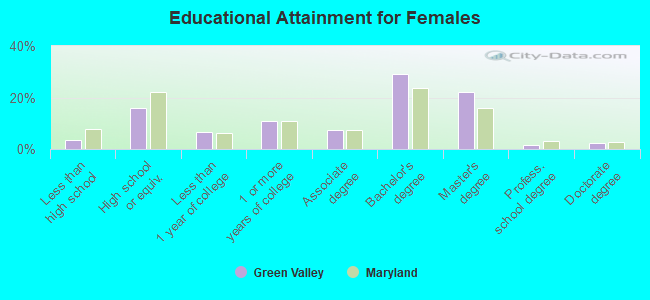
Education attainment for females 25 years and older:
- No schooling: 43
- Nursery to 4th grade: 0
- 5th and 6th grade: 18
- 7th and 8th grade: 14
- 9th grade: 9
- 10th grade: 0
- 11th grade: 0
- 12th grade, no diploma: 74
- High school graduate (or equivalency): 722
- Less than 1 year of college: 291
- Some college more than 1 year, no degree: 496
- Associate degree: 336
- Bachelor's degree: 1,309
- Master's degree: 989
- Professional school degree: 75
- Doctorate degree: 112
Housing units in structures:
- One, detached: 4,253
- One, attached: 79
- Two: 8
- 50 or more: 15
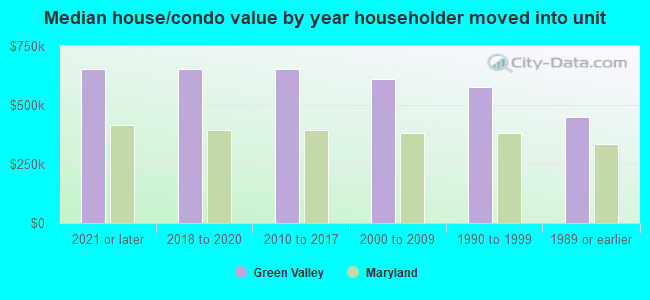
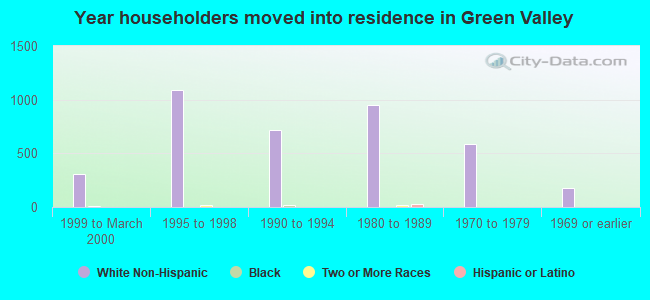
House/condo owner moved in on average 13 years ago
Renter moved in on average 4 years ago
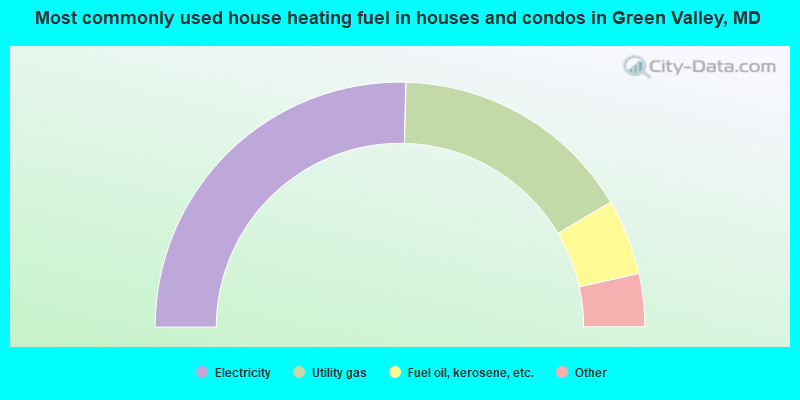
- 50.8%Electricity
- 32.2%Utility gas
- 10.0%Fuel oil, kerosene, etc.
- 3.0%Bottled, tank, or LP gas
- 1.5%Other fuel
- 0.9%Wood
- 0.8%Coal or coke
- 0.5%No fuel used
- 0.2%Solar energy
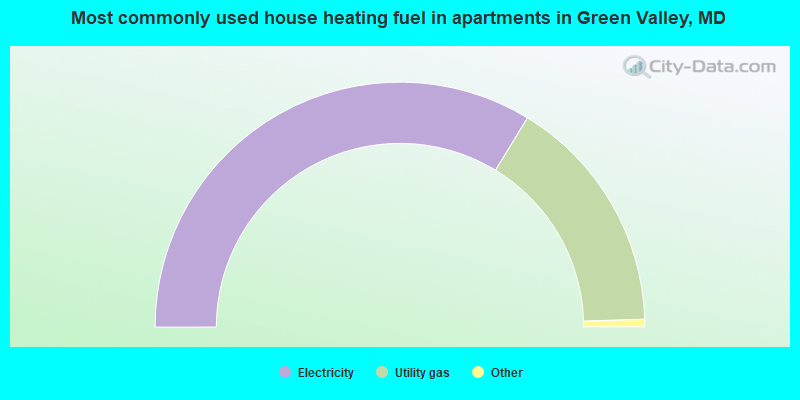
- 68.1%Electricity
- 31.9%Utility gas
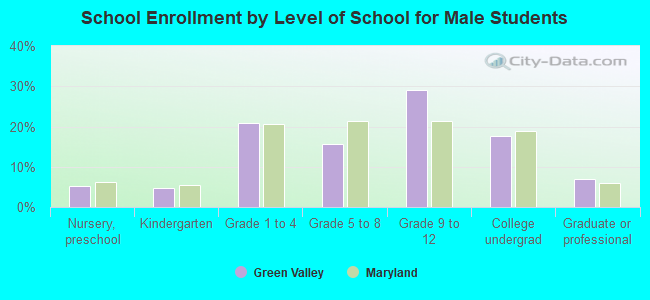
Private vs. public school enrollment:
| Here: | 14.2% |
| Maryland: | 15.2% |
| Here: | 9.7% |
| Maryland: | 14.4% |
| Here: | 36.8% |
| Maryland: | 20.2% |