Housing density: 956 houses/condos per square mile
Median price asked for vacant for-sale houses and condos in 2022 in this county: $106,377.
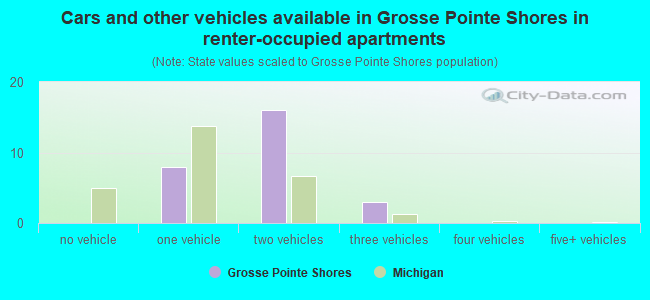
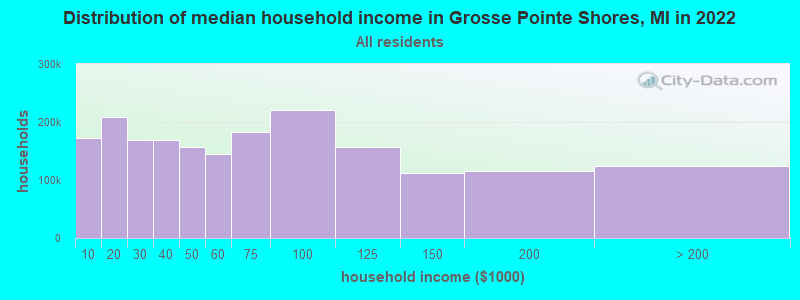
Median contract rent in 2022: over $2,000 (lower quartile is $1,019, upper quartile is over $2,000)
Median rent asked for vacant for-rent units in 2022: $188
Median gross rent in Grosse Pointe Shores, MI in 2022: over $2,000
Housing units in Grosse Pointe Shores with a mortgage: 535 (13 second mortgage, 91 home equity loan, 0 both second mortgage and home equity loan) Houses without a mortgage: 477
Compare current foreclosures near Grosse Pointe Shores, MI:
In family households: 1,498,789 (258,506 male householders, 192,145 female householders)
262,559 spouses, 587,748 children (552,691 natural, 12,983 adopted, 22,074 stepchildren), 59,857 grandchildren, 29,796 brothers or sisters, 18,494 parents, foster children, 33,994 other relatives, 46,947 non-relatives
In nonfamily households: 297,946 (119,035 male householders (98,486 living alone)), 133,063 female householders (117,224 living alone)), 45,848 nonrelatives
In group quarters: 23,849 (12,226 institutionalized population)
286,927 married couples with children.
201,029 single-parent households (28,311 men, 172,718 women).
81.8% of residents of Grosse Pointe Shores speak English at home.
2.6% of residents speak Spanish at home (65% speak English very well, 21% speak English well, 14% speak English not well).
10.0% of residents speak other Indo-European language at home (80% speak English very well, 7% speak English well, 6% speak English not well, 7% don't speak English at all).
2.4% of residents speak Asian or Pacific Island language at home (100% speak English very well).
3.3% of residents speak other language at home (72% speak English very well, 15% speak English well, 14% speak English not well).
Foreign born population: 448 (18.8%)
(104.2% of them are naturalized citizens)
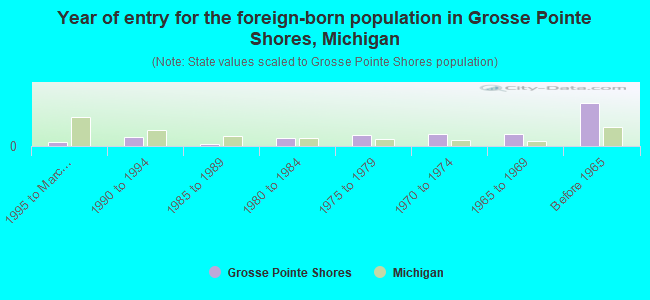
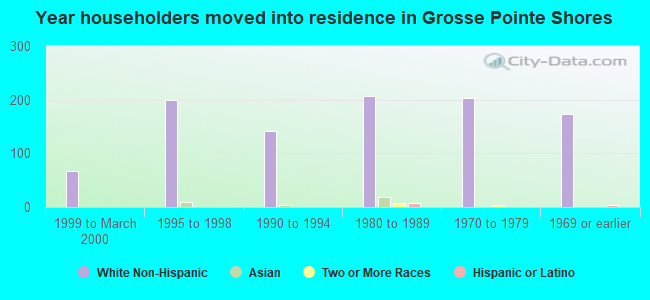
Year of entry for the foreign-born population in Grosse Pointe Shores, Michigan
151995 to March 2000
321990 to 1994
61985 to 1989
271980 to 1984
401975 to 1979
421970 to 1974
441965 to 1969
152Before 1965
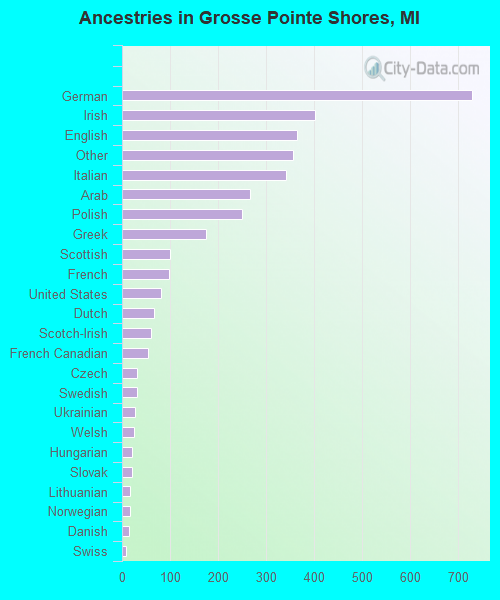
First ancestries reported:
German: 728 (20.5%)
Irish: 401 (11.3%)
English: 364 (10.2%)
Other: 357 (10.0%)
Italian: 341 (9.6%)
Arab: 266 (7.5%)
Polish: 250 (7.0%)
Greek: 175 (4.9%)
Scottish: 99 (2.8%)
French: 97 (2.7%)
United States: 81 (2.3%)
Dutch: 66 (1.9%)
Scotch-Irish: 60 (1.7%)
French Canadian: 54 (1.5%)
Czech: 31 (0.9%)
Swedish: 31 (0.9%)
Ukrainian: 27 (0.8%)
Welsh: 26 (0.7%)
Hungarian: 21 (0.6%)
Slovak: 20 (0.6%)
Lithuanian: 17 (0.5%)
Norwegian: 17 (0.5%)
Danish: 14 (0.4%)
Swiss: 8 (0.2%)
Russian: 3 (0.08%)
Most common places of birth for foreign-born residents (%):
Canada
Grosse Pointe Shores:
17.9% (64)
Michigan:
9.5% (49,515)
Lebanon
Grosse Pointe Shores:
15.1% (54)
Michigan:
3.5% (18,102)
Greece
Grosse Pointe Shores:
12.3% (44)
Michigan:
1.0% (5,044)
Philippines
Grosse Pointe Shores:
12.3% (44)
Michigan:
2.6% (13,679)
Iran
Grosse Pointe Shores:
8.1% (29)
Michigan:
0.6% (3,241)
Poland
Grosse Pointe Shores:
3.6% (13)
Michigan:
2.9% (15,303)
India
Grosse Pointe Shores:
3.1% (11)
Michigan:
6.9% (36,323)
Egypt
Grosse Pointe Shores:
3.1% (11)
Michigan:
0.4% (2,312)
Germany
Grosse Pointe Shores:
2.8% (10)
Michigan:
4.4% (22,814)
United Kingdom
Grosse Pointe Shores:
2.5% (9)
Michigan:
3.9% (20,614)
Other Western Europe
Grosse Pointe Shores:
2.5% (9)
Michigan:
0.5% (2,468)
Ukraine
Grosse Pointe Shores:
2.5% (9)
Michigan:
1.0% (5,393)
Korea
Grosse Pointe Shores:
2.0% (7)
Michigan:
3.5% (18,107)
Mexico
Grosse Pointe Shores:
2.0% (7)
Michigan:
11.2% (58,392)
Bosnia and Herzegovina
Grosse Pointe Shores:
1.7% (6)
Michigan:
1.1% (5,746)
Place of birth for U.S.-born residents:
This state: 1,973
Other state: 457
Northeast: 168
Midwest: 171
South: 111
West: 7
71% of Grosse Pointe Shores residents lived in the same house 5 years ago. Out of people who lived in different houses, 69% lived in this county. Out of people who lived in different counties, 67% lived in Michigan.
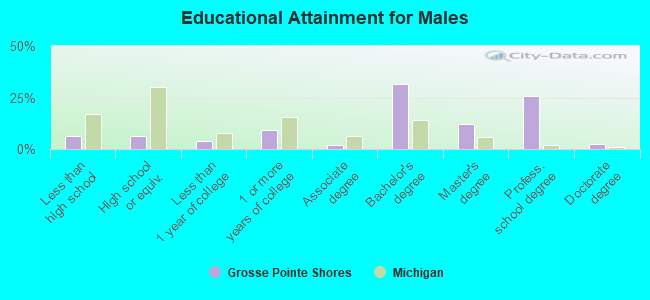
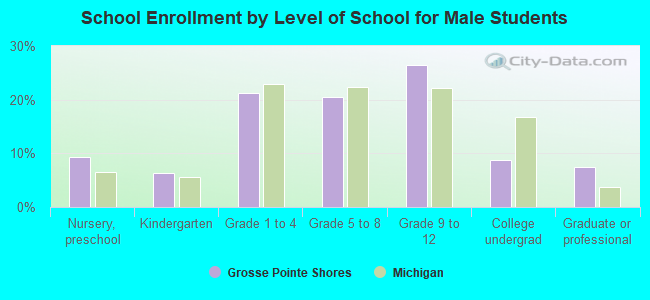
Education attainment for males 25 years and older:
No schooling: 7
Nursery to 4th grade: 0
5th and 6th grade: 7
7th and 8th grade: 17
9th grade: 4
10th grade: 9
11th grade: 0
12th grade, no diploma: 19
High school graduate (or equivalency): 61
Less than 1 year of college: 38
Some college more than 1 year, no degree: 90
Associate degree: 20
Bachelor's degree: 309
Master's degree: 119
Professional school degree: 253
Doctorate degree: 23
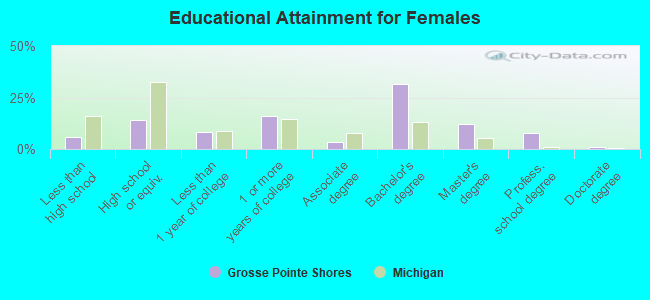
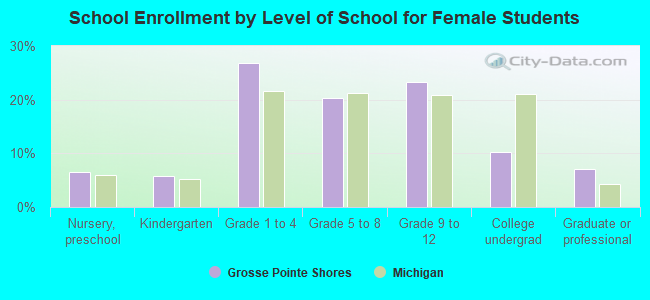
Education attainment for females 25 years and older: