Housing density: 1,700 houses/condos per square mile
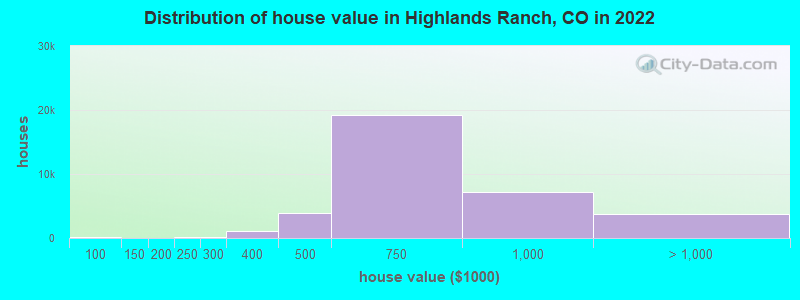
Median price asked for vacant for-sale houses and condos in 2022: $1,075,619.
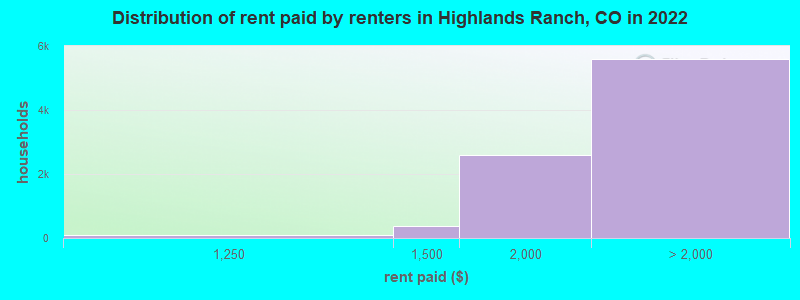
Median contract rent in 2022: over $2,000 (lower quartile is $1,835, upper quartile is over $2,000)
Median rent asked for vacant for-rent units in 2022: $4,663
Median gross rent in Highlands Ranch, CO in 2022: over $2,000
Housing units in Highlands Ranch with a mortgage: 23,420 (3,363 second mortgage, 148 home equity loan, 2,990 both second mortgage and home equity loan) Houses without a mortgage: 369
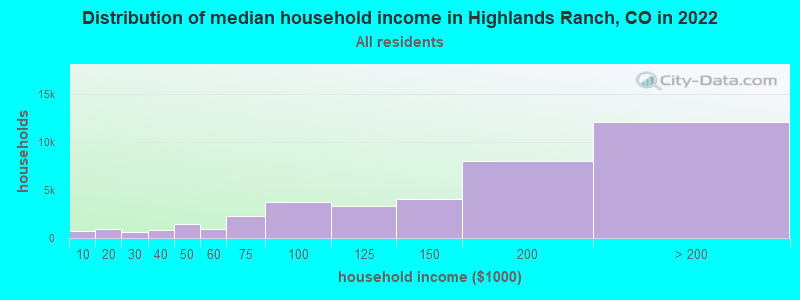
Median household income for houses/condos with a mortgage: $174,564
Median household income for apartments without a mortgage: $114,884
Median monthly housing costs: $2,276
Compare current foreclosures near Highlands Ranch, CO:
Size of family households: 12,168 2-persons, 6,820 3-persons, 6,415 4-persons, 2,740 5-persons, 853 6-persons, 407 7-or-more-persons.
Size of nonfamily households: 8,024 1-person, 1,412 2-persons.
22,401 married couples with children.
2,807 single-parent households (839 men, 1,968 women).
89.4% of residents of Highlands Ranch speak English at home.
3.3% of residents speak Spanish at home (82% speak English very well, 10% speak English well, 6% speak English not well, 1% don't speak English at all).
3.6% of residents speak other Indo-European language at home (87% speak English very well, 7% speak English well, 5% speak English not well).
3.3% of residents speak Asian or Pacific Island language at home (72% speak English very well, 20% speak English well, 6% speak English not well, 3% don't speak English at all).
0.3% of residents speak other language at home (96% speak English very well, 4% speak English well).
Foreign born population: 9,764 (9.4%)
(63.5% of them are naturalized citizens)
Percentage of workers working in this county: 59.8% Number of people working at home: 19,388 (33.3% of all workers)
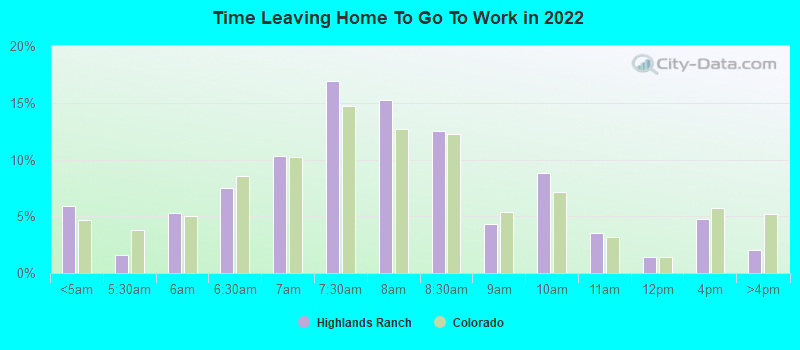
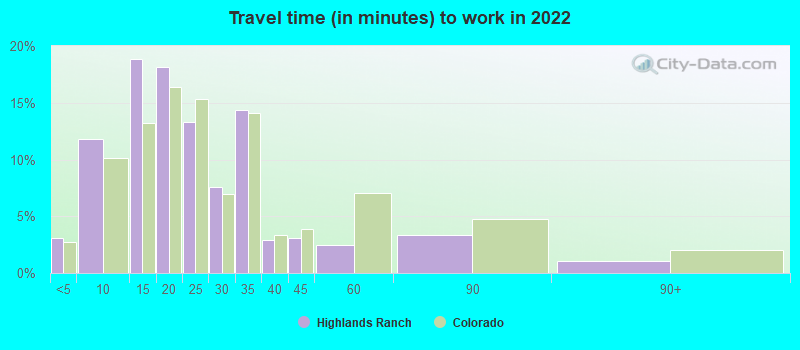
Travel time to work (commute)
Less than 5 minutes: 841
5 to 9 minutes: 2,997
10 to 14 minutes: 5,452
15 to 19 minutes: 5,577
20 to 24 minutes: 7,217
25 to 29 minutes: 2,440
30 to 34 minutes: 4,105
35 to 39 minutes: 1,631
40 to 44 minutes: 1,452
45 to 59 minutes: 3,496
60 to 89 minutes: 1,632
90 or more minutes: 450
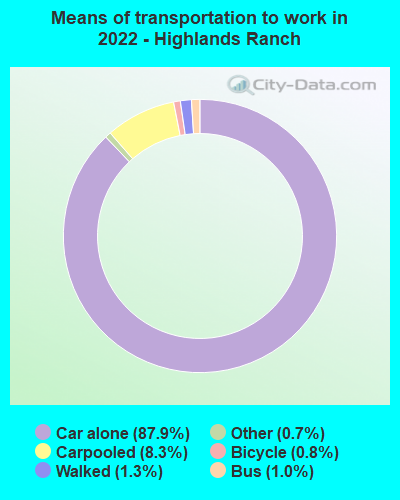
Means of transportation to work:
Drove a car alone: 21,971 (50.1%)
Carpooled: 2,348 (5.4%)
Bus: 354 (0.8%)
Subway or elevated rail: 8 (0.0%)
Taxi: 178 (0.4%)
Bicycle: 318 (0.7%)
Walked: 311 (0.7%)
Worked at home: 19,388 (44.2%)
Unemployment by race in 2022
Unemployment rate for White non-Hispanic residents
0.3%Males
3.6%Females
Unemployment rate for Black residents
7.2%Males
Unemployment rate for Asian residents
1.0%Males
5.0%Females
Unemployment rate for other race residents
2.9%Males
Unemployment rate for two or more race residents
4.6%Males
2.1%Females
Unemployment rate for Hispanic or Latino residents
8.2%Males
1.1%Females
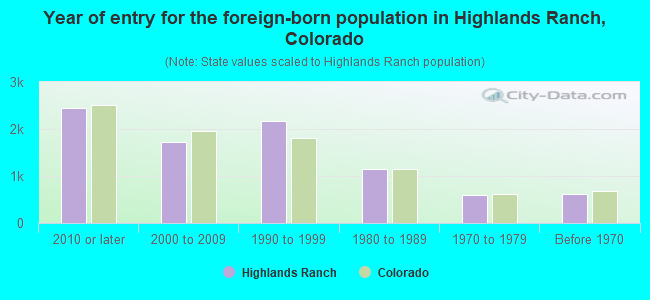
Year of entry for the foreign-born population in Highlands Ranch, Colorado
2,4502010 or later
1,7332000 to 2009
2,1761990 to 1999
1,1591980 to 1989
6031970 to 1979
608Before 1970
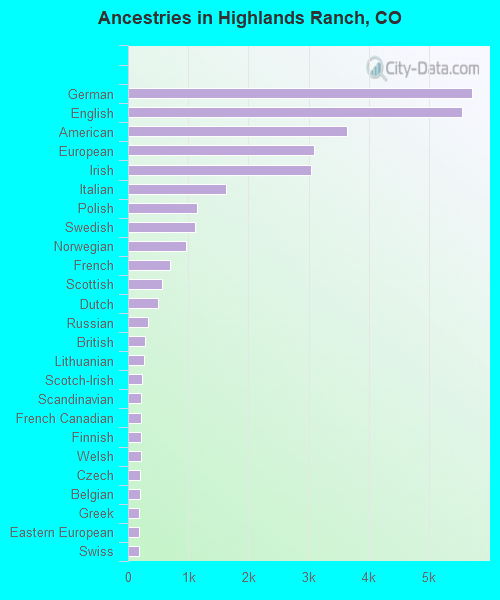
First ancestries reported:
German: 5,714 (12.8%)
English: 5,543 (12.4%)
American: 3,647 (8.2%)
European: 3,099 (7.0%)
Irish: 3,045 (6.8%)
Italian: 1,637 (3.7%)
Polish: 1,151 (2.6%)
Swedish: 1,115 (2.5%)
Norwegian: 971 (2.2%)
French: 697 (1.6%)
Scottish: 563 (1.3%)
Dutch: 506 (1.1%)
Russian: 336 (0.8%)
British: 284 (0.6%)
Lithuanian: 263 (0.6%)
Scotch-Irish: 240 (0.5%)
Scandinavian: 218 (0.5%)
French Canadian: 216 (0.5%)
Finnish: 212 (0.5%)
Welsh: 208 (0.5%)
Czech: 206 (0.5%)
Belgian: 193 (0.4%)
Greek: 191 (0.4%)
Eastern European: 186 (0.4%)
Swiss: 182 (0.4%)
Northern European: 176 (0.4%)
Hungarian: 153 (0.3%)
Ukrainian: 152 (0.3%)
Egyptian: 138 (0.3%)
Danish: 138 (0.3%)
Iranian: 118 (0.3%)
Czechoslovakian: 102 (0.2%)
Romanian: 101 (0.2%)
Portuguese: 98 (0.2%)
Canadian: 98 (0.2%)
Brazilian: 91 (0.2%)
Croatian: 67 (0.2%)
Austrian: 53 (0.1%)
South African: 32 (0.07%)
Slovak: 31 (0.07%)
German Russian: 29 (0.07%)
Yugoslavian: 29 (0.07%)
Ethiopian: 26 (0.06%)
Australian: 26 (0.06%)
Lebanese: 26 (0.06%)
Pennsylvania German: 25 (0.06%)
African: 22 (0.05%)
Slavic: 20 (0.04%)
Jamaican: 20 (0.04%)
Turkish: 20 (0.04%)
Arab: 16 (0.04%)
Jordanian: 16 (0.04%)
Haitian: 16 (0.04%)
Barbadian: 15 (0.03%)
Celtic: 9 (0.02%)
Slovene: 9 (0.02%)
Bahamian: 8 (0.02%)
Icelander: 5 (0.01%)
Estonian: 5 (0.01%)
Cajun: 5 (0.01%)
New Zealander: 3 (0.01%)
Most common places of birth for foreign-born residents (%):
India
Highlands Ranch:
18.2% (1,633)
Colorado:
4.0% (21,689)
Korea
Highlands Ranch:
9.2% (827)
Colorado:
2.9% (15,981)
Canada
Highlands Ranch:
8.4% (753)
Colorado:
2.7% (15,026)
China, excluding Hong Kong and Taiwan
Highlands Ranch:
7.0% (628)
Colorado:
3.3% (17,998)
Mexico
Highlands Ranch:
6.3% (560)
Colorado:
38.3% (209,491)
Philippines
Highlands Ranch:
5.0% (449)
Colorado:
2.3% (12,342)
Poland
Highlands Ranch:
3.8% (343)
Colorado:
0.9% (4,772)
Germany
Highlands Ranch:
2.7% (242)
Colorado:
2.5% (13,706)
Brazil
Highlands Ranch:
2.6% (237)
Colorado:
1.0% (5,365)
Other Northern Europe
Highlands Ranch:
2.6% (235)
Colorado:
0.1% (547)
Vietnam
Highlands Ranch:
2.3% (206)
Colorado:
3.0% (16,616)
United Kingdom, excluding England and Scotland
Highlands Ranch:
1.9% (173)
Colorado:
1.1% (5,799)
Iran
Highlands Ranch:
1.9% (171)
Colorado:
0.7% (3,568)
Russia
Highlands Ranch:
1.7% (152)
Colorado:
1.4% (7,860)
England
Highlands Ranch:
1.6% (144)
Colorado:
1.2% (6,672)
Place of birth for U.S.-born residents:
This state: 38,859
Other state: 52,761
Northeast: 7,703
Midwest: 18,337
South: 12,491
West: 14,230
89.3% of Highlands Ranch residents lived in the same house 1 years ago. Out of people who lived in different houses, 28.1% lived in this county. Out of people who lived in different counties, 54.1% lived in Colorado.
Highlands Ranch:
89.3%
State average:
83.6%
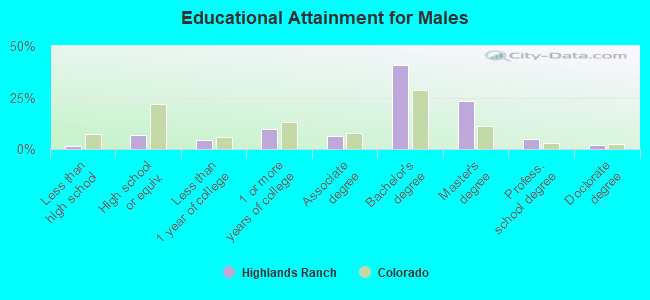
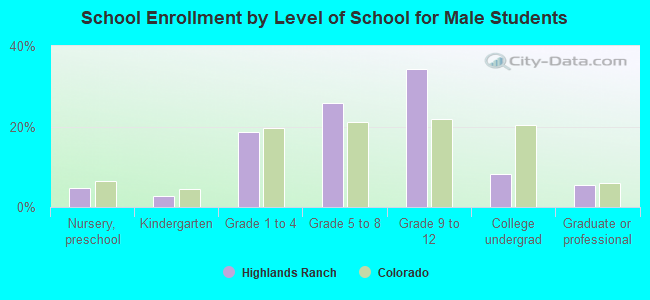
Education attainment for males 25 years and older:
No schooling: 0
Nursery to 4th grade: 56
5th and 6th grade: 0
7th and 8th grade: 165
9th grade: 0
10th grade: 187
11th grade: 74
12th grade, no diploma: 0
High school graduate (or equivalency): 2,418
Less than 1 year of college: 1,574
Some college more than 1 year, no degree: 3,428
Associate degree: 2,189
Bachelor's degree: 14,238
Master's degree: 8,088
Professional school degree: 1,636
Doctorate degree: 675
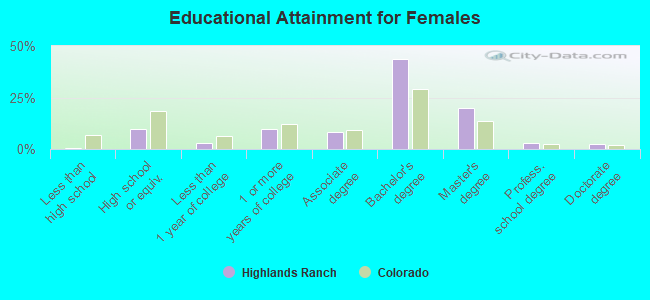
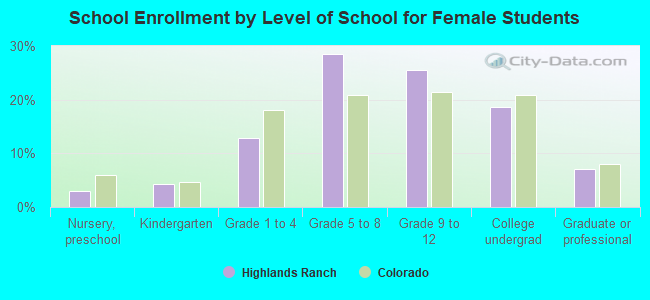
Education attainment for females 25 years and older:
No schooling: 0
Nursery to 4th grade: 0
5th and 6th grade: 58
7th and 8th grade: 0
9th grade: 0
10th grade: 0
11th grade: 0
12th grade, no diploma: 126
High school graduate (or equivalency): 3,554
Less than 1 year of college: 1,018
Some college more than 1 year, no degree: 3,414
Associate degree: 2,952
Bachelor's degree: 15,773
Master's degree: 7,180
Professional school degree: 966
Doctorate degree: 872
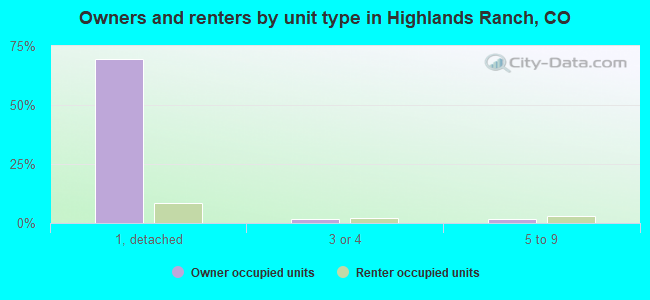
Housing units in structures:
One, detached: 30,815
One, attached: 2,412
3 or 4: 1,480
5 to 9: 1,739
10 to 19: 1,184
20 to 49: 767
50 or more: 1,593
Housing units lacking complete plumbing facilities in 2022: 0.1%
Housing units lacking complete kitchen facilities in 2022: 0.3%
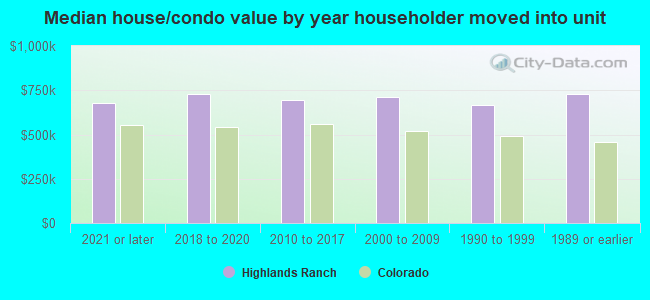
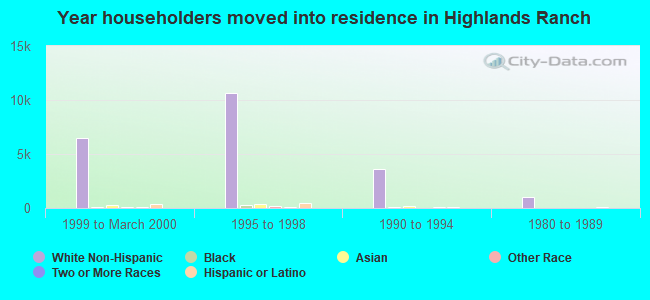
House/condo owner moved in on average 10 years ago