Kansas City, MO (Missouri) Houses and Residents
Estimated median house or condo value in 2022: $239,400 (it was $83,300 in 2000 )
Kansas City:
$239,400Missouri:
$221,200
Lower value quartile - upper value quartile: $150,800 - $356,100Mean price in 2022: Detached houses: $271,492 Here:
$271,492State:
$278,068
Townhouses or other attached units: $185,761 Here:
$185,761State:
$260,773
In 2-unit structures: $214,461 Here:
$214,461State:
$172,667
In 3-to-4-unit structures: $211,335 Here:
$211,335State:
$181,162
In 5-or-more-unit structures: $307,889 Here:
$307,889State:
$263,082
Mobile homes: $56,504 Here:
$56,504State:
$95,912
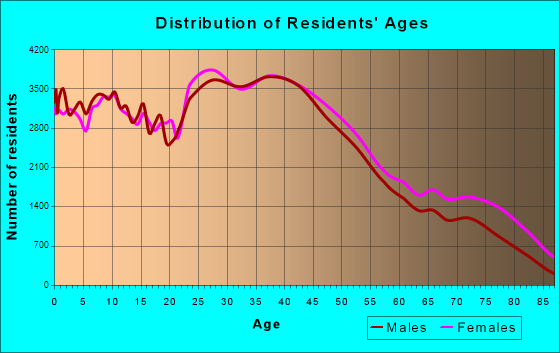
Total population: 470,800 (Urban population: 435,812, Rural population: 5,457 (161 farm, 5,296 nonfarm ))
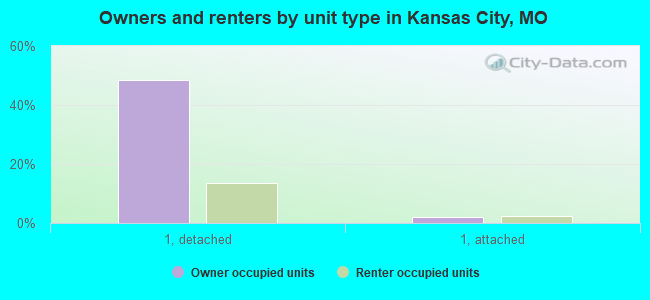
Houses: 249,272 (227,027 occupied: 122,289 owner occupied, 104,738 renter occupied )
% of renters here:
46%State:
32%
Housing density: 795 houses/condos per square mile
Median price asked for vacant for-sale houses and condos in 2022: $218,004.
Median contract rent in 2022: $959 (lower quartile is $713, upper quartile is $1,289)
Median rent asked for vacant for-rent units in 2022: $1,115
Median gross rent in Kansas City, MO in 2022: $1,152
Housing units in Kansas City with a mortgage: 76,112 (5,043 second mortgage, 132 home equity loan, 3,592 both second mortgage and home equity loan )Houses without a mortgage: 1,656
Median household income for houses/condos with a mortgage: $101,037
Median household income for apartments without a mortgage: $61,849
Median monthly housing costs: $1,160
Data:
Median house or condo value ($)
Median house or condo value ($ change since 2000)
Median house or condo value ($) - White
Median house or condo value ($) - Black or African American
Median house or condo value ($) - Asian
Median house or condo value ($) - Hispanic or Latino
Median house or condo value ($) - American Indian and Alaska Native
Median house or condo value ($) - Multirace
Median house or condo value ($) - Other Race
Median price asked for mobile homes ($)
Household density (households per square mile)
Mean house or condo value by units in structure - 1, detached ($)
Mean house or condo value by units in structure - 1, attached ($)
Mean house or condo value by units in structure - 2 ($)
Mean house or condo value by units in structure by units in structure - 3 or 4 ($)
Mean house or condo value by units in structure - 5 or more ($)
Mean house or condo value by units in structure - Boat, RV, van, etc. ($)
Mean house or condo value by units in structure - Mobile home ($)
Median contract rent ($)
Median contract rent - Lower quartile ($)
Median contract rent - Upper quartile ($)
Median gross rent ($)
Urban houses (%)
Rural houses (%)
Houses occupied (%)
Houses occupied (% change since 2000)
Houses owner occupied (%)
Houses owner occupied (% change since 2000)
Houses renter occupied (%)
Houses renter occupied (% change since 2000)
Vacant housing units - For rent (%)
Vacant housing units - For rent (% change since 2000)
Vacant housing units - For sale only (%)
Vacant housing units - For sale only (% change since 2000)
Vacant housing units - Rented or sold, not occupied (%)
Vacant housing units - Rented or sold, not occupied (% change since 2000)
Vacant housing units - For seasonal, recreational, or occasional use (%)
Vacant housing units - For seasonal, recreational, or occasional use (% change since 2000)
Vacant housing units - For migrant workers (%)
Vacant housing units - For migrant workers (% change since 2000)
Vacant housing units - Other vacant (%)
Vacant housing units - Other vacant (% change since 2000)
Median monthly housing costs ($)
Median household income for houses/condos with a mortgage ($)
Median household income for houses/condos without a mortgage ($)
Median household income ($)
Median household income ($) - White
Median household income ($) - Black or African American
Median household income ($) - Asian
Median household income ($) - Hispanic or Latino
Median household income ($) - American Indian and Alaska Native
Median household income ($) - Multirace
Median household income ($) - Other Race
Mortgage status - with mortgage (%)
Mortgage status - with second mortgage (%)
Mortgage status - with home equity loan (%)
Mortgage status - with both second mortgage and home equity loan (%)
Mortgage status - without a mortgage (%)
Median year house/condo built
Median year apartment built
Household type by relationship - Male householder living alone (%)
Household type by relationship - Male householder not living alone (%)
Household type by relationship - Female householder living alone (%)
Household type by relationship - Female householder not living alone (%)
Household type by relationship - Opposite-Sex spouse (%)
Household type by relationship - Same-Sex spouse (%)
Household type by relationship - Opposite-Sex unmarried partner (%)
Household type by relationship - Same-Sex unmarried partner (%)
Household type by relationship - In group quarters (%)
Size of family households - 2-person household (%)
Size of family households - 3-person household (%)
Size of family households - 4-person household (%)
Size of family households - 5-person household (%)
Size of family households - 6-person household (%)
Size of family households - 7-or-more-person household (%)
Size of nonfamily households - 1-person household (%)
Size of nonfamily households - 2-person household (%)
Size of nonfamily households - 3-person household (%)
Size of nonfamily households - 4-person household (%)
Size of nonfamily households - 5-person household (%)
Size of nonfamily households - 6-person household (%)
Size of nonfamily households - 7-or-moreperson household (%)
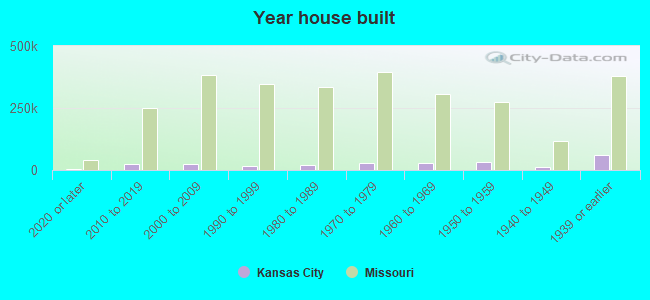
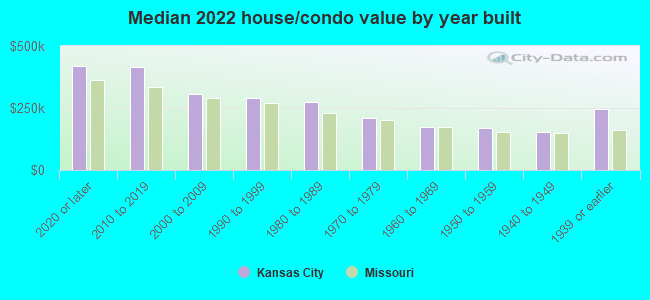
Year house built - Built 2010 or later (%)
Year house built - Built 2000 to 2009 (%)
Year house built - Built 1990 to 1999 (%)
Year house built - Built 1980 to 1989 (%)
Year house built - Built 1970 to 1979 (%)
Year house built - Built 1960 to 1969 (%)
Year house built - Built 1950 to 1959 (%)
Year house built - Built 1940 to 1949 (%)
Year house built - Built 1939 or earlier (%)
Median number of rooms in houses and condos
Median number of rooms in apartments
Median number of bedrooms in owner occupied houses
Mean number of bedrooms in owner occupied houses
Median number of bedrooms in renter occupied houses
Mean number of bedrooms in renter occupied houses
Median number of vehichles in owner occupied houses
Mean number of vehichles in owner occupied houses
Median number of vehichles in renter occupied houses
Mean number of vehichles in renter occupied houses
Rooms in owner-occupied houses - 1 room (%)
Rooms in owner-occupied houses - 2 rooms (%)
Rooms in owner-occupied houses - 3 rooms (%)
Rooms in owner-occupied houses - 4 rooms (%)
Rooms in owner-occupied houses - 5 rooms (%)
Rooms in owner-occupied houses - 6 rooms (%)
Rooms in owner-occupied houses - 7 rooms (%)
Rooms in owner-occupied houses - 8 rooms (%)
Rooms in owner-occupied houses - 9+ rooms (%)
Rooms in renter-occupied houses - 1 room (%)
Rooms in renter-occupied houses - 2 rooms (%)
Rooms in renter-occupied houses - 3 rooms (%)
Rooms in renter-occupied houses - 4 rooms (%)
Rooms in renter-occupied houses - 5 rooms (%)
Rooms in renter-occupied houses - 6 rooms (%)
Rooms in renter-occupied houses - 7 rooms (%)
Rooms in renter-occupied houses - 8 rooms (%)
Rooms in renter-occupied houses - 9+ rooms (%)
Bedrooms in owner-occupied houses - no bedrooms (%)
Bedrooms in owner-occupied houses - 1 bedroom (%)
Bedrooms in owner-occupied houses - 2 bedrooms (%)
Bedrooms in owner-occupied houses - 3 bedrooms (%)
Bedrooms in owner-occupied houses - 4 bedrooms (%)
Bedrooms in owner-occupied houses - 5+ bedrooms (%)
Bedrooms in renter-occupied houses - no bedrooms (%)
Bedrooms in renter-occupied houses - 1 bedroom (%)
Bedrooms in renter-occupied houses - 2 bedrooms (%)
Bedrooms in renter-occupied houses - 3 bedrooms (%)
Bedrooms in renter-occupied houses - 4 bedrooms (%)
Bedrooms in renter-occupied houses - 5+ bedrooms (%)
Vehicles available in owner-occupied houses - no vehicle available (%)
Vehicles available in owner-occupied houses - 1 vehicle available(%)
Vehicles available in owner-occupied houses - 2 Vehicles available (%)
Vehicles available in owner-occupied houses - 3 Vehicles available (%)
Vehicles available in owner-occupied houses - 4 Vehicles available (%)
Vehicles available in owner-occupied houses - 5+ Vehicles available (%)
Vehicles available in renter-occupied houses - no vehicle available (%)
Vehicles available in renter-occupied houses - 1 vehicle available (%)
Vehicles available in renter-occupied houses - 2 Vehicles available (%)
Vehicles available in renter-occupied houses - 3 Vehicles available (%)
Vehicles available in renter-occupied houses - 4 Vehicles available (%)
Vehicles available in renter-occupied houses - 5+ Vehicles available (%)
Housing units in structures - 1, detached (%)
Housing units in structures - 1, attached (%)
Housing units in structures - 2 (%)
Housing units in structures - 3 or 4 (%)
Housing units in structures - 5 to 9 (%)
Housing units in structures - 10 to 19 (%)
Housing units in structures - 20 to 49 (%)
Housing units in structures - 50 or more (%)
Housing units in structures - Mobile home (%)
Housing units in structures - Boat, RV, van, etc. (%)
Housing units in structures - Owners - 1, detached (%)
Housing units in structures - Owners - 1, attached (%)
Housing units in structures - Owners - 2 (%)
Housing units in structures - Owners - 3 or 4 (%)
Housing units in structures - Owners - 5 to 9 (%)
Housing units in structures - Owners - 10 to 19 (%)
Housing units in structures - Owners - 20 to 49 (%)
Housing units in structures - Owners - 50 or more (%)
Housing units in structures - Owners - Mobile home (%)
Housing units in structures - Owners - Boat, RV, van, etc. (%)
Housing units in structures - Renters - 1, detached (%)
Housing units in structures - Renters - 1, attached (%)
Housing units in structures - Renters - 2 (%)
Housing units in structures - Renters - 3 or 4 (%)
Housing units in structures - Renters - 5 to 9 (%)
Housing units in structures - Renters - 10 to 19 (%)
Housing units in structures - Renters - 20 to 49 (%)
Housing units in structures - Renters - 50 or more (%)
Housing units in structures - Renters - Mobile home (%)
Housing units in structures - Renters - Boat, RV, van, etc. (%)
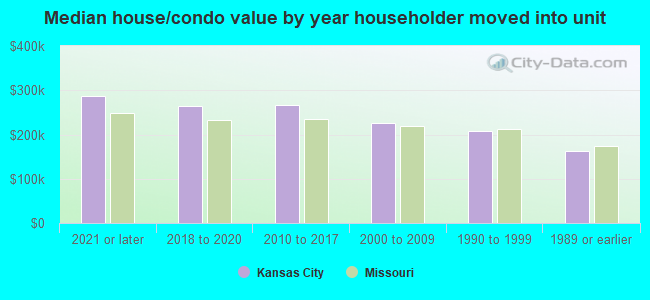
House/condo owner moved in on average (years ago)
Renter moved in on average (years ago)
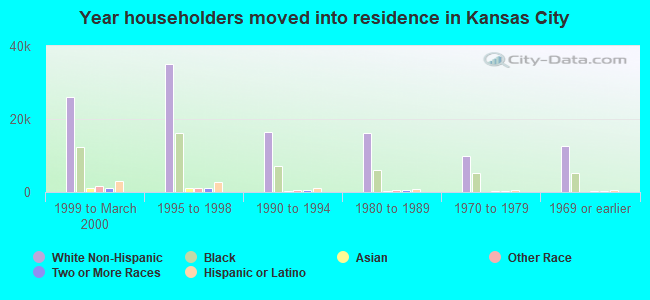
Year householder moved into unit - Moved in 1999 to March 2000 (%)
Year householder moved into unit - Moved in 1999 to March 2000 (%) - White
Year householder moved into unit - Moved in 1999 to March 2000 (%) - Black or African American
Year householder moved into unit - Moved in 1999 to March 2000 (%) - Asian
Year householder moved into unit - Moved in 1999 to March 2000 (%) - Hispanic or Latino
Year householder moved into unit - Moved in 1999 to March 2000 (%) - American Indian and Alaska Native
Year householder moved into unit - Moved in 1999 to March 2000 (%) - Multirace
Year householder moved into unit - Moved in 1999 to March 2000 (%) - Other Race
Year householder moved into unit - Moved in 1995 to 1998 (%)
Year householder moved into unit - Moved in 1995 to 1998 (%) - White
Year householder moved into unit - Moved in 1995 to 1998 (%) - Black or African American
Year householder moved into unit - Moved in 1995 to 1998 (%) - Asian
Year householder moved into unit - Moved in 1995 to 1998 (%) - Hispanic or Latino
Year householder moved into unit - Moved in 1995 to 1998 (%) - American Indian and Alaska Native
Year householder moved into unit - Moved in 1995 to 1998 (%) - Multirace
Year householder moved into unit - Moved in 1995 to 1998 (%) - Other Race
Year householder moved into unit - Moved in 1990 to 1994 (%)
Year householder moved into unit - Moved in 1990 to 1994 (%) - White
Year householder moved into unit - Moved in 1990 to 1994 (%) - Black or African American
Year householder moved into unit - Moved in 1990 to 1994 (%) - Asian
Year householder moved into unit - Moved in 1990 to 1994 (%) - Hispanic or Latino
Year householder moved into unit - Moved in 1990 to 1994 (%) - American Indian and Alaska Native
Year householder moved into unit - Moved in 1990 to 1994 (%) - Multirace
Year householder moved into unit - Moved in 1990 to 1994 (%) - Other Race
Year householder moved into unit - Moved in 1980 to 1989 (%)
Year householder moved into unit - Moved in 1980 to 1989 (%) - White
Year householder moved into unit - Moved in 1980 to 1989 (%) - Black or African American
Year householder moved into unit - Moved in 1980 to 1989 (%) - Asian
Year householder moved into unit - Moved in 1980 to 1989 (%) - Hispanic or Latino
Year householder moved into unit - Moved in 1980 to 1989 (%) - American Indian and Alaska Native
Year householder moved into unit - Moved in 1980 to 1989 (%) - Multirace
Year householder moved into unit - Moved in 1980 to 1989 (%) - Other Race
Year householder moved into unit - Moved in 1970 to 1979 (%)
Year householder moved into unit - Moved in 1970 to 1979 (%) - White
Year householder moved into unit - Moved in 1970 to 1979 (%) - Black or African American
Year householder moved into unit - Moved in 1970 to 1979 (%) - Asian
Year householder moved into unit - Moved in 1970 to 1979 (%) - Hispanic or Latino
Year householder moved into unit - Moved in 1970 to 1979 (%) - American Indian and Alaska Native
Year householder moved into unit - Moved in 1970 to 1979 (%) - Multirace
Year householder moved into unit - Moved in 1970 to 1979 (%) - Other Race
Year householder moved into unit - Moved in 1969 or earlier (%)
Year householder moved into unit - Moved in 1969 or earlier (%) - White
Year householder moved into unit - Moved in 1969 or earlier (%) - Black or African American
Year householder moved into unit - Moved in 1969 or earlier (%) - Asian
Year householder moved into unit - Moved in 1969 or earlier (%) - Hispanic or Latino
Year householder moved into unit - Moved in 1969 or earlier (%) - American Indian and Alaska Native
Year householder moved into unit - Moved in 1969 or earlier (%) - Multirace
Year householder moved into unit - Moved in 1969 or earlier (%) - Other Race
Housing units lacking complete plumbing facilities (%)
Housing units lacking complete kitchen facilities (%)
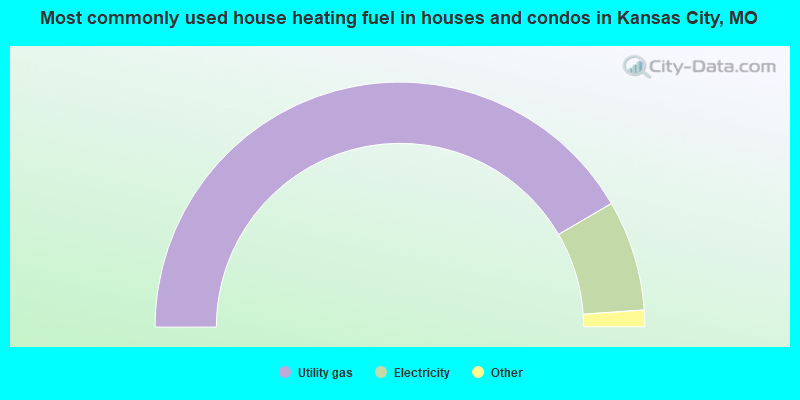
House heating fuel used in houses and condos - Utility gas (%)
House heating fuel used in houses and condos - Bottled, tank, or LP gas (%)
House heating fuel used in houses and condos - Electricity (%)
House heating fuel used in houses and condos - Fuel oil, kerosene, etc. (%)
House heating fuel used in houses and condos - Coal or coke (%)
House heating fuel used in houses and condos - Wood (%)
House heating fuel used in houses and condos - Solar energy (%)
House heating fuel used in houses and condos - Other fuel (%)
House heating fuel used in houses and condos - No fuel used (%)
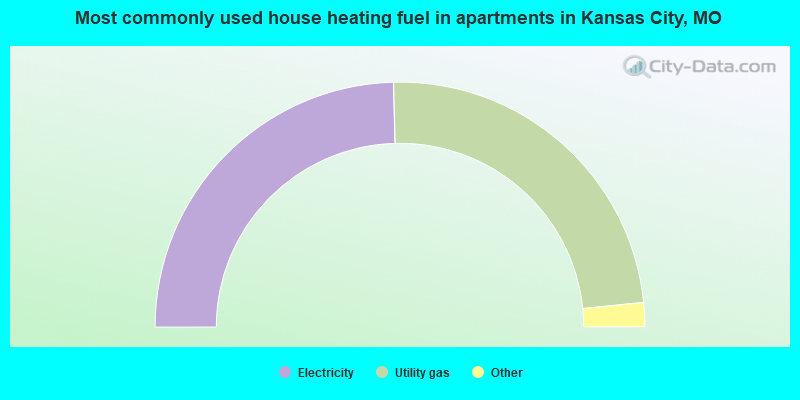
House heating fuel used in apartments - Utility gas (%)
House heating fuel used in apartments - Bottled, tank, or LP gas (%)
House heating fuel used in apartments - Electricity (%)
House heating fuel used in apartments - Fuel oil, kerosene, etc. (%)
House heating fuel used in apartments - Coal or coke (%)
House heating fuel used in apartments - Wood (%)
House heating fuel used in apartments - Solar energy (%)
House heating fuel used in apartments - Other fuel (%)
House heating fuel used in apartments - No fuel used (%)
Median year house/condo built: 1966Median year apartment built: 1973Household type by relationship:
Households: 509,247
Male householders: 107,493 (42,445 living alone ), Female householders: 119,534 (46,616 living alone )79,340 spouses (77,684 opposite-sex spouses ), 18,357 unmarried partners , (17,040 opposite-sex unmarried partners ), 132,099 children (123,114 natural , 3,184 adopted , 5,801 stepchildren ), 10,017 grandchildren , 5,621 brothers or sisters , 6,352 parents , 148 foster children , 4,770 other relatives , 16,877 non-relatives In group quarters: 8,639
Size of family households: 55,127 2-persons , 26,468 3-persons , 20,295 4-persons , 9,168 5-persons , 4,781 6-persons , 1,738 7-or-more-persons .
Size of nonfamily households: 89,061 1-person , 17,847 2-persons , 1,593 3-persons , 859 4-persons , 90 5-persons .
59,092 married couples with children. single-parent households (8,033 men , 31,625 women ).
88.0% of residents of Kansas City speak English at home. of residents speak Spanish at home (59% speak English very well , 18% speak English well , 16% speak English not well , 8% don't speak English at all ).of residents speak other Indo-European language at home (76% speak English very well , 13% speak English well , 6% speak English not well , 4% don't speak English at all ).of residents speak Asian or Pacific Island language at home (51% speak English very well , 28% speak English well , 18% speak English not well , 3% don't speak English at all ).of residents speak other language at home (71% speak English very well , 13% speak English well , 14% speak English not well , 3% don't speak English at all ).
Foreign born population: 38,905 (7.6%)of them are naturalized citizens )
Median number of rooms in houses and condos:
Median number of rooms in apartments
Owner-occupied Renter-occupied
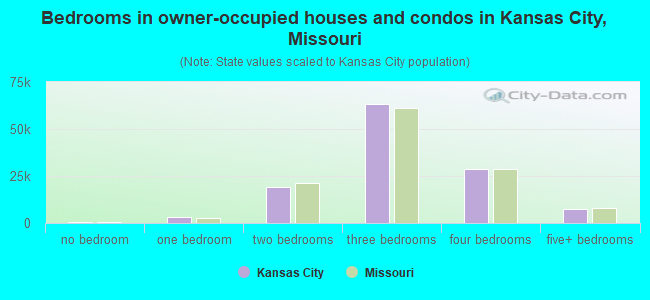
Bedrooms in owner-occupied houses and condos in Kansas City, Missouri
683 no bedroom 3,077 1 bedroom 19,212 2 bedrooms 63,298 3 bedrooms 28,610 4 bedrooms 7,409 5+ bedrooms
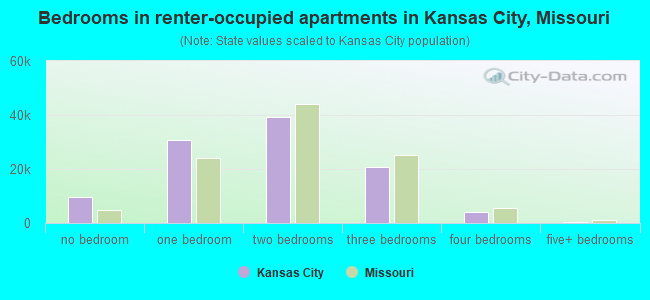
Bedrooms in renter-occupied apartments in Kansas City, Missouri
9,592 no bedroom 30,913 1 bedroom 39,124 2 bedrooms 20,582 3 bedrooms 4,185 4 bedrooms 342 5+ bedrooms
Owner-occupied Renter-occupied
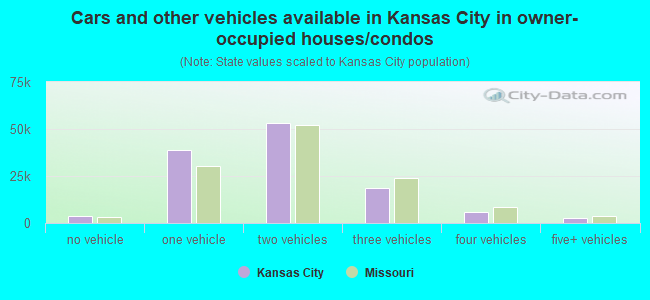
Cars and other vehicles available in Kansas City in owner-occupied houses/condos
3,937 no vehicle 38,735 1 vehicle 53,008 2 vehicles 18,365 3 vehicles 5,839 4 vehicles 2,405 5+ vehicles
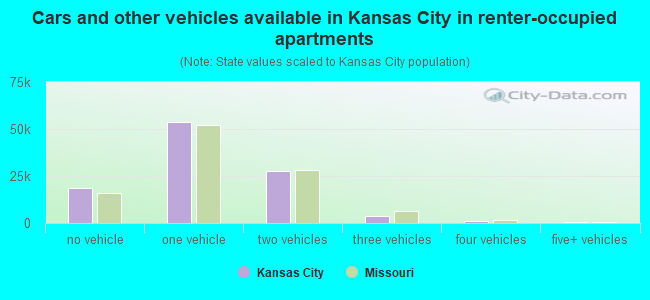
Cars and other vehicles available in Kansas City in renter-occupied apartments
18,447 no vehicle 53,591 1 vehicle 27,640 2 vehicles 3,847 3 vehicles 881 4 vehicles 332 5+ vehicles
Owner-occupied Renter-occupied
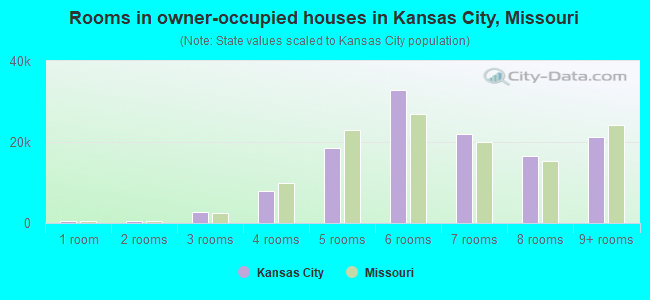
Rooms in owner-occupied houses in Kansas City, Missouri
578 1 room 399 2 rooms 2,636 3 rooms 7,838 4 rooms 18,396 5 rooms 32,754 6 rooms 21,983 7 rooms 16,439 8 rooms 21,266 9+ rooms
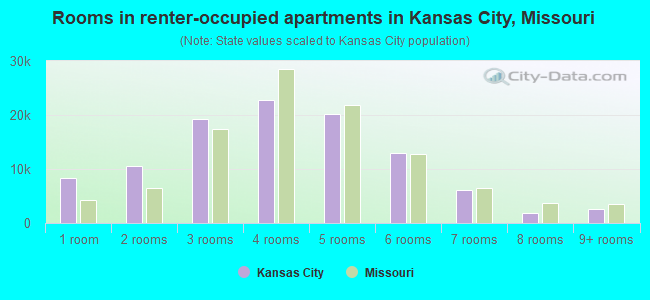
Rooms in renter-occupied apartments in Kansas City, Missouri
8,320 1 room 10,474 2 rooms 19,290 3 rooms 22,861 4 rooms 20,264 5 rooms 12,999 6 rooms 6,137 7 rooms 1,872 8 rooms 2,521 9+ rooms
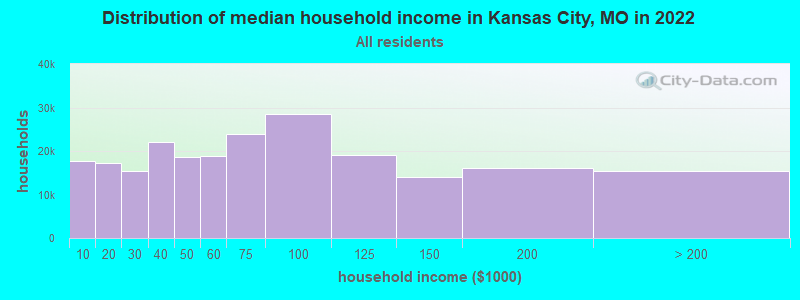
Kansas City, MO household income distribution 17,640 Less than $10,00017,175 $10,000 to $19,99915,461 $20,000 to $29,99922,066 $30,000 to $39,99918,565 $40,000 to $49,99918,797 $50,000 to $59,99923,991 $60,000 to $74,99928,615 $75,000 to $99,99919,050 $100,000 to $124,99914,101 $125,000 to $149,99916,073 $150,000 to $199,99915,493 $200,000 or more
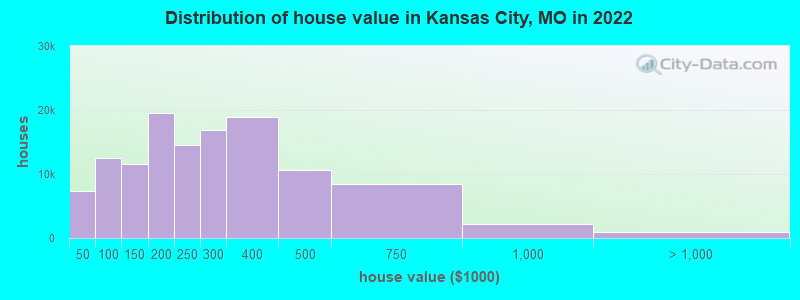
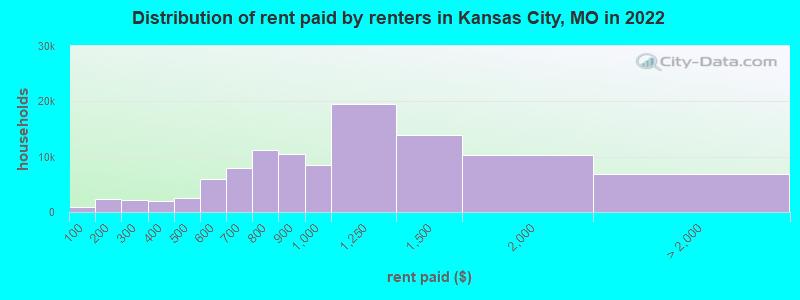
Home value of owner - occupied houses in 2022 in Kansas City, MO 1,110 Less than $10,000973 $10,000 to $14,999681 $15,000 to $19,999944 $20,000 to $24,999649 $25,000 to $29,999921 $30,000 to $34,999856 $35,000 to $39,9991,147 $40,000 to $49,9992,417 $50,000 to $59,9992,302 $60,000 to $69,9991,926 $70,000 to $79,9992,630 $80,000 to $89,9992,033 $90,000 to $99,9996,426 $100,000 to $124,9995,202 $125,000 to $149,99910,634 $150,000 to $174,9998,886 $175,000 to $199,99914,482 $200,000 to $249,99916,933 $250,000 to $299,99918,840 $300,000 to $399,99910,661 $400,000 to $499,9998,460 $500,000 to $749,9992,161 $750,000 to $999,999508 $1,000,000 to $1,499,999228 $1,500,000 to $1,999,999279 $2,000,000 or moreRent paid by renters in 2022 in Kansas City, MO 931 Less than $100633 $100 to $1491,664 $150 to $1991,426 $200 to $249814 $250 to $2991,531 $300 to $349535 $350 to $3991,454 $400 to $4491,001 $450 to $4993,226 $500 to $5492,722 $550 to $5993,735 $600 to $6494,166 $650 to $6995,415 $700 to $7495,749 $750 to $79910,485 $800 to $8998,555 $900 to $99919,527 $1,000 to $1,24913,937 $1,250 to $1,49910,356 $1,500 to $1,9992,193 $2,000 to $2,499200 $2,500 to $2,999271 $3,000 to $3,499518 $3,500 or more3,694 No cash rent
Percentage of workers working in this county: 65.8%Number of people working at home: 49,862 (18.9% of all workers )
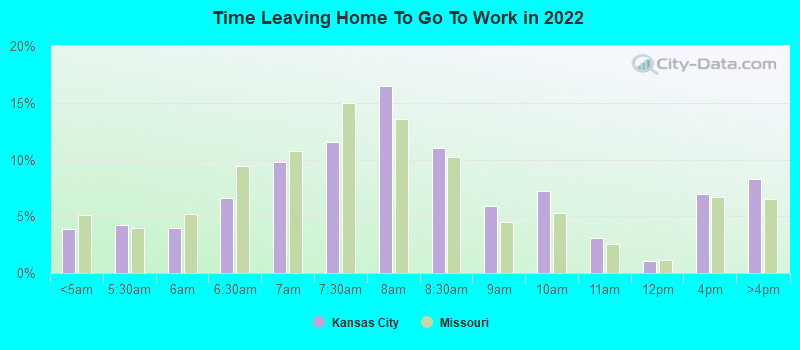
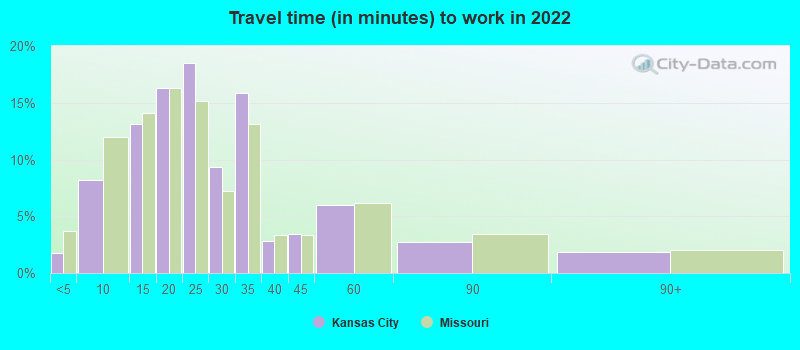
Travel time to work (commute)
Less than 5 minutes: 4,9595 to 9 minutes: 20,77110 to 14 minutes: 32,81015 to 19 minutes: 44,93520 to 24 minutes: 42,25125 to 29 minutes: 17,95630 to 34 minutes: 25,16835 to 39 minutes: 4,17740 to 44 minutes: 5,09245 to 59 minutes: 9,05460 to 89 minutes: 2,93790 or more minutes: 3,292
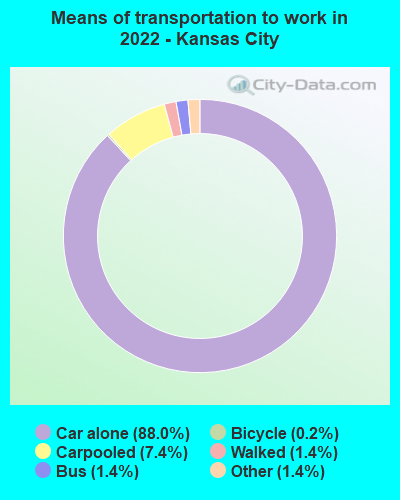
Means of transportation to work:
Drove a car alone: 234,403 (74.2%)Carpooled: 19,827 (6.3%)Bus : 3,808 (1.2%)Light rail, streetcar or trolley : 209 (0.1%)Taxi: 3,776 (1.2%)Bicycle: 523 (0.2%)Walked: 3,694 (1.2%)Worked at home: 49,862 (15.8%)
Unemployment by race in 2022
Unemployment rate for White non-Hispanic residents 2.2% Males1.9% FemalesUnemployment rate for Black residents 5.8% Males7.7% FemalesUnemployment rate for Asian residents 7.4% Males1.9% FemalesUnemployment rate for other race residents 4.6% Males4.4% FemalesUnemployment rate for two or more race residents 3.6% Males5.2% FemalesUnemployment rate for Hispanic or Latino residents 3.6% Males3.4% Females
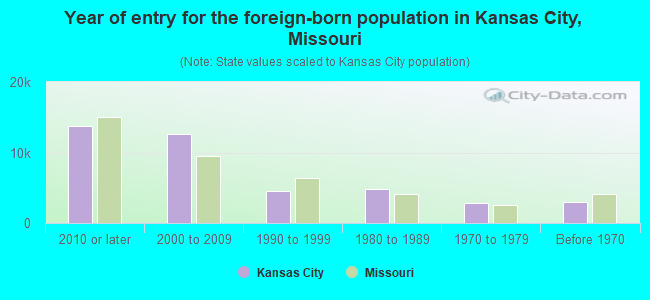
Year of entry for the foreign-born population in Kansas City, Missouri
13,789 2010 or later 12,692 2000 to 2009 4,495 1990 to 1999 4,821 1980 to 1989 2,864 1970 to 1979 2,915 Before 1970
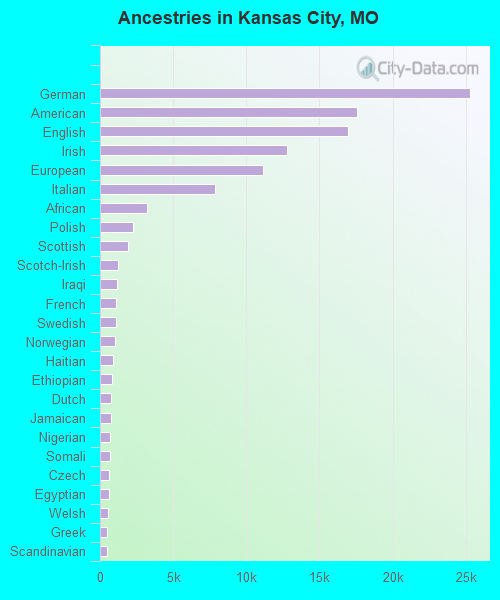
First ancestries reported:
German: 25,318 (9.5%)
American: 17,555 (6.6%)
English: 16,958 (6.4%)
Irish: 12,798 (4.8%)
European: 11,155 (4.2%)
Italian: 7,875 (3.0%)
African: 3,242 (1.2%)
Polish: 2,260 (0.8%)
Scottish: 1,887 (0.7%)
Scotch-Irish: 1,236 (0.5%)
Iraqi: 1,144 (0.4%)
French: 1,111 (0.4%)
Swedish: 1,076 (0.4%)
Norwegian: 1,039 (0.4%)
Haitian: 912 (0.3%)
Ethiopian: 805 (0.3%)
Dutch: 783 (0.3%)
Jamaican: 749 (0.3%)
Nigerian: 699 (0.3%)
Somali: 690 (0.3%)
Czech: 632 (0.2%)
Egyptian: 588 (0.2%)
Welsh: 514 (0.2%)
Greek: 499 (0.2%)
Scandinavian: 482 (0.2%)
Arab: 455 (0.2%)
Eastern European: 419 (0.2%)
Danish: 408 (0.2%)
Iranian: 392 (0.1%)
Ukrainian: 390 (0.1%)
Northern European: 381 (0.1%)
Croatian: 371 (0.1%)
Canadian: 358 (0.1%)
British: 358 (0.1%)
Belgian: 352 (0.1%)
Lebanese: 324 (0.1%)
Palestinian: 306 (0.1%)
Moroccan: 303 (0.1%)
French Canadian: 288 (0.1%)
Yugoslavian: 288 (0.1%)
Russian: 281 (0.1%)
Syrian: 272 (0.1%)
Kenyan: 242 (0.09%)
Afghan: 236 (0.09%)
Turkish: 229 (0.09%)
Ghanaian: 189 (0.07%)
Ugandan: 175 (0.07%)
Sierra Leonean: 163 (0.06%)
Swiss: 139 (0.05%)
Jordanian: 122 (0.05%)
Australian: 112 (0.04%)
Lithuanian: 110 (0.04%)
Austrian: 98 (0.04%)
Icelander: 93 (0.03%)
Czechoslovakian: 91 (0.03%)
Trinidadian and Tobagonian: 89 (0.03%)
Pennsylvania German: 85 (0.03%)
German Russian: 85 (0.03%)
Slovak: 78 (0.03%)
Sudanese: 78 (0.03%)
South African: 76 (0.03%)
Romanian: 75 (0.03%)
Brazilian: 72 (0.03%)
Liberian: 70 (0.03%)
Bahamian: 57 (0.02%)
Luxembourger: 54 (0.02%)
Slavic: 53 (0.02%)
Finnish: 46 (0.02%)
Hungarian: 43 (0.02%)
Armenian: 37 (0.01%)
Portuguese: 32 (0.01%)
Slovene: 32 (0.01%)
New Zealander: 31 (0.01%)
Guyanese: 28 (0.01%)
British West Indian: 21 (0.01%)
West Indian: 21 (0.01%)
Albanian: 20 (0.01%)
Most common places of birth for foreign-born residents (%): Mexico Kansas City:
24.5% (9,906)Missouri:
14.9% (38,568)
Honduras Kansas City:
5.2% (2,100)Missouri:
2.1% (5,346)
Guatemala Kansas City:
4.0% (1,603)Missouri:
2.8% (7,146)
Cuba Kansas City:
3.7% (1,480)Missouri:
1.1% (2,867)
Vietnam Kansas City:
3.2% (1,282)Missouri:
4.1% (10,700)
Philippines Kansas City:
3.1% (1,275)Missouri:
4.2% (10,873)
India Kansas City:
3.1% (1,260)Missouri:
8.9% (22,932)
El Salvador Kansas City:
3.1% (1,244)Missouri:
1.5% (3,926)
Kenya Kansas City:
3.0% (1,222)Missouri:
1.7% (4,518)
Iraq Kansas City:
2.3% (925)Missouri:
1.4% (3,509)
Sudan Kansas City:
2.1% (845)Missouri:
0.3% (772)
Nigeria Kansas City:
2.0% (827)Missouri:
1.4% (3,640)
China, excluding Hong Kong and Taiwan Kansas City:
2.0% (821)Missouri:
6.6% (17,002)
Pakistan Kansas City:
1.8% (748)Missouri:
1.2% (3,209)
Congo Kansas City:
1.8% (746)Missouri:
0.3% (657)
Jamaica Kansas City:
1.8% (711)Missouri:
0.9% (2,341)
Ethiopia Kansas City:
1.6% (660)Missouri:
1.1% (2,751)
Place of birth for U.S.-born residents:
This state: 271,039Other state: 194,453Northeast: 10,996Midwest: 109,458South: 46,070West: 27,929 82.5% of Kansas City residents lived in the same house 1 years ago.
Out of people who lived in different houses, 33.7% lived in this county.
Out of people who lived in different counties, 34.8% lived in Missouri.
Kansas City:
82.5%State average:
87.1%
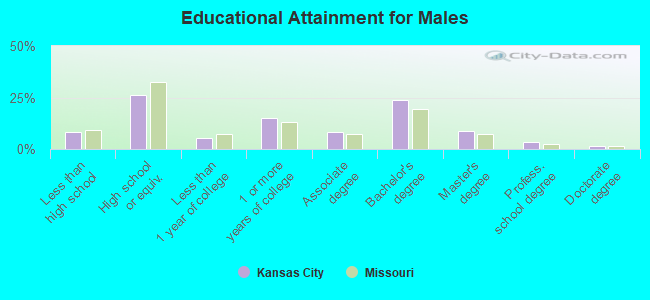
Education attainment for males 25 years and older:
No schooling: 2,551Nursery to 4th grade: 4075th and 6th grade: 1,1717th and 8th grade: 1,1059th grade: 1,65210th grade: 1,34811th grade: 2,62912th grade, no diploma: 2,701High school graduate (or equivalency): 43,368Less than 1 year of college: 8,893Some college more than 1 year, no degree: 25,042Associate degree: 13,635Bachelor's degree: 39,724Master's degree: 14,858Professional school degree: 5,468Doctorate degree: 2,181
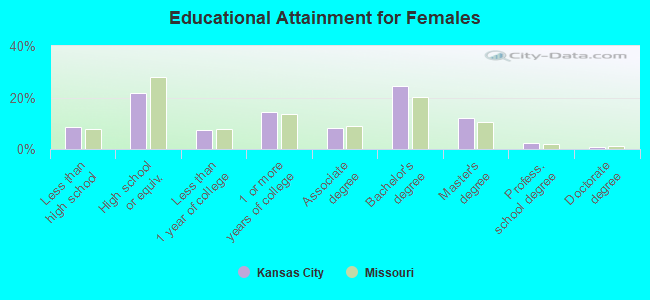
Education attainment for females 25 years and older:
No schooling: 4,059Nursery to 4th grade: 4185th and 6th grade: 1,4407th and 8th grade: 9789th grade: 1,34810th grade: 2,25411th grade: 2,67912th grade, no diploma: 2,183High school graduate (or equivalency): 40,039Less than 1 year of college: 13,747Some college more than 1 year, no degree: 26,409Associate degree: 15,271Bachelor's degree: 45,089Master's degree: 22,032Professional school degree: 3,926Doctorate degree: 1,614
Housing units in structures:
One, detached: 152,078One, attached: 10,369Two: 6,1193 or 4: 8,2535 to 9: 15,78810 to 19: 16,80520 to 49: 14,64650 or more: 24,003Mobile homes: 1,211Median worth of mobile homes: $18,000
Housing units lacking complete plumbing facilities in 2022: 2.1%Housing units lacking complete kitchen facilities in 2022: 2.8%House/condo owner moved in on average 10 years ago
Renter moved in on average 2 years ago
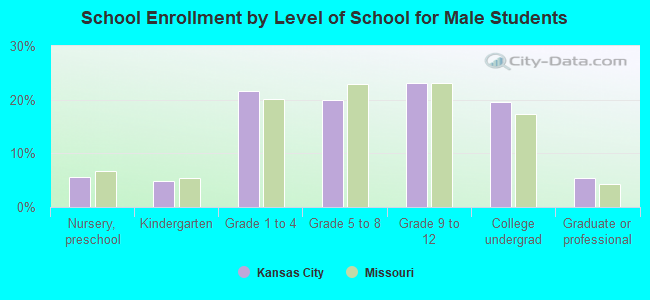
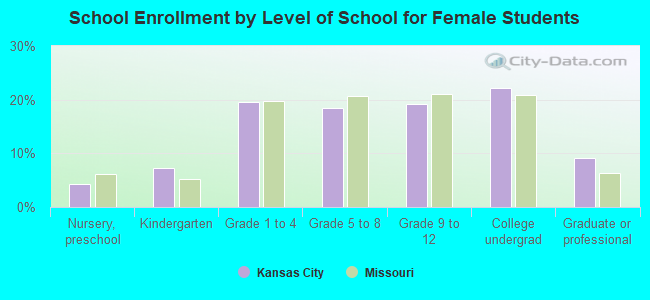
Private vs. public school enrollment:
Students in private schools in grades 1 to 8 (elementary and middle school): 7,208 Students in private schools in grades 9 to 12 (high school): 3,345 Students in private undergraduate colleges: 7,200