La Casita-Garciasville, TX (Texas) Houses and Residents
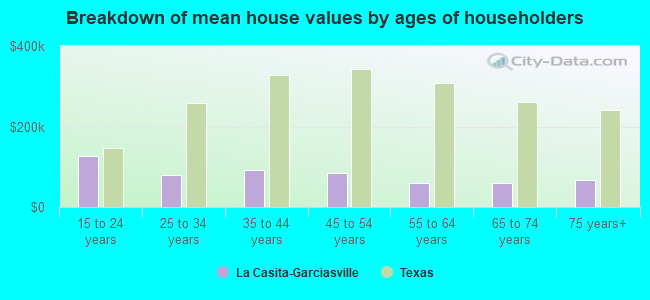
| La Casita-Garciasville: | $77,295 |
| Texas: | $275,400 |
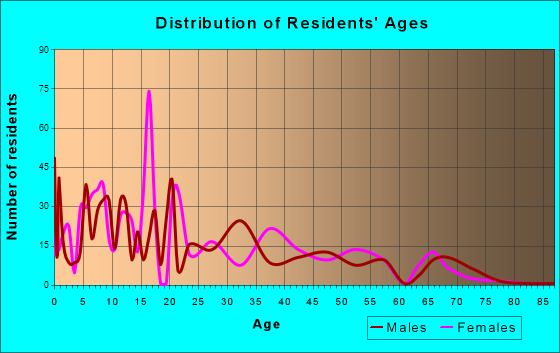
Total population: 2,465 (Urban population: 1,425 (all inside urban clusters), Rural population: 751 (all nonfarm))
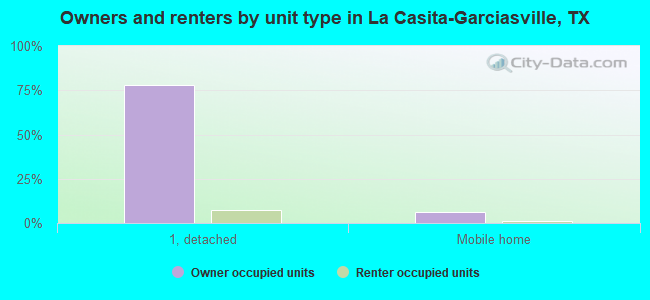
Houses: 679 (583 occupied: 490 owner occupied, 93 renter occupied)
| % of renters here: | 16% |
| State: | 38% |
Housing density: 156 houses/condos per square mile
Median price asked for vacant for-sale houses and condos in 2022 in this county: $100,784.
Median contract rent in 2022: $575 (lower quartile is $431, upper quartile is $620)
Median gross rent in La Casita-Garciasville, TX in 2022: $704
Housing units in La Casita-Garciasville with a mortgage: 33 (0 second mortgage, 0 home equity loan, 0 both second mortgage and home equity loan)
Houses without a mortgage: 405
Compare current foreclosures near La Casita-Garciasville, TX:


Household type by relationship:
Households: 60,158- In family households: 57,363 (9,495 male householders, 4,985 female householders)
10,357 spouses, 24,018 children (23,174 natural, 234 adopted, 610 stepchildren), 3,607 grandchildren, 756 brothers or sisters, 775 parents, foster children, 1,388 other relatives, 665 non-relatives
- In nonfamily households: 2,795 (1,077 male householders (976 living alone)), 1,444 female householders (1,342 living alone)), 274 nonrelatives
- In group quarters: 810 (747 institutionalized population)
13,460 married couples with children.
3,493 single-parent households (528 men, 2,965 women).
6.1% of residents of La Casita-Garciasville speak English at home.
93.9% of residents speak Spanish at home (37% speak English very well, 24% speak English well, 21% speak English not well, 18% don't speak English at all).
Foreign born population: 665 (24.9%)
(22.3% of them are naturalized citizens)
| Here: | 5.4 |
| State: | 6.3 |
| Here: | 4.1 |
| State: | 4.0 |
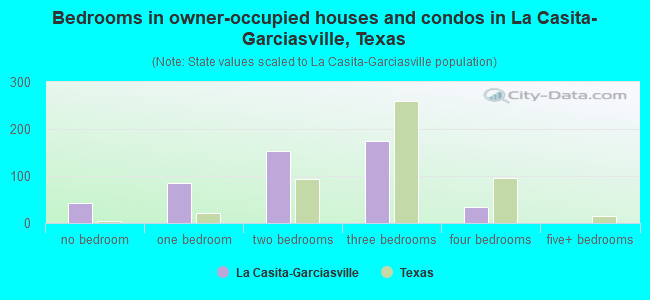
- Bedrooms in owner-occupied houses and condos in La Casita-Garciasville, Texas
- 43no bedroom
- 861 bedroom
- 1532 bedrooms
- 1753 bedrooms
- 334 bedrooms
- 05+ bedrooms
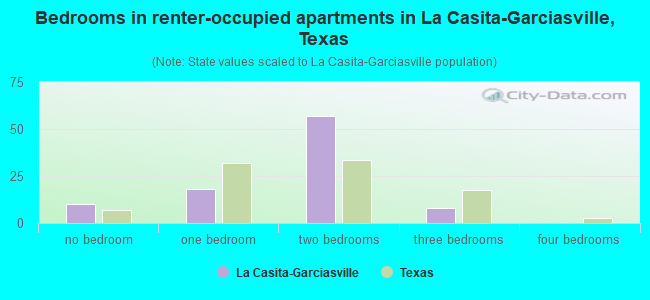
- Bedrooms in renter-occupied apartments in La Casita-Garciasville, Texas
- 10no bedroom
- 181 bedroom
- 572 bedrooms
- 83 bedrooms
- 04 bedrooms
- 05+ bedrooms
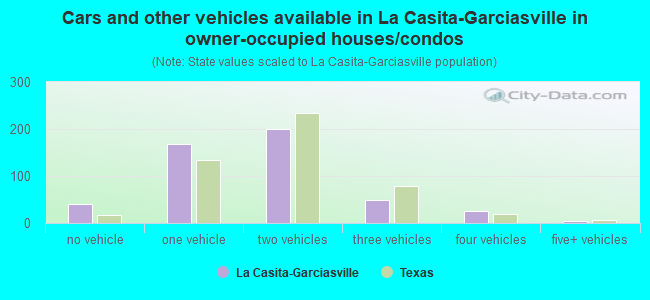
- Cars and other vehicles available in La Casita-Garciasville in owner-occupied houses/condos
- 40no vehicle
- 1691 vehicle
- 2002 vehicles
- 503 vehicles
- 264 vehicles
- 55+ vehicles
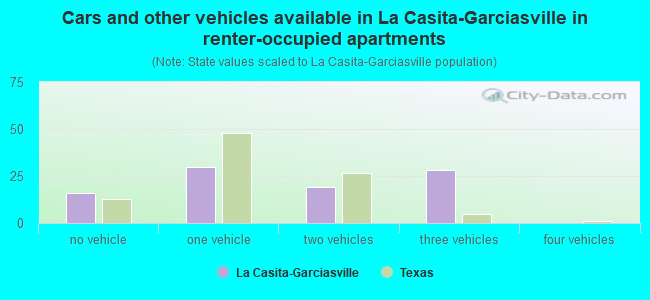
- Cars and other vehicles available in La Casita-Garciasville in renter-occupied apartments
- 16no vehicle
- 301 vehicle
- 192 vehicles
- 283 vehicles
- 04 vehicles
- 05+ vehicles
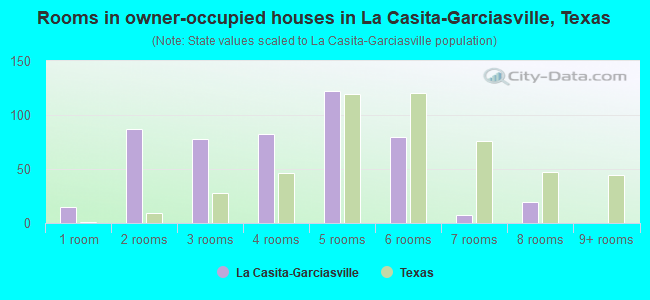
- Rooms in owner-occupied houses in La Casita-Garciasville, Texas
- 151 room
- 872 rooms
- 783 rooms
- 824 rooms
- 1225 rooms
- 806 rooms
- 77 rooms
- 198 rooms
- 09+ rooms
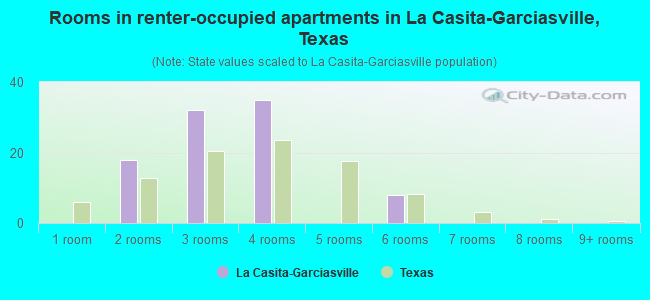
- Rooms in renter-occupied apartments in La Casita-Garciasville, Texas
- 01 room
- 182 rooms
- 323 rooms
- 354 rooms
- 05 rooms
- 86 rooms
- 07 rooms
- 08 rooms
- 09+ rooms
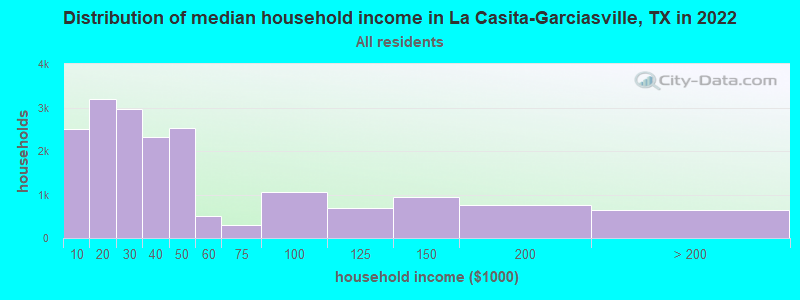
La Casita-Garciasville, TX household income distribution

- 2,509Less than $10,000
- 3,197$10,000 to $19,999
- 2,968$20,000 to $29,999
- 2,328$30,000 to $39,999
- 2,521$40,000 to $49,999
- 502$50,000 to $59,999
- 309$60,000 to $74,999
- 1,062$75,000 to $99,999
- 688$100,000 to $124,999
- 940$125,000 to $149,999
- 751$150,000 to $199,999
- 633$200,000 or more
Percentage of workers working in this county: 72.5%
Number of people working at home: 130 (14.0% of all workers)
Travel time to work (commute)
- Less than 5 minutes: 68
- 5 to 9 minutes: 82
- 10 to 14 minutes: 105
- 15 to 19 minutes: 97
- 20 to 24 minutes: 67
- 25 to 29 minutes: 10
- 30 to 34 minutes: 73
- 35 to 39 minutes: 10
- 40 to 44 minutes: 0
- 45 to 59 minutes: 29
- 60 to 89 minutes: 30
- 90 or more minutes: 13
Means of transportation to work:
- Drove a car alone: 479 (79.4%)
- Carpooled: 70 (11.6%)
- Walked: 26 (4.3%)
- Other means: 9 (1.5%)
- Worked at home: 19 (3.2%)
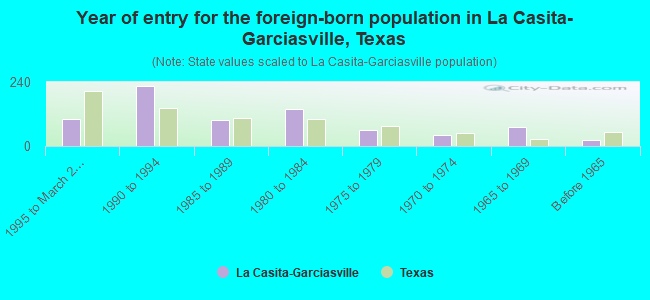
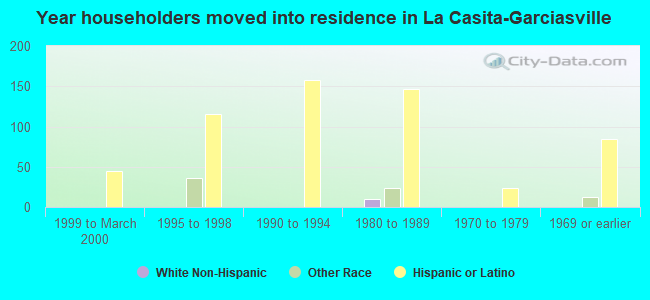
- Year of entry for the foreign-born population in La Casita-Garciasville, Texas
- 1031995 to March 2000
- 2251990 to 1994
- 981985 to 1989
- 1401980 to 1984
- 611975 to 1979
- 421970 to 1974
- 701965 to 1969
- 21Before 1965
Most common places of birth for foreign-born residents (%):
| La Casita-Garciasville: | 100.0% (760) |
| Texas: | 64.8% (1,879,369) |
Place of birth for U.S.-born residents:
- This state: 1,235
- Other state: 81
- Northeast: 0
- Midwest: 0
- South: 0
- West: 81
81% of La Casita-Garciasville residents lived in the same house 5 years ago.
Out of people who lived in different houses, 100% lived in this county.
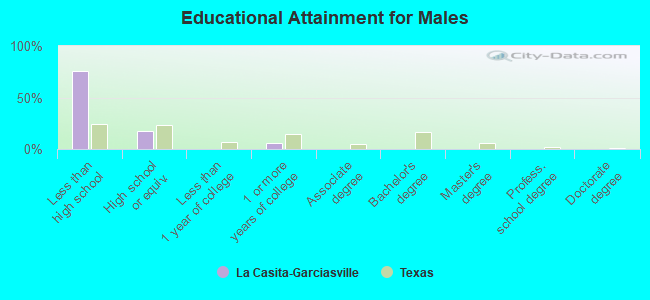
Education attainment for males 25 years and older:
- No schooling: 31
- Nursery to 4th grade: 94
- 5th and 6th grade: 119
- 7th and 8th grade: 44
- 9th grade: 51
- 10th grade: 33
- 11th grade: 8
- 12th grade, no diploma: 26
- High school graduate (or equivalency): 95
- Less than 1 year of college: 0
- Some college more than 1 year, no degree: 33
- Associate degree: 0
- Bachelor's degree: 0
- Master's degree: 0
- Professional school degree: 0
- Doctorate degree: 0
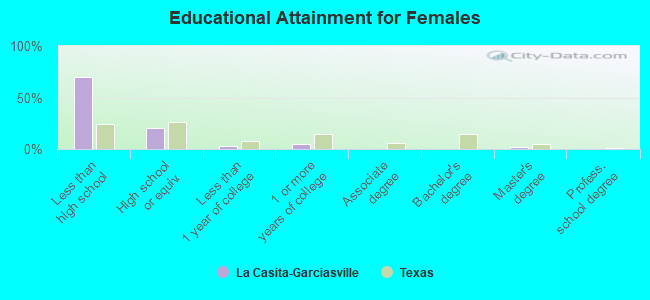
Education attainment for females 25 years and older:
- No schooling: 28
- Nursery to 4th grade: 67
- 5th and 6th grade: 85
- 7th and 8th grade: 93
- 9th grade: 59
- 10th grade: 10
- 11th grade: 21
- 12th grade, no diploma: 15
- High school graduate (or equivalency): 108
- Less than 1 year of college: 18
- Some college more than 1 year, no degree: 27
- Associate degree: 0
- Bachelor's degree: 0
- Master's degree: 9
- Professional school degree: 0
- Doctorate degree: 0
Housing units in structures:
- One, detached: 594
- Two: 23
- 3 or 4: 19
- Mobile homes: 43
Median worth of mobile homes: $57,972
Housing units lacking complete kitchen facilities: 3.5%
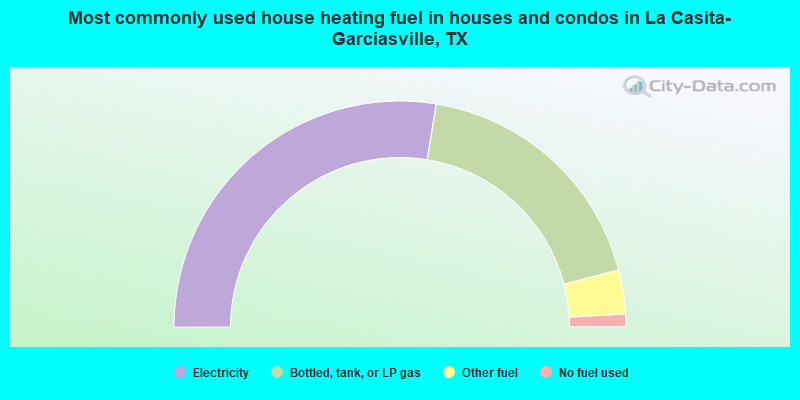
- 55.1%Electricity
- 36.7%Bottled, tank, or LP gas
- 6.3%Other fuel
- 1.8%No fuel used
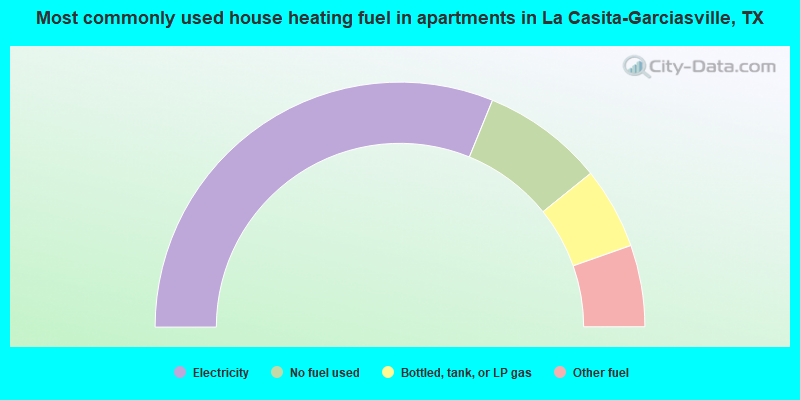
- 62.4%Electricity
- 16.1%No fuel used
- 10.8%Bottled, tank, or LP gas
- 10.8%Other fuel
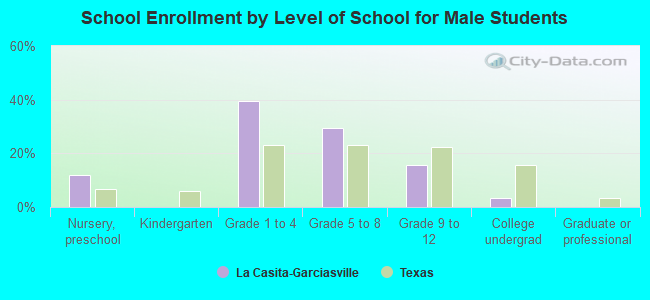
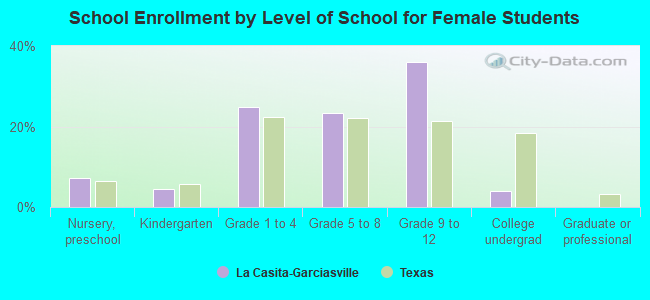
Private vs. public school enrollment:
| Here: | 0.0% |
| Texas: | 6.8% |
| Here: | 13.2% |
| Texas: | 6.2% |
| Here: | 0.0% |
| Texas: | 15.4% |