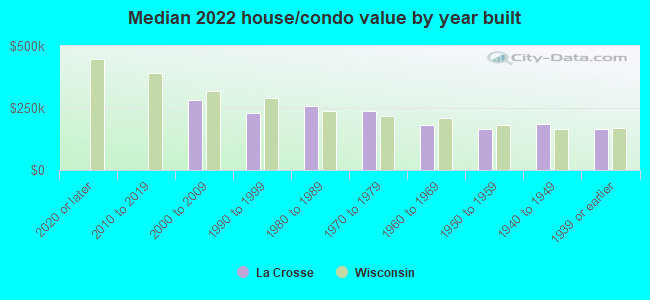
La Crosse, WI (Wisconsin) Houses and Residents
| La Crosse: | $187,102 |
| Wisconsin: | $252,800 |
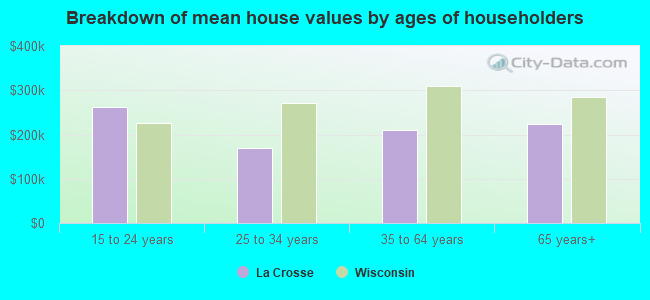
Mean price in 2022:
Detached houses: $237,963
Here: $237,963 State: $308,468 Townhouses or other attached units: $279,508
Here: $279,508 State: $265,873 In 2-unit structures: $151,499
Here: $151,499 State: $203,667 In 3-to-4-unit structures: $173,183
Here: $173,183 State: $216,833 In 5-or-more-unit structures: $261,397
Here: $261,397 State: $280,537 Mobile homes: $44,797
Here: $44,797 State: $79,042
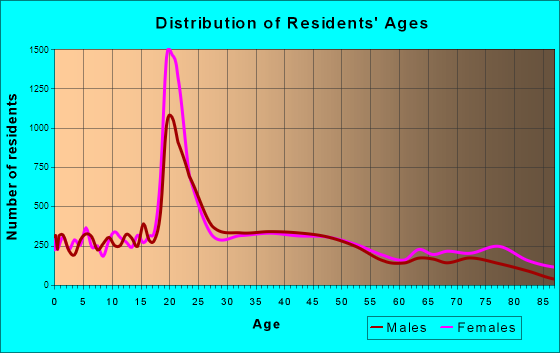
Total population: 52,440 (Urban population: 51,577, Rural population: 61 (all nonfarm))
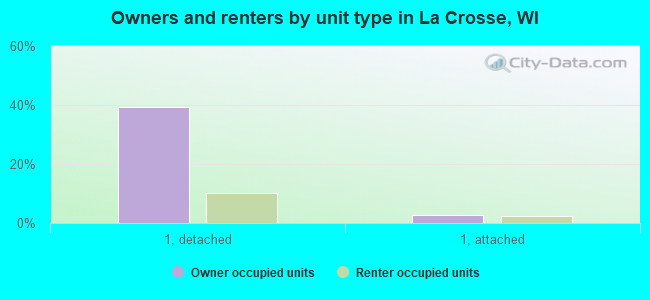
Houses: 24,650 (23,078 occupied: 10,756 owner occupied, 12,479 renter occupied)
| % of renters here: | 54% |
| State: | 32% |
Housing density: 1,224 houses/condos per square mile
Median price asked for vacant for-sale houses and condos in 2022: $111,544.
Median contract rent in 2022: $762 (lower quartile is $604, upper quartile is $992)
Median rent asked for vacant for-rent units in 2022: $1,497
Median gross rent in La Crosse, WI in 2022: $924
Housing units in La Crosse with a mortgage: 6,170 (538 second mortgage, 36 home equity loan, 443 both second mortgage and home equity loan)
Houses without a mortgage: 142
Median household income for houses/condos with a mortgage: $83,026
Median household income for apartments without a mortgage: $61,663
Median monthly housing costs: $943
Compare current foreclosures in La Crosse, WI:
| Photo | Address | Area | Beds / Baths | Price | Details |
|---|---|---|---|---|---|

|
#1
Riverplace Dr Apt 313
La Crosse, WI 54601
|
- sq. feet
|
- baths - beds |
show details | |

|
#2
Ristow Ct Apt 4
La Crosse, WI 54601
|
- sq. feet
|
- baths - beds |
show details | |

|
#3
Mormon Coulee Rd, Trlr 96
La Crosse, WI 54601
|
- sq. feet
|
- baths - beds |
show details | |

|
#4
Mormon Coulee Rd, Trlr 44
La Crosse, WI 54601
|
- sq. feet
|
- baths - beds |
show details | |

|
#5
Onalaska Ave
La Crosse, WI 54603
|
- sq. feet
|
- baths - beds |
show details | |

|
#6
7th St S Apt 4
La Crosse, WI 54601
|
- sq. feet
|
- baths - beds |
show details | |

|
#7
East Ave S Apt 114
La Crosse, WI 54601
|
- sq. feet
|
- baths - beds |
show details | |

|
#8
La Crescent St Apt 35
La Crosse, WI 54603
|
- sq. feet
|
- baths - beds |
show details | |

|
#9
Skyline Blvd
La Crosse, WI 54601
|
- sq. feet
|
- baths - beds |
show details | |

|
#10
Bainbridge St Apt 2
La Crosse, WI 54603
|
- sq. feet
|
- baths - beds |
show details |
| Photo | Address | Area | Beds / Baths | Price | Details |
|---|---|---|---|---|---|

|
#11
Eagle Ln
La Crosse, WI 54601
|
- sq. feet
|
- baths - beds |
show details | |

|
#12
State St Apt 426
La Crosse, WI 54601
|
- sq. feet
|
- baths - beds |
show details | |

|
#13
Willow Dr
La Crosse, WI 54601
|
- sq. feet
|
- baths - beds |
show details | |

|
#14
Miller St Apt 210
La Crosse, WI 54601
|
- sq. feet
|
- baths - beds |
show details | |

|
#15
State Road 33, House
La Crosse, WI 54601
|
- sq. feet
|
- baths - beds |
show details | |

|
#16
Gillette St Apt 305
La Crosse, WI 54603
|
- sq. feet
|
- baths - beds |
show details | |

|
#17
Kane St
La Crosse, WI 54603
|
- sq. feet
|
- baths - beds |
show details | |

|
#18
Gillette St # 31
La Crosse, WI 54601
|
- sq. feet
|
- baths - beds |
show details | |

|
#19
Cedar Rd
La Crosse, WI 54601
|
- sq. feet
|
- baths - beds |
show details | |

|
#20
Market St
La Crosse, WI 54601
|
- sq. feet
|
- baths - beds |
show details |
| Photo | Address | Area | Beds / Baths | Price | Details |
|---|---|---|---|---|---|

|
#21
7th St S Apt 3
La Crosse, WI 54601
|
- sq. feet
|
- baths - beds |
show details | |

|
#22
Lakeshore Dr Apt 5
La Crosse, WI 54603
|
- sq. feet
|
- baths - beds |
show details | |

|
#23
Gillette St Apt 224
La Crosse, WI 54603
|
- sq. feet
|
- baths - beds |
show details | |

|
#24
9th St S
La Crosse, WI 54601
|
- sq. feet
|
- baths - beds |
show details | |

|
#25
South Ave
La Crosse, WI 54601
|
- sq. feet
|
- baths - beds |
show details | |

|
#26
14th St S
La Crosse, WI 54601
|
- sq. feet
|
- baths - beds |
show details | |

|
#27
Mesa Grande Pl
La Crosse, WI 54601
|
- sq. feet
|
- baths - beds |
show details | |

|
#28
La Crescent St
La Crosse, WI 54603
|
- sq. feet
|
- baths - beds |
show details | |

|
#29
Harvey St
La Crosse, WI 54603
|
- sq. feet
|
- baths - beds |
show details | |

|
#30
7th St S
La Crosse, WI 54601
|
- sq. feet
|
- baths - beds |
show details |
| Photo | Address | Area | Beds / Baths | Price | Details |
|---|---|---|---|---|---|

|
#31
Market St
La Crosse, WI 54601
|
- sq. feet
|
- baths - beds |
show details | |

|
#32
Denton St
La Crosse, WI 54601
|
- sq. feet
|
- baths - beds |
show details | |

|
#33
Shelby Rd
La Crosse, WI 54601
|
- sq. feet
|
- baths - beds |
show details | |

|
#34
Adams St
La Crosse, WI 54601
|
- sq. feet
|
- baths - beds |
show details | |

|
#35
Nakomis Ave
La Crosse, WI 54603
|
- sq. feet
|
- baths - beds |
show details | |

|
#36
Wood St
La Crosse, WI 54603
|
- sq. feet
|
- baths - beds |
show details | |

|
#37
5th Ave S
La Crosse, WI 54601
|
- sq. feet
|
- baths - beds |
show details | |

|
#38
East Ave S
La Crosse, WI 54601
|
- sq. feet
|
- baths - beds |
show details | |

|
#39
20th St S
La Crosse, WI 54601
|
- sq. feet
|
- baths - beds |
show details | |

|
#40
East Ave S
La Crosse, WI 54601
|
- sq. feet
|
- baths - beds |
show details |
| Photo | Address | Area | Beds / Baths | Price | Details |
|---|---|---|---|---|---|

|
#41
26th St S
La Crosse, WI 54601
|
- sq. feet
|
- baths - beds |
show details | |

|
#42
Hagar St
La Crosse, WI 54603
|
- sq. feet
|
- baths - beds |
show details | |

|
#43
Shorewood Dr
La Crosse, WI 54601
|
- sq. feet
|
- baths - beds |
show details | |

|
#44
Prospect St
La Crosse, WI 54603
|
- sq. feet
|
- baths - beds |
show details | |

|
#45
Windsor St
La Crosse, WI 54603
|
- sq. feet
|
- baths - beds |
show details | |

|
#46
Charles St
La Crosse, WI 54603
|
- sq. feet
|
- baths - beds |
show details | |

|
#47
Redfield St
La Crosse, WI 54601
|
- sq. feet
|
- baths - beds |
show details | |

|
#48
13th Pl S
La Crosse, WI 54601
|
- sq. feet
|
- baths - beds |
show details | |

|
#49
2nd Ave W
La Crosse, WI 54603
|
- sq. feet
|
- baths - beds |
show details | |

|
Check over 1 million property listings on Foreclosure.com!
|
browse all offers | |||


 | Work in La Crosse (4 replies) |
| Is Wisconsin a good fit? Which region? (22 replies) |
| serviced apts/homes in la crosse, WI area (3 replies) |
| Considering a move to rural home around Sparta or La Crosse (2 replies) |
| Want free college for your kids? Build a house in La Crosse (3 replies) |
| La Crosse questions for daughter (6 replies) |
Median year apartment built: 1972
Household type by relationship:
Households: 52,076- Male householders: 11,063 (4,438 living alone), Female householders: 11,613 (4,822 living alone)
6,438 spouses (6,334 opposite-sex spouses), 2,268 unmarried partners, (2,205 opposite-sex unmarried partners), 9,138 children (8,505 natural, 259 adopted, 374 stepchildren), 202 grandchildren, 662 brothers or sisters, 343 parents, 0 foster children, 331 other relatives, 5,478 non-relatives
- In group quarters: 4,536
Size of family households: 5,211 2-persons, 2,317 3-persons, 1,368 4-persons, 471 5-persons, 157 6-persons, 142 7-or-more-persons.
Size of nonfamily households: 9,157 1-person, 3,017 2-persons, 645 3-persons, 238 4-persons, 173 5-persons, 99 6-persons.
4,709 married couples with children.
1,725 single-parent households (866 men, 859 women).
94.3% of residents of La Crosse speak English at home.
2.3% of residents speak Spanish at home (50% speak English very well, 26% speak English well, 24% speak English not well).
0.8% of residents speak other Indo-European language at home (90% speak English very well, 3% speak English well, 7% speak English not well).
2.3% of residents speak Asian or Pacific Island language at home (63% speak English very well, 24% speak English well, 9% speak English not well, 3% don't speak English at all).
0.2% of residents speak other language at home (100% speak English very well).
Foreign born population: 1,580 (3.0%)
(55.9% of them are naturalized citizens)
| Here: | 6.2 |
| State: | 6.5 |
| Here: | 4.0 |
| State: | 4.1 |
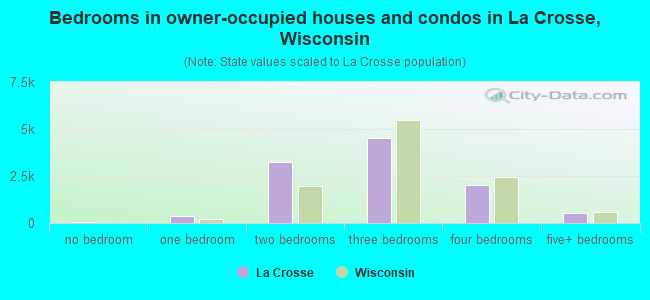
- Bedrooms in owner-occupied houses and condos in La Crosse, Wisconsin
- 63no bedroom
- 3961 bedroom
- 3,2272 bedrooms
- 4,5063 bedrooms
- 2,0394 bedrooms
- 5265+ bedrooms
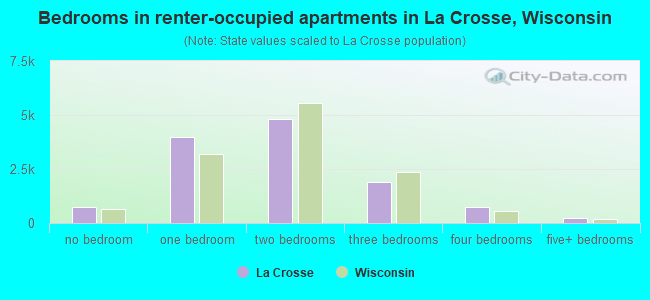
- Bedrooms in renter-occupied apartments in La Crosse, Wisconsin
- 761no bedroom
- 4,0031 bedroom
- 4,8132 bedrooms
- 1,9173 bedrooms
- 7424 bedrooms
- 2435+ bedrooms
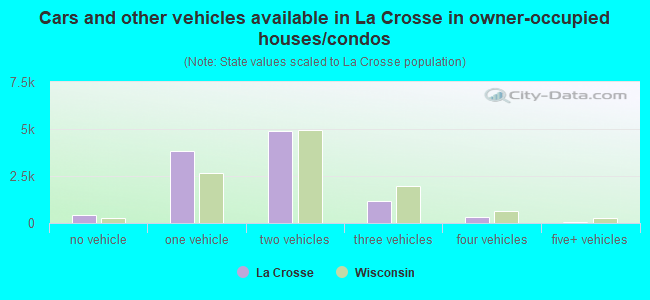
- Cars and other vehicles available in La Crosse in owner-occupied houses/condos
- 429no vehicle
- 3,8531 vehicle
- 4,8972 vehicles
- 1,1813 vehicles
- 3244 vehicles
- 735+ vehicles
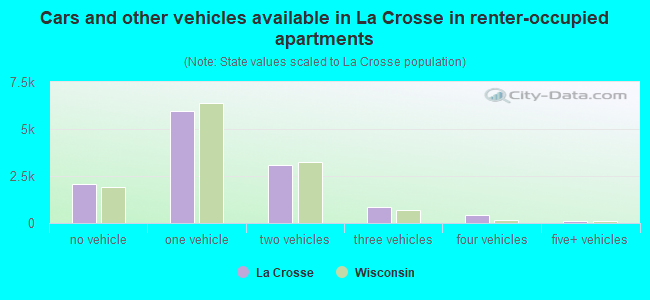
- Cars and other vehicles available in La Crosse in renter-occupied apartments
- 2,087no vehicle
- 5,9391 vehicle
- 3,0822 vehicles
- 8473 vehicles
- 3994 vehicles
- 1265+ vehicles
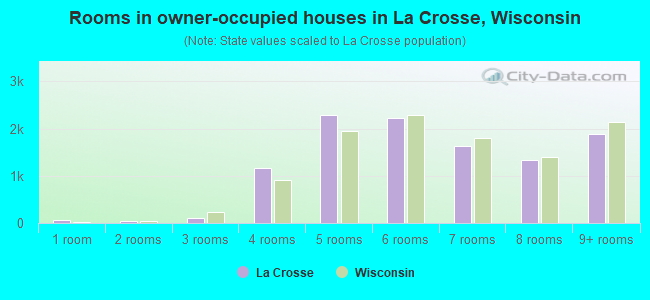
- Rooms in owner-occupied houses in La Crosse, Wisconsin
- 541 room
- 492 rooms
- 1123 rooms
- 1,1724 rooms
- 2,2905 rooms
- 2,2286 rooms
- 1,6237 rooms
- 1,3438 rooms
- 1,8869+ rooms
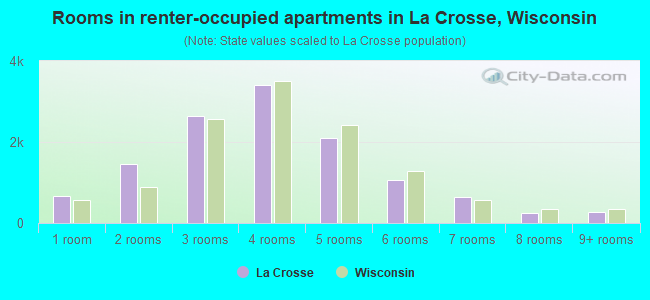
- Rooms in renter-occupied apartments in La Crosse, Wisconsin
- 6561 room
- 1,4452 rooms
- 2,6483 rooms
- 3,4004 rooms
- 2,1115 rooms
- 1,0736 rooms
- 6327 rooms
- 2378 rooms
- 2779+ rooms
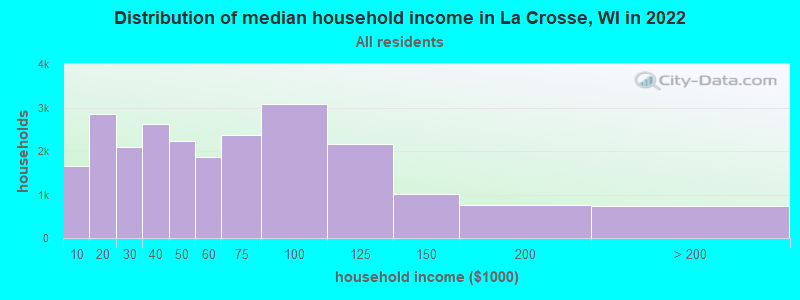
La Crosse, WI household income distribution

- 1,664Less than $10,000
- 2,858$10,000 to $19,999
- 2,093$20,000 to $29,999
- 2,621$30,000 to $39,999
- 2,227$40,000 to $49,999
- 1,862$50,000 to $59,999
- 2,379$60,000 to $74,999
- 3,090$75,000 to $99,999
- 2,153$100,000 to $124,999
- 1,013$125,000 to $149,999
- 764$150,000 to $199,999
- 734$200,000 or more
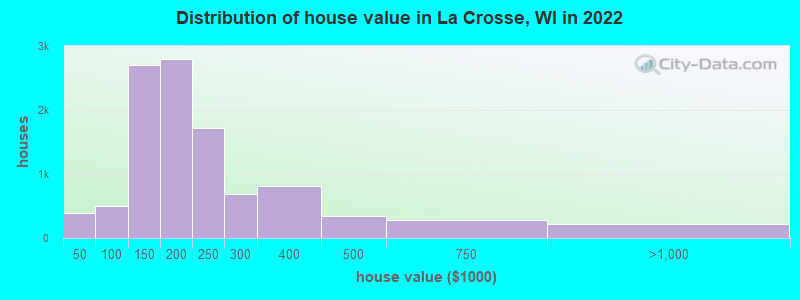
Home value of owner - occupied houses in 2022 in La Crosse, WI
-
- 138Less than $10,000
- 25$10,000 to $14,999
- 45$15,000 to $19,999
- 54$20,000 to $24,999
- 78$25,000 to $29,999
- 6$35,000 to $39,999
- 35$40,000 to $49,999
- 14$50,000 to $59,999
- 33$60,000 to $69,999
- 69$70,000 to $79,999
- 127$80,000 to $89,999
- 218$90,000 to $99,999
- 1,872$100,000 to $124,999
- 827$125,000 to $149,999
- 1,539$150,000 to $174,999
- 1,251$175,000 to $199,999
- 1,716$200,000 to $249,999
- 694$250,000 to $299,999
- 810$300,000 to $399,999
- 341$400,000 to $499,999
- 288$500,000 to $749,999
- 175$750,000 to $999,999
- 21$1,000,000 to $1,499,999
- 13$2,000,000 or more
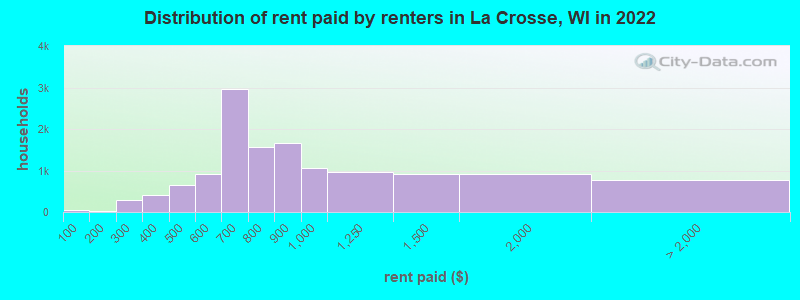
Rent paid by renters in 2022 in La Crosse, WI
-
- 59Less than $100
- 14$100 to $149
- 20$150 to $199
- 29$200 to $249
- 261$250 to $299
- 190$300 to $349
- 221$350 to $399
- 278$400 to $449
- 374$450 to $499
- 486$500 to $549
- 432$550 to $599
- 1,783$600 to $649
- 1,177$650 to $699
- 660$700 to $749
- 900$750 to $799
- 1,664$800 to $899
- 1,058$900 to $999
- 961$1,000 to $1,249
- 911$1,250 to $1,499
- 927$1,500 to $1,999
- 188$2,000 to $2,499
- 111$2,500 to $2,999
- 33$3,000 to $3,499
- 130$3,500 or more
- 305No cash rent
Percentage of workers working in this county: 94.2%
Number of people working at home: 2,506 (8.9% of all workers)
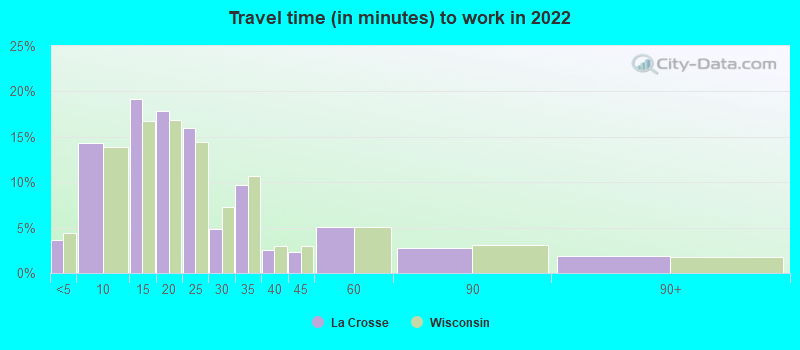
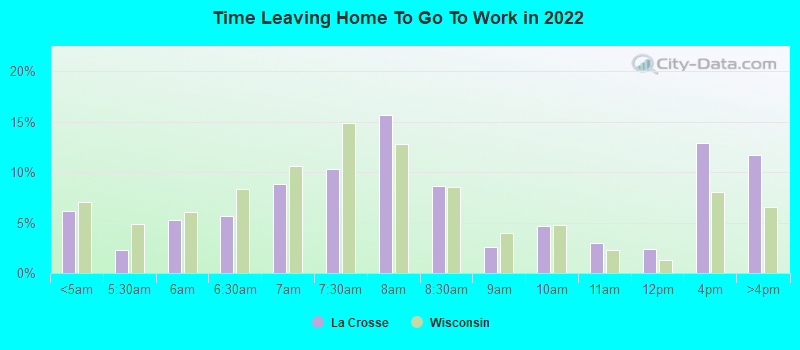
Travel time to work (commute)
- Less than 5 minutes: 1,405
- 5 to 9 minutes: 5,406
- 10 to 14 minutes: 6,968
- 15 to 19 minutes: 4,800
- 20 to 24 minutes: 3,500
- 25 to 29 minutes: 627
- 30 to 34 minutes: 1,216
- 35 to 39 minutes: 133
- 40 to 44 minutes: 238
- 45 to 59 minutes: 583
- 60 to 89 minutes: 636
- 90 or more minutes: 298
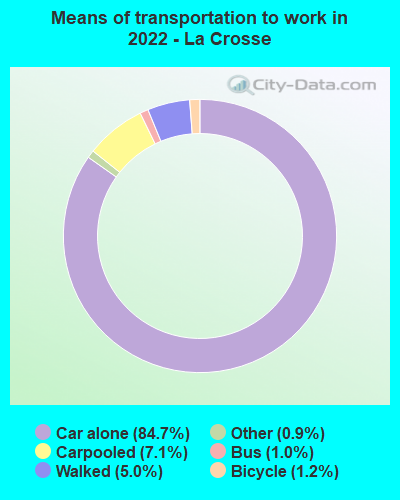
Means of transportation to work:
- Drove a car alone: 38,621 (79.3%)
- Carpooled: 3,184 (6.5%)
- Bus: 308 (0.6%)
- Ferryboat: 10 (0.0%)
- Taxi: 477 (1.0%)
- Bicycle: 805 (1.7%)
- Walked: 2,619 (5.4%)
- Worked at home: 2,506 (5.1%)
- Unemployment by race in 2022
- Unemployment rate for White non-Hispanic residents
- 4.0%Males
- 2.3%Females
- Unemployment rate for Black residents
- 7.5%Males
- 9.7%Females
- Unemployment rate for two or more race residents
- 7.9%Females
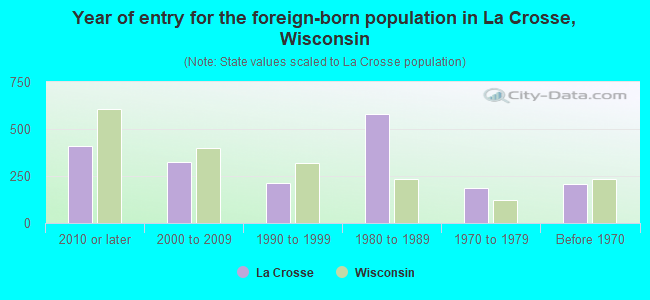
- Year of entry for the foreign-born population in La Crosse, Wisconsin
- 4092010 or later
- 3242000 to 2009
- 2141990 to 1999
- 5791980 to 1989
- 1861970 to 1979
- 209Before 1970
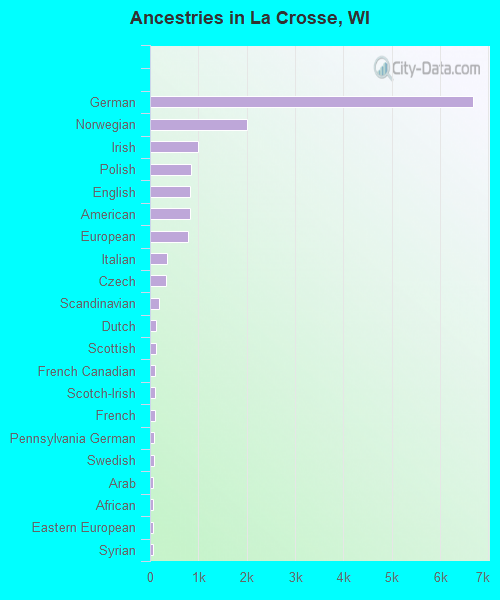
First ancestries reported:
- German: 6,678 (34.2%)
- Norwegian: 2,004 (10.3%)
- Irish: 995 (5.1%)
- Polish: 853 (4.4%)
- English: 823 (4.2%)
- American: 821 (4.2%)
- European: 793 (4.1%)
- Italian: 345 (1.8%)
- Czech: 334 (1.7%)
- Scandinavian: 179 (0.9%)
- Dutch: 132 (0.7%)
- Scottish: 128 (0.7%)
- French Canadian: 104 (0.5%)
- Scotch-Irish: 96 (0.5%)
- French: 94 (0.5%)
- Pennsylvania German: 80 (0.4%)
- Swedish: 73 (0.4%)
- Arab: 68 (0.3%)
- African: 67 (0.3%)
- Eastern European: 67 (0.3%)
- Syrian: 62 (0.3%)
- Finnish: 60 (0.3%)
- Swiss: 56 (0.3%)
- Canadian: 43 (0.2%)
- Brazilian: 35 (0.2%)
- Welsh: 34 (0.2%)
- Danish: 31 (0.2%)
- British: 26 (0.1%)
- Nigerian: 23 (0.1%)
- Northern European: 21 (0.1%)
- Czechoslovakian: 13 (0.07%)
- Lebanese: 12 (0.06%)
- Ethiopian: 11 (0.06%)
- Yugoslavian: 11 (0.06%)
- Bulgarian: 10 (0.05%)
- Romanian: 10 (0.05%)
- Latvian: 9 (0.05%)
- Luxembourger: 9 (0.05%)
- Belizean: 9 (0.05%)
- Austrian: 8 (0.04%)
- Belgian: 8 (0.04%)
- Greek: 5 (0.03%)
- Australian: 5 (0.03%)
- Ukrainian: 5 (0.03%)
- Icelander: 3 (0.02%)
- Russian: 3 (0.02%)
- Slovak: 3 (0.02%)
Most common places of birth for foreign-born residents (%):
| La Crosse: | 21.5% (290) |
| Wisconsin: | 4.3% (12,681) |
| La Crosse: | 11.0% (148) |
| Wisconsin: | 3.3% (9,655) |
| La Crosse: | 9.2% (124) |
| Wisconsin: | 0.3% (1,015) |
| La Crosse: | 7.0% (95) |
| Wisconsin: | 5.1% (15,165) |
| La Crosse: | 4.9% (66) |
| Wisconsin: | 29.5% (87,182) |
| La Crosse: | 4.7% (64) |
| Wisconsin: | 3.1% (9,280) |
| La Crosse: | 4.5% (61) |
| Wisconsin: | 1.8% (5,320) |
| La Crosse: | 4.2% (57) |
| Wisconsin: | 8.0% (23,594) |
| La Crosse: | 3.5% (47) |
| Wisconsin: | 3.0% (8,773) |
| La Crosse: | 3.1% (42) |
| Wisconsin: | 0.8% (2,427) |
| La Crosse: | 3.0% (41) |
| Wisconsin: | 0.2% (503) |
| La Crosse: | 3.0% (40) |
| Wisconsin: | 0.7% (1,960) |
| La Crosse: | 2.2% (30) |
| Wisconsin: | 0.7% (2,133) |
| La Crosse: | 2.1% (28) |
| Wisconsin: | 0.4% (1,080) |
| La Crosse: | 2.0% (27) |
| Wisconsin: | 0.4% (1,329) |
| La Crosse: | 1.9% (25) |
| Wisconsin: | 2.3% (6,747) |
| La Crosse: | 1.6% (22) |
| Wisconsin: | 0.8% (2,302) |
Place of birth for U.S.-born residents:
- This state: 37,712
- Other state: 12,218
- Northeast: 685
- Midwest: 8,125
- South: 1,271
- West: 2,104
73.1% of La Crosse residents lived in the same house 1 years ago.
Out of people who lived in different houses, 31.3% lived in this county.
Out of people who lived in different counties, 62.9% lived in Wisconsin.
| La Crosse: | 73.1% |
| State average: | 87.7% |
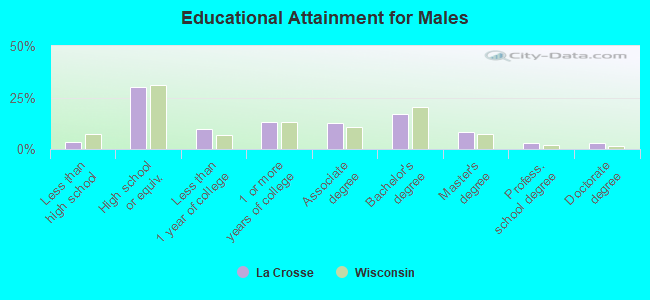
Education attainment for males 25 years and older:
- No schooling: 41
- Nursery to 4th grade: 73
- 5th and 6th grade: 21
- 7th and 8th grade: 48
- 9th grade: 39
- 10th grade: 46
- 11th grade: 111
- 12th grade, no diploma: 158
- High school graduate (or equivalency): 4,536
- Less than 1 year of college: 1,434
- Some college more than 1 year, no degree: 1,980
- Associate degree: 1,926
- Bachelor's degree: 2,571
- Master's degree: 1,206
- Professional school degree: 443
- Doctorate degree: 420
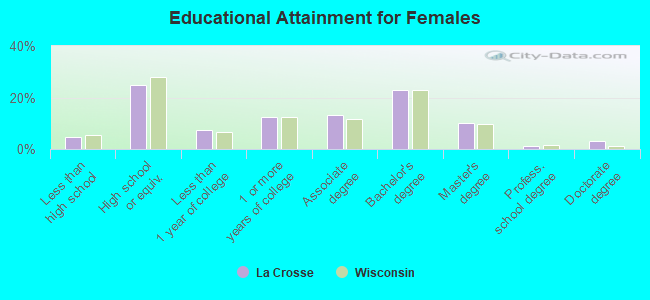
Education attainment for females 25 years and older:
- No schooling: 74
- Nursery to 4th grade: 0
- 5th and 6th grade: 24
- 7th and 8th grade: 170
- 9th grade: 17
- 10th grade: 123
- 11th grade: 119
- 12th grade, no diploma: 176
- High school graduate (or equivalency): 3,806
- Less than 1 year of college: 1,126
- Some college more than 1 year, no degree: 1,863
- Associate degree: 2,022
- Bachelor's degree: 3,491
- Master's degree: 1,534
- Professional school degree: 199
- Doctorate degree: 461
Housing units in structures:
- One, detached: 12,171
- One, attached: 1,458
- Two: 1,800
- 3 or 4: 1,757
- 5 to 9: 1,590
- 10 to 19: 1,604
- 20 to 49: 1,876
- 50 or more: 2,091
- Mobile homes: 298
Median worth of mobile homes: $15,574
Housing units lacking complete kitchen facilities in 2022: 1.4%
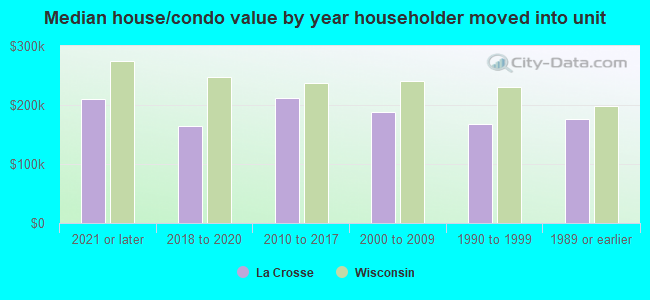
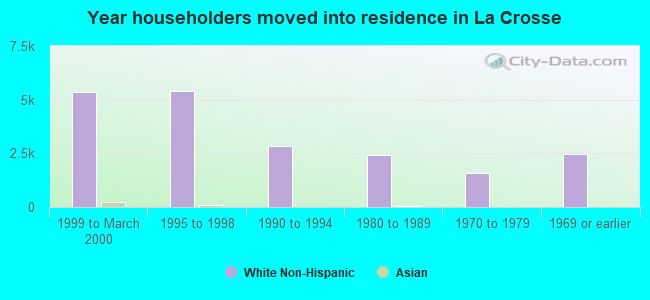
House/condo owner moved in on average 14 years ago
Renter moved in on average 3 years ago
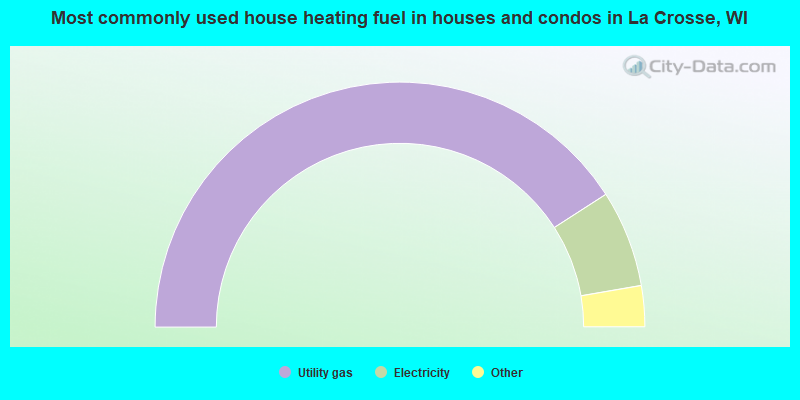
- 81.8%Utility gas
- 12.8%Electricity
- 2.3%Bottled, tank, or LP gas
- 1.8%Fuel oil, kerosene, etc.
- 0.5%No fuel used
- 0.4%Wood
- 0.3%Other fuel
- 0.2%Coal or coke
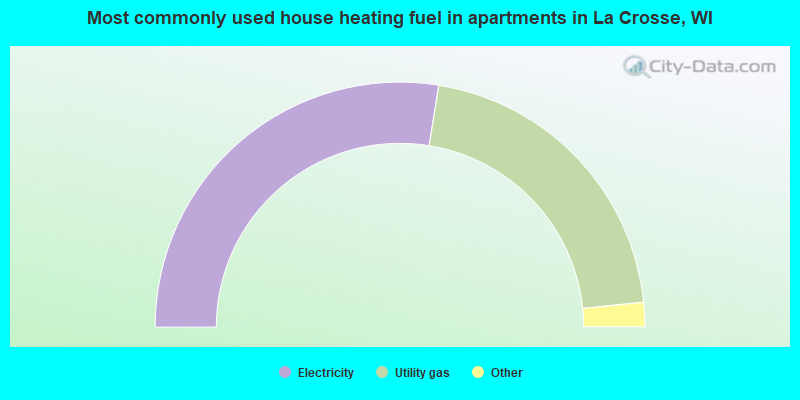
- 55.1%Electricity
- 41.7%Utility gas
- 1.5%Bottled, tank, or LP gas
- 0.9%Other fuel
- 0.7%No fuel used
- 0.1%Fuel oil, kerosene, etc.
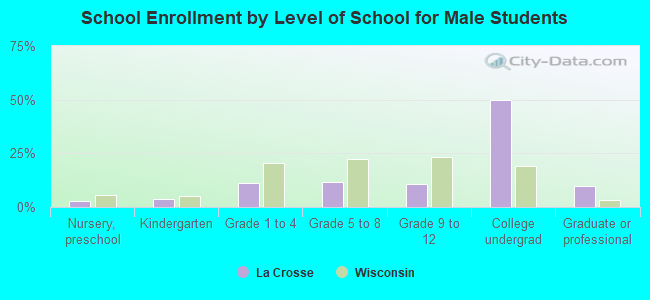
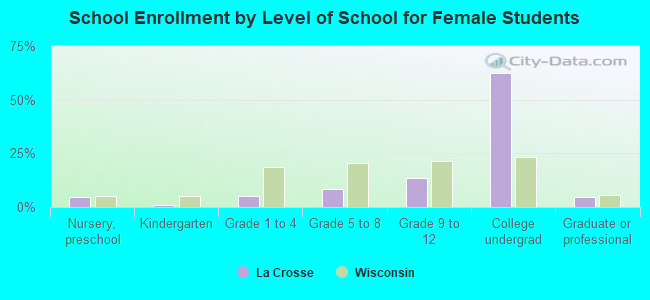
Private vs. public school enrollment:
| Here: | 9.5% |
| Wisconsin: | 16.7% |
| Here: | 6.5% |
| Wisconsin: | 12.5% |
| Here: | 12.6% |
| Wisconsin: | 17.5% |