Housing density: 1,343 houses/condos per square mile
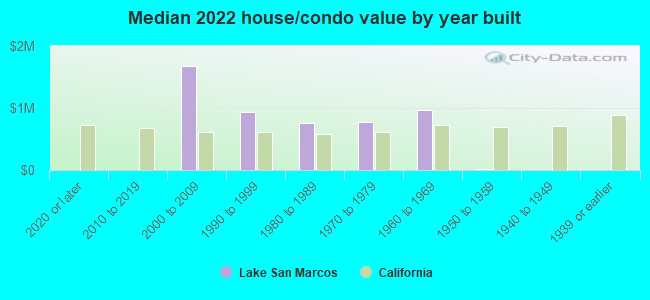
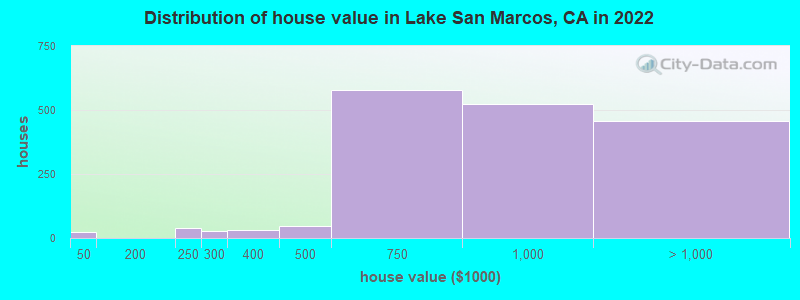
Median price asked for vacant for-sale houses and condos in 2022 in this county: $1,340,665.
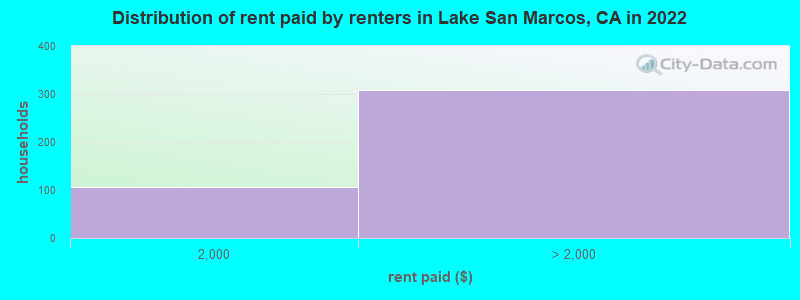
Median contract rent in 2022: over $2,000 (lower quartile is $1,967, upper quartile is over $2,000)
Median rent asked for vacant for-rent units in 2022: $2,376
Median gross rent in Lake San Marcos, CA in 2022: over $2,000
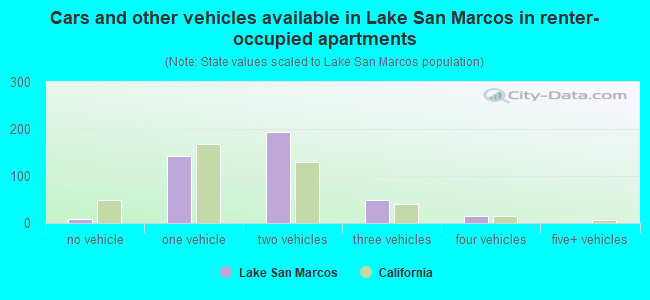
Housing units in Lake San Marcos with a mortgage: 970 (73 second mortgage, 0 home equity loan, 40 both second mortgage and home equity loan) Houses without a mortgage: 71
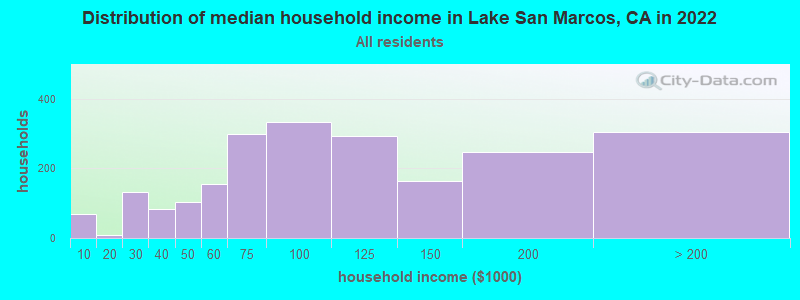
Median household income for houses/condos with a mortgage: $101,245
Median household income for apartments without a mortgage: $82,904
Median monthly housing costs: $1,981
Compare current foreclosures near Lake San Marcos, CA:
Size of family households: 931 2-persons, 144 3-persons, 122 4-persons, 9 5-persons.
Size of nonfamily households: 799 1-person, 207 2-persons.
244 married couples with children.
68 single-parent households (15 men, 53 women).
89.1% of residents of Lake San Marcos speak English at home.
5.6% of residents speak Spanish at home (64% speak English very well, 23% speak English well, 13% speak English not well).
4.5% of residents speak other Indo-European language at home (96% speak English very well, 4% speak English well).
2.7% of residents speak Asian or Pacific Island language at home (71% speak English very well, 19% speak English well, 10% speak English not well).
Foreign born population: 539 (13.3%)
(81.3% of them are naturalized citizens)
Percentage of workers working in this county: 99.8% Number of people working at home: 554 (32.9% of all workers)
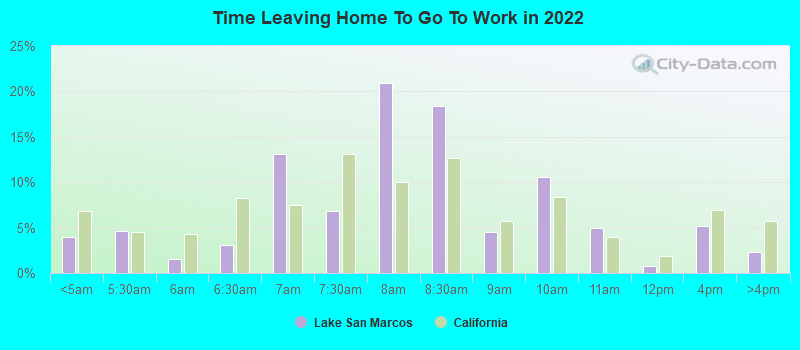
Travel time to work (commute)
Less than 5 minutes: 25
5 to 9 minutes: 35
10 to 14 minutes: 137
15 to 19 minutes: 190
20 to 24 minutes: 315
25 to 29 minutes: 142
30 to 34 minutes: 169
35 to 39 minutes: 0
40 to 44 minutes: 37
45 to 59 minutes: 82
60 to 89 minutes: 41
90 or more minutes: 9
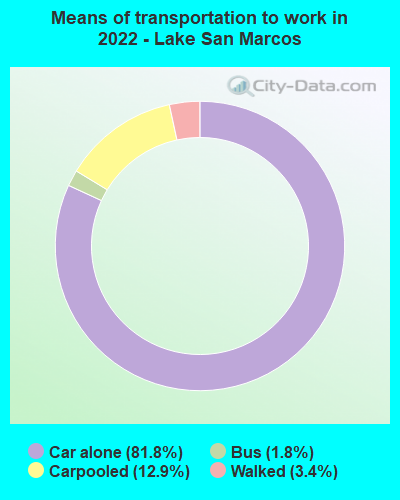
Means of transportation to work:
Drove a car alone: 301 (36.2%)
Carpooled: 49 (5.9%)
Bus: 6 (0.7%)
Walked: 13 (1.6%)
Worked at home: 554 (66.7%)
Unemployment by race in 2022
Unemployment rate for White non-Hispanic residents
5.9%Males
1.9%Females
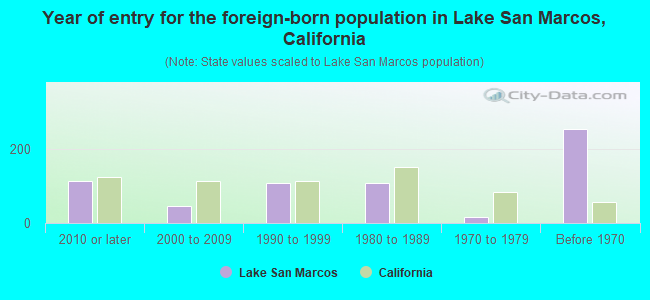
Year of entry for the foreign-born population in Lake San Marcos, California
1122010 or later
452000 to 2009
1091990 to 1999
1081980 to 1989
171970 to 1979
253Before 1970
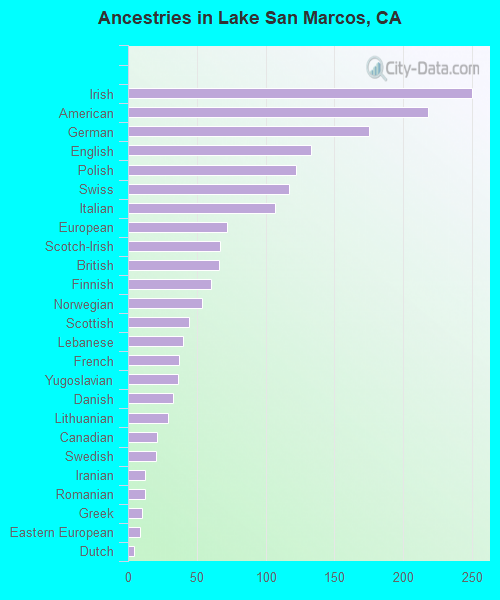
First ancestries reported:
Irish: 250 (11.4%)
American: 218 (9.9%)
German: 175 (8.0%)
English: 133 (6.1%)
Polish: 122 (5.6%)
Swiss: 117 (5.3%)
Italian: 107 (4.9%)
European: 72 (3.3%)
Scotch-Irish: 67 (3.0%)
British: 66 (3.0%)
Finnish: 60 (2.7%)
Norwegian: 54 (2.5%)
Scottish: 44 (2.0%)
Lebanese: 40 (1.8%)
French: 37 (1.7%)
Yugoslavian: 36 (1.6%)
Danish: 33 (1.5%)
Lithuanian: 29 (1.3%)
Canadian: 21 (1.0%)
Swedish: 20 (0.9%)
Iranian: 12 (0.5%)
Romanian: 12 (0.5%)
Greek: 10 (0.5%)
Eastern European: 9 (0.4%)
Dutch: 4 (0.2%)
Iraqi: 2 (0.09%)
Most common places of birth for foreign-born residents (%):
England
Lake San Marcos:
11.7% (63)
California:
0.6% (57,953)
France
Lake San Marcos:
9.5% (51)
California:
0.4% (40,224)
Germany
Lake San Marcos:
8.5% (46)
California:
0.7% (73,304)
Philippines
Lake San Marcos:
8.0% (43)
California:
7.8% (818,297)
Hong Kong
Lake San Marcos:
7.2% (39)
California:
1.0% (105,215)
Canada
Lake San Marcos:
7.1% (38)
California:
1.2% (127,477)
South Africa
Lake San Marcos:
5.9% (32)
California:
0.2% (20,614)
Serbia
Lake San Marcos:
5.2% (28)
California:
0.0% (4,595)
Nicaragua
Lake San Marcos:
4.3% (23)
California:
0.6% (58,161)
China, excluding Hong Kong and Taiwan
Lake San Marcos:
3.9% (21)
California:
6.6% (684,672)
Panama
Lake San Marcos:
3.9% (21)
California:
0.1% (9,209)
Switzerland
Lake San Marcos:
3.7% (20)
California:
0.1% (9,159)
Vietnam
Lake San Marcos:
3.2% (17)
California:
4.9% (512,335)
Mexico
Lake San Marcos:
3.2% (17)
California:
37.2% (3,881,193)
Peru
Lake San Marcos:
2.8% (15)
California:
0.7% (74,025)
Scotland
Lake San Marcos:
2.6% (14)
California:
0.1% (8,444)
Taiwan
Lake San Marcos:
1.9% (10)
California:
1.7% (176,274)
United Kingdom, excluding England and Scotland
Lake San Marcos:
1.7% (9)
California:
0.6% (60,582)
Romania
Lake San Marcos:
1.7% (9)
California:
0.2% (23,058)
Place of birth for U.S.-born residents:
This state: 1,801
Other state: 1,679
Northeast: 321
Midwest: 611
South: 249
West: 482
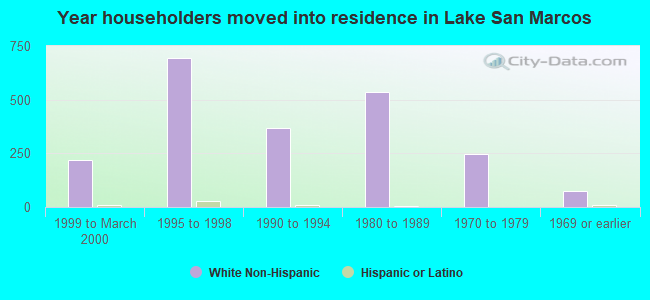
93.0% of Lake San Marcos residents lived in the same house 1 years ago. Out of people who lived in different houses, 40.8% lived in this county. Out of people who lived in different counties, 56.9% lived in California.
Lake San Marcos:
93.0%
State average:
88.9%
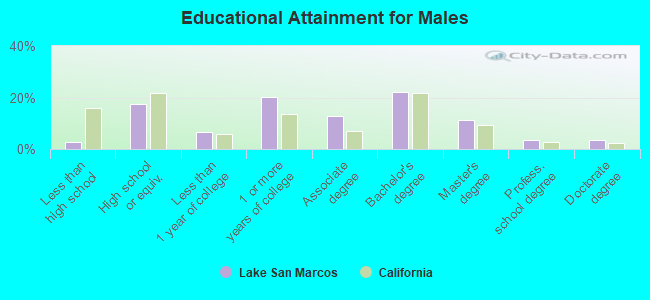
Education attainment for males 25 years and older:
No schooling: 14
Nursery to 4th grade: 0
5th and 6th grade: 0
7th and 8th grade: 0
9th grade: 0
10th grade: 0
11th grade: 0
12th grade, no diploma: 28
High school graduate (or equivalency): 285
Less than 1 year of college: 108
Some college more than 1 year, no degree: 327
Associate degree: 207
Bachelor's degree: 363
Master's degree: 186
Professional school degree: 54
Doctorate degree: 54
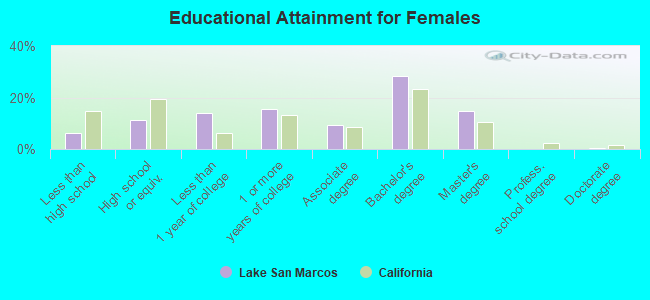
Education attainment for females 25 years and older:
No schooling: 0
Nursery to 4th grade: 0
5th and 6th grade: 0
7th and 8th grade: 0
9th grade: 15
10th grade: 8
11th grade: 9
12th grade, no diploma: 90
High school graduate (or equivalency): 227
Less than 1 year of college: 281
Some college more than 1 year, no degree: 311
Associate degree: 189
Bachelor's degree: 573
Master's degree: 298
Professional school degree: 0
Doctorate degree: 10
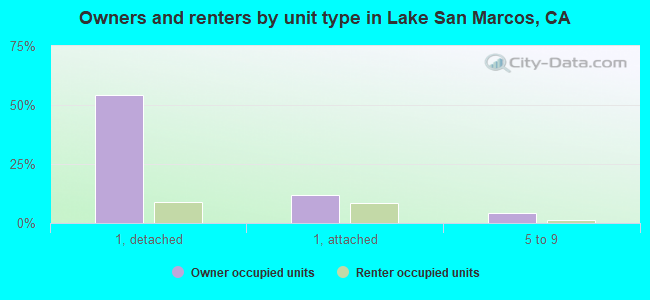
Housing units in structures:
One, detached: 1,464
One, attached: 556
Two: 45
3 or 4: 54
5 to 9: 88
10 to 19: 46
20 to 49: 126
50 or more: 50
Housing units lacking complete plumbing facilities in 2022: 1.5%
Housing units lacking complete kitchen facilities in 2022: 0.3%