Lansing, MI (Michigan) Houses and Residents
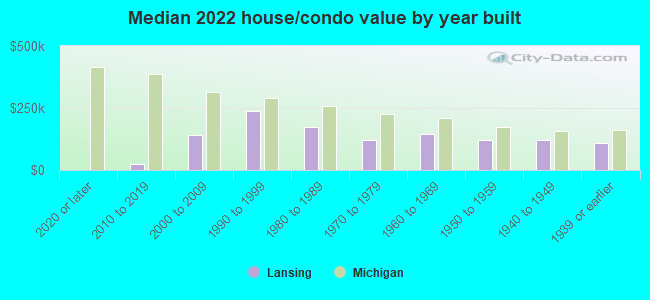
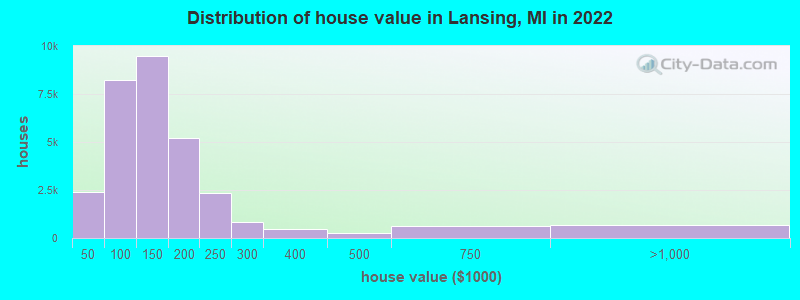
Estimated median house or condo value in 2022: $122,400 (it was $73,000 in 2000 )
Lansing:
$122,400Michigan:
$224,400
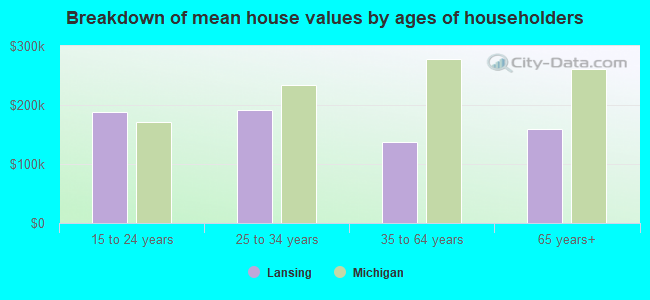
Lower value quartile - upper value quartile: $86,400 - $172,200Mean price in 2022: Detached houses: $140,962 Here:
$140,962State:
$280,038
Townhouses or other attached units: $135,343 Here:
$135,343State:
$239,520
In 2-unit structures: $220,148 Here:
$220,148State:
$219,481
In 3-to-4-unit structures: $84,890 Here:
$84,890State:
$207,067
In 5-or-more-unit structures: $202,036 Here:
$202,036State:
$192,733
Mobile homes: $48,331 Here:
$48,331State:
$72,868
Total population: 114,620 (All urban)
Houses: 55,954 (53,147 occupied: 29,986 owner occupied, 23,161 renter occupied )
% of renters here:
44%State:
27%
Housing density: 1,597 houses/condos per square mile
Median price asked for vacant for-sale houses and condos in 2022: $125,369.
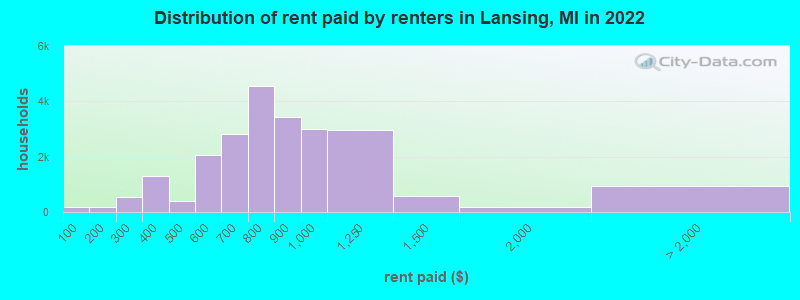
Median contract rent in 2022: $773 (lower quartile is $636, upper quartile is $939)
Median rent asked for vacant for-rent units in 2022: $284
Median gross rent in Lansing, MI in 2022: $899
Housing units in Lansing with a mortgage: 19,664 (909 second mortgage, 97 home equity loan, 761 both second mortgage and home equity loan )Houses without a mortgage: 591
Median household income for houses/condos with a mortgage: $73,999
Median household income for apartments without a mortgage: $50,825
Median monthly housing costs: $903
Data:
Median house or condo value ($)
Median house or condo value ($ change since 2000)
Median house or condo value ($) - White
Median house or condo value ($) - Black or African American
Median house or condo value ($) - Asian
Median house or condo value ($) - Hispanic or Latino
Median house or condo value ($) - American Indian and Alaska Native
Median house or condo value ($) - Multirace
Median house or condo value ($) - Other Race
Median price asked for mobile homes ($)
Household density (households per square mile)
Mean house or condo value by units in structure - 1, detached ($)
Mean house or condo value by units in structure - 1, attached ($)
Mean house or condo value by units in structure - 2 ($)
Mean house or condo value by units in structure by units in structure - 3 or 4 ($)
Mean house or condo value by units in structure - 5 or more ($)
Mean house or condo value by units in structure - Boat, RV, van, etc. ($)
Mean house or condo value by units in structure - Mobile home ($)
Median contract rent ($)
Median contract rent - Lower quartile ($)
Median contract rent - Upper quartile ($)
Median gross rent ($)
Urban houses (%)
Rural houses (%)
Houses occupied (%)
Houses occupied (% change since 2000)
Houses owner occupied (%)
Houses owner occupied (% change since 2000)
Houses renter occupied (%)
Houses renter occupied (% change since 2000)
Vacant housing units - For rent (%)
Vacant housing units - For rent (% change since 2000)
Vacant housing units - For sale only (%)
Vacant housing units - For sale only (% change since 2000)
Vacant housing units - Rented or sold, not occupied (%)
Vacant housing units - Rented or sold, not occupied (% change since 2000)
Vacant housing units - For seasonal, recreational, or occasional use (%)
Vacant housing units - For seasonal, recreational, or occasional use (% change since 2000)
Vacant housing units - For migrant workers (%)
Vacant housing units - For migrant workers (% change since 2000)
Vacant housing units - Other vacant (%)
Vacant housing units - Other vacant (% change since 2000)
Median monthly housing costs ($)
Median household income for houses/condos with a mortgage ($)
Median household income for houses/condos without a mortgage ($)
Median household income ($)
Median household income ($) - White
Median household income ($) - Black or African American
Median household income ($) - Asian
Median household income ($) - Hispanic or Latino
Median household income ($) - American Indian and Alaska Native
Median household income ($) - Multirace
Median household income ($) - Other Race
Mortgage status - with mortgage (%)
Mortgage status - with second mortgage (%)
Mortgage status - with home equity loan (%)
Mortgage status - with both second mortgage and home equity loan (%)
Mortgage status - without a mortgage (%)
Median year house/condo built
Median year apartment built
Household type by relationship - Male householder living alone (%)
Household type by relationship - Male householder not living alone (%)
Household type by relationship - Female householder living alone (%)
Household type by relationship - Female householder not living alone (%)
Household type by relationship - Opposite-Sex spouse (%)
Household type by relationship - Same-Sex spouse (%)
Household type by relationship - Opposite-Sex unmarried partner (%)
Household type by relationship - Same-Sex unmarried partner (%)
Household type by relationship - In group quarters (%)
Size of family households - 2-person household (%)
Size of family households - 3-person household (%)
Size of family households - 4-person household (%)
Size of family households - 5-person household (%)
Size of family households - 6-person household (%)
Size of family households - 7-or-more-person household (%)
Size of nonfamily households - 1-person household (%)
Size of nonfamily households - 2-person household (%)
Size of nonfamily households - 3-person household (%)
Size of nonfamily households - 4-person household (%)
Size of nonfamily households - 5-person household (%)
Size of nonfamily households - 6-person household (%)
Size of nonfamily households - 7-or-moreperson household (%)
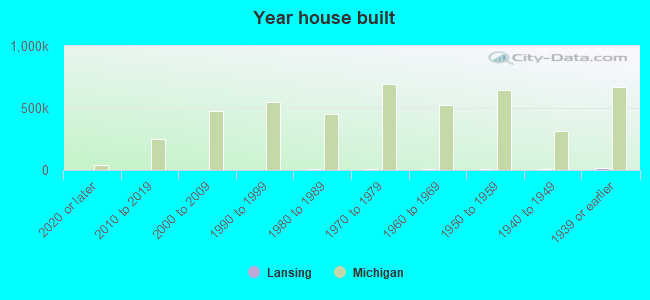
Year house built - Built 2010 or later (%)
Year house built - Built 2000 to 2009 (%)
Year house built - Built 1990 to 1999 (%)
Year house built - Built 1980 to 1989 (%)
Year house built - Built 1970 to 1979 (%)
Year house built - Built 1960 to 1969 (%)
Year house built - Built 1950 to 1959 (%)
Year house built - Built 1940 to 1949 (%)
Year house built - Built 1939 or earlier (%)
Median number of rooms in houses and condos
Median number of rooms in apartments
Median number of bedrooms in owner occupied houses
Mean number of bedrooms in owner occupied houses
Median number of bedrooms in renter occupied houses
Mean number of bedrooms in renter occupied houses
Median number of vehichles in owner occupied houses
Mean number of vehichles in owner occupied houses
Median number of vehichles in renter occupied houses
Mean number of vehichles in renter occupied houses
Rooms in owner-occupied houses - 1 room (%)
Rooms in owner-occupied houses - 2 rooms (%)
Rooms in owner-occupied houses - 3 rooms (%)
Rooms in owner-occupied houses - 4 rooms (%)
Rooms in owner-occupied houses - 5 rooms (%)
Rooms in owner-occupied houses - 6 rooms (%)
Rooms in owner-occupied houses - 7 rooms (%)
Rooms in owner-occupied houses - 8 rooms (%)
Rooms in owner-occupied houses - 9+ rooms (%)
Rooms in renter-occupied houses - 1 room (%)
Rooms in renter-occupied houses - 2 rooms (%)
Rooms in renter-occupied houses - 3 rooms (%)
Rooms in renter-occupied houses - 4 rooms (%)
Rooms in renter-occupied houses - 5 rooms (%)
Rooms in renter-occupied houses - 6 rooms (%)
Rooms in renter-occupied houses - 7 rooms (%)
Rooms in renter-occupied houses - 8 rooms (%)
Rooms in renter-occupied houses - 9+ rooms (%)
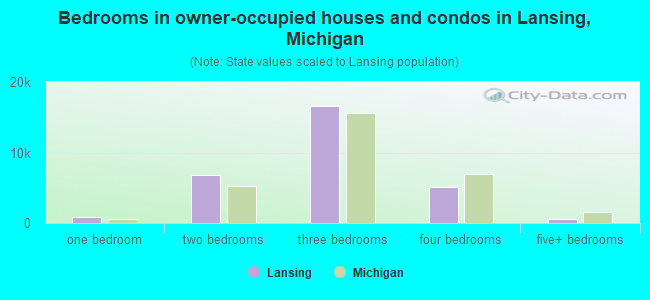
Bedrooms in owner-occupied houses - no bedrooms (%)
Bedrooms in owner-occupied houses - 1 bedroom (%)
Bedrooms in owner-occupied houses - 2 bedrooms (%)
Bedrooms in owner-occupied houses - 3 bedrooms (%)
Bedrooms in owner-occupied houses - 4 bedrooms (%)
Bedrooms in owner-occupied houses - 5+ bedrooms (%)
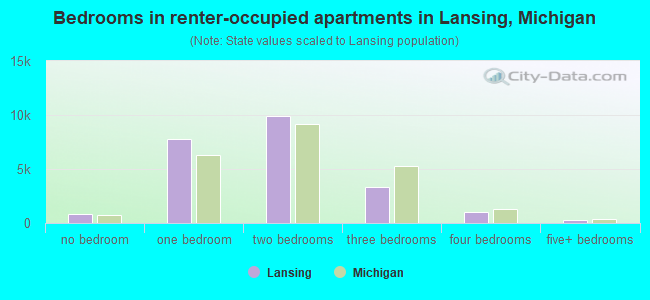
Bedrooms in renter-occupied houses - no bedrooms (%)
Bedrooms in renter-occupied houses - 1 bedroom (%)
Bedrooms in renter-occupied houses - 2 bedrooms (%)
Bedrooms in renter-occupied houses - 3 bedrooms (%)
Bedrooms in renter-occupied houses - 4 bedrooms (%)
Bedrooms in renter-occupied houses - 5+ bedrooms (%)
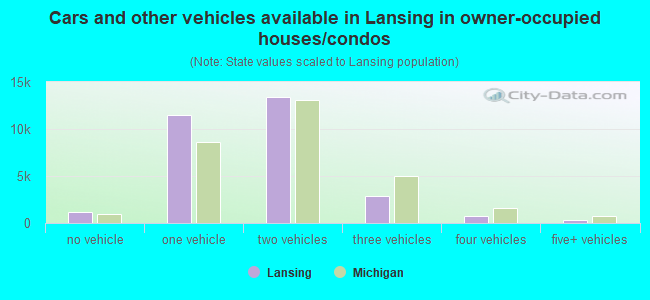
Vehicles available in owner-occupied houses - no vehicle available (%)
Vehicles available in owner-occupied houses - 1 vehicle available(%)
Vehicles available in owner-occupied houses - 2 Vehicles available (%)
Vehicles available in owner-occupied houses - 3 Vehicles available (%)
Vehicles available in owner-occupied houses - 4 Vehicles available (%)
Vehicles available in owner-occupied houses - 5+ Vehicles available (%)
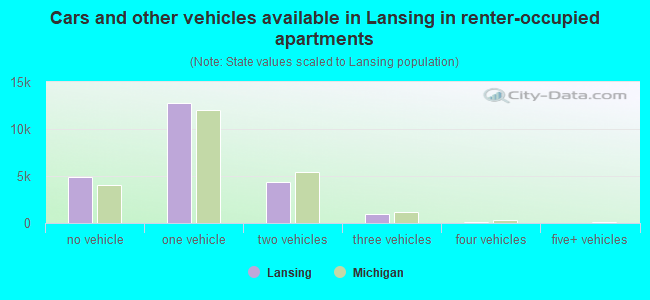
Vehicles available in renter-occupied houses - no vehicle available (%)
Vehicles available in renter-occupied houses - 1 vehicle available (%)
Vehicles available in renter-occupied houses - 2 Vehicles available (%)
Vehicles available in renter-occupied houses - 3 Vehicles available (%)
Vehicles available in renter-occupied houses - 4 Vehicles available (%)
Vehicles available in renter-occupied houses - 5+ Vehicles available (%)
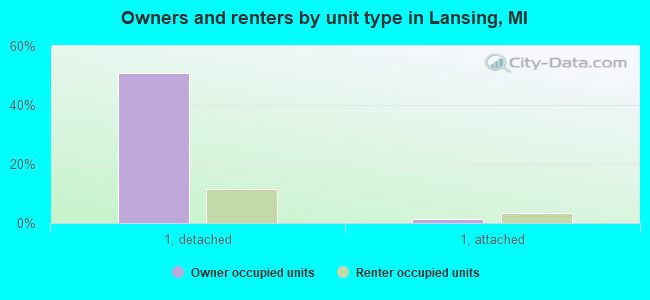
Housing units in structures - 1, detached (%)
Housing units in structures - 1, attached (%)
Housing units in structures - 2 (%)
Housing units in structures - 3 or 4 (%)
Housing units in structures - 5 to 9 (%)
Housing units in structures - 10 to 19 (%)
Housing units in structures - 20 to 49 (%)
Housing units in structures - 50 or more (%)
Housing units in structures - Mobile home (%)
Housing units in structures - Boat, RV, van, etc. (%)
Housing units in structures - Owners - 1, detached (%)
Housing units in structures - Owners - 1, attached (%)
Housing units in structures - Owners - 2 (%)
Housing units in structures - Owners - 3 or 4 (%)
Housing units in structures - Owners - 5 to 9 (%)
Housing units in structures - Owners - 10 to 19 (%)
Housing units in structures - Owners - 20 to 49 (%)
Housing units in structures - Owners - 50 or more (%)
Housing units in structures - Owners - Mobile home (%)
Housing units in structures - Owners - Boat, RV, van, etc. (%)
Housing units in structures - Renters - 1, detached (%)
Housing units in structures - Renters - 1, attached (%)
Housing units in structures - Renters - 2 (%)
Housing units in structures - Renters - 3 or 4 (%)
Housing units in structures - Renters - 5 to 9 (%)
Housing units in structures - Renters - 10 to 19 (%)
Housing units in structures - Renters - 20 to 49 (%)
Housing units in structures - Renters - 50 or more (%)
Housing units in structures - Renters - Mobile home (%)
Housing units in structures - Renters - Boat, RV, van, etc. (%)
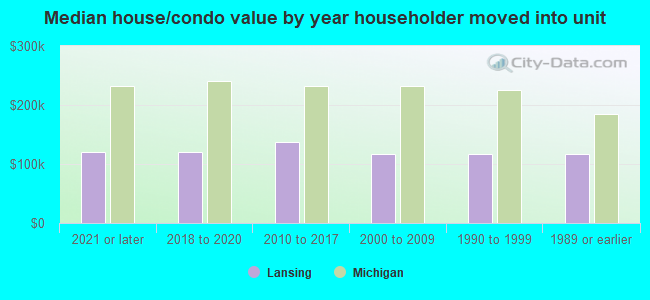
House/condo owner moved in on average (years ago)
Renter moved in on average (years ago)
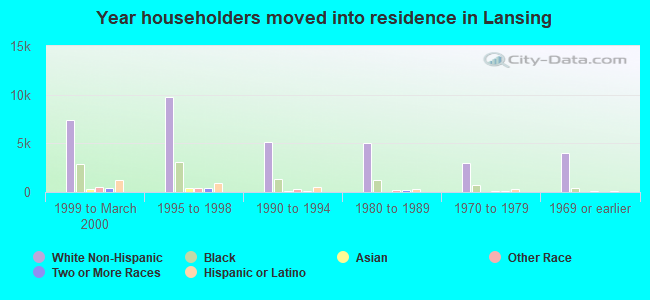
Year householder moved into unit - Moved in 1999 to March 2000 (%)
Year householder moved into unit - Moved in 1999 to March 2000 (%) - White
Year householder moved into unit - Moved in 1999 to March 2000 (%) - Black or African American
Year householder moved into unit - Moved in 1999 to March 2000 (%) - Asian
Year householder moved into unit - Moved in 1999 to March 2000 (%) - Hispanic or Latino
Year householder moved into unit - Moved in 1999 to March 2000 (%) - American Indian and Alaska Native
Year householder moved into unit - Moved in 1999 to March 2000 (%) - Multirace
Year householder moved into unit - Moved in 1999 to March 2000 (%) - Other Race
Year householder moved into unit - Moved in 1995 to 1998 (%)
Year householder moved into unit - Moved in 1995 to 1998 (%) - White
Year householder moved into unit - Moved in 1995 to 1998 (%) - Black or African American
Year householder moved into unit - Moved in 1995 to 1998 (%) - Asian
Year householder moved into unit - Moved in 1995 to 1998 (%) - Hispanic or Latino
Year householder moved into unit - Moved in 1995 to 1998 (%) - American Indian and Alaska Native
Year householder moved into unit - Moved in 1995 to 1998 (%) - Multirace
Year householder moved into unit - Moved in 1995 to 1998 (%) - Other Race
Year householder moved into unit - Moved in 1990 to 1994 (%)
Year householder moved into unit - Moved in 1990 to 1994 (%) - White
Year householder moved into unit - Moved in 1990 to 1994 (%) - Black or African American
Year householder moved into unit - Moved in 1990 to 1994 (%) - Asian
Year householder moved into unit - Moved in 1990 to 1994 (%) - Hispanic or Latino
Year householder moved into unit - Moved in 1990 to 1994 (%) - American Indian and Alaska Native
Year householder moved into unit - Moved in 1990 to 1994 (%) - Multirace
Year householder moved into unit - Moved in 1990 to 1994 (%) - Other Race
Year householder moved into unit - Moved in 1980 to 1989 (%)
Year householder moved into unit - Moved in 1980 to 1989 (%) - White
Year householder moved into unit - Moved in 1980 to 1989 (%) - Black or African American
Year householder moved into unit - Moved in 1980 to 1989 (%) - Asian
Year householder moved into unit - Moved in 1980 to 1989 (%) - Hispanic or Latino
Year householder moved into unit - Moved in 1980 to 1989 (%) - American Indian and Alaska Native
Year householder moved into unit - Moved in 1980 to 1989 (%) - Multirace
Year householder moved into unit - Moved in 1980 to 1989 (%) - Other Race
Year householder moved into unit - Moved in 1970 to 1979 (%)
Year householder moved into unit - Moved in 1970 to 1979 (%) - White
Year householder moved into unit - Moved in 1970 to 1979 (%) - Black or African American
Year householder moved into unit - Moved in 1970 to 1979 (%) - Asian
Year householder moved into unit - Moved in 1970 to 1979 (%) - Hispanic or Latino
Year householder moved into unit - Moved in 1970 to 1979 (%) - American Indian and Alaska Native
Year householder moved into unit - Moved in 1970 to 1979 (%) - Multirace
Year householder moved into unit - Moved in 1970 to 1979 (%) - Other Race
Year householder moved into unit - Moved in 1969 or earlier (%)
Year householder moved into unit - Moved in 1969 or earlier (%) - White
Year householder moved into unit - Moved in 1969 or earlier (%) - Black or African American
Year householder moved into unit - Moved in 1969 or earlier (%) - Asian
Year householder moved into unit - Moved in 1969 or earlier (%) - Hispanic or Latino
Year householder moved into unit - Moved in 1969 or earlier (%) - American Indian and Alaska Native
Year householder moved into unit - Moved in 1969 or earlier (%) - Multirace
Year householder moved into unit - Moved in 1969 or earlier (%) - Other Race
Housing units lacking complete plumbing facilities (%)
Housing units lacking complete kitchen facilities (%)
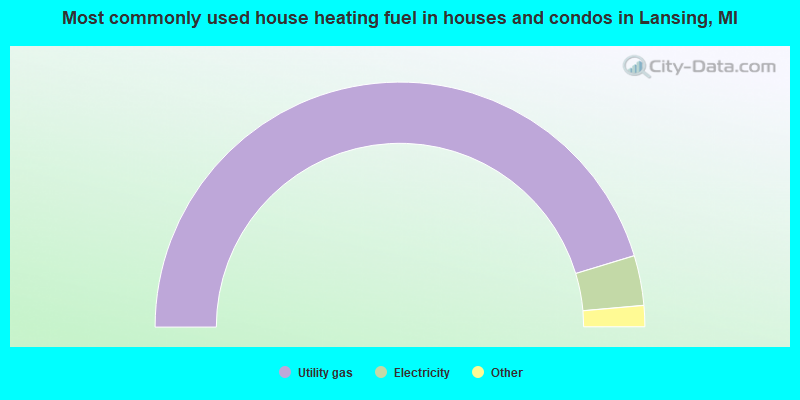
House heating fuel used in houses and condos - Utility gas (%)
House heating fuel used in houses and condos - Bottled, tank, or LP gas (%)
House heating fuel used in houses and condos - Electricity (%)
House heating fuel used in houses and condos - Fuel oil, kerosene, etc. (%)
House heating fuel used in houses and condos - Coal or coke (%)
House heating fuel used in houses and condos - Wood (%)
House heating fuel used in houses and condos - Solar energy (%)
House heating fuel used in houses and condos - Other fuel (%)
House heating fuel used in houses and condos - No fuel used (%)
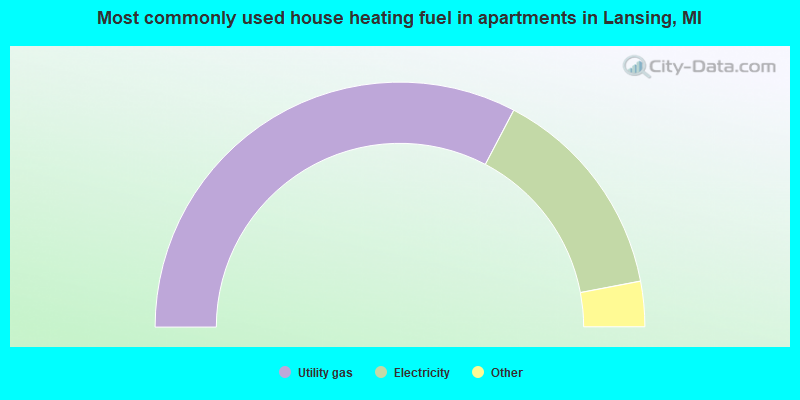
House heating fuel used in apartments - Utility gas (%)
House heating fuel used in apartments - Bottled, tank, or LP gas (%)
House heating fuel used in apartments - Electricity (%)
House heating fuel used in apartments - Fuel oil, kerosene, etc. (%)
House heating fuel used in apartments - Coal or coke (%)
House heating fuel used in apartments - Wood (%)
House heating fuel used in apartments - Solar energy (%)
House heating fuel used in apartments - Other fuel (%)
House heating fuel used in apartments - No fuel used (%)
Latest news about housing in Lansing, MI collected exclusively by city-data.com from local newspapers, TV, and radio stations
Median year house/condo built: 1957Median year apartment built: 1971Household type by relationship:
Households: 112,963
Male householders: 26,851 (12,337 living alone ), Female householders: 26,296 (11,192 living alone )14,204 spouses (13,710 opposite-sex spouses ), 6,467 unmarried partners , (6,331 opposite-sex unmarried partners ), 27,316 children (26,123 natural , 39 adopted , 1,154 stepchildren ), 3,283 grandchildren , 418 brothers or sisters , 578 parents , 0 foster children , 1,878 other relatives , 4,471 non-relatives In group quarters: 1,201
Size of family households: 10,417 2-persons , 5,850 3-persons , 4,658 4-persons , 1,395 5-persons , 1,228 6-persons , 225 7-or-more-persons .
Size of nonfamily households: 23,529 1-person , 4,812 2-persons , 643 3-persons , 75 4-persons , 264 5-persons , 51 7-or-more-persons .
9,602 married couples with children. single-parent households (4,129 men , 5,889 women ).
84.9% of residents of Lansing speak English at home. of residents speak Spanish at home (64% speak English very well , 18% speak English well , 13% speak English not well , 5% don't speak English at all ).of residents speak other Indo-European language at home (62% speak English very well , 16% speak English well , 20% speak English not well , 2% don't speak English at all ).of residents speak Asian or Pacific Island language at home (60% speak English very well , 28% speak English well , 8% speak English not well , 4% don't speak English at all ).of residents speak other language at home (57% speak English very well , 26% speak English well , 12% speak English not well , 5% don't speak English at all ).
Foreign born population: 8,551 (7.6%)of them are naturalized citizens )
Median number of rooms in houses and condos:
Median number of rooms in apartments
Owner-occupied Renter-occupied
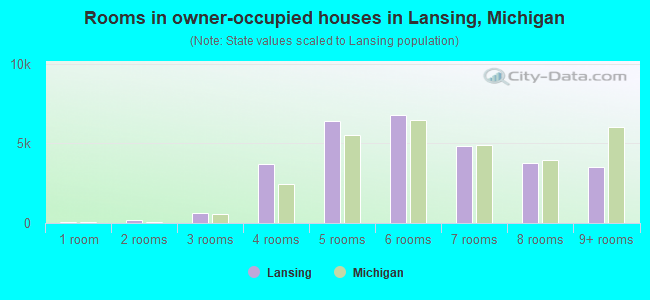
Rooms in owner-occupied houses in Lansing, Michigan
90 1 room 188 2 rooms 607 3 rooms 3,714 4 rooms 6,415 5 rooms 6,792 6 rooms 4,855 7 rooms 3,785 8 rooms 3,540 9+ rooms
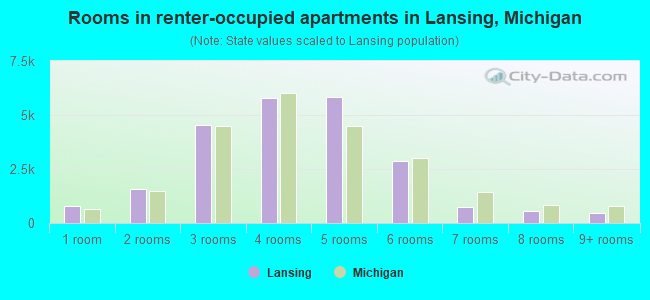
Rooms in renter-occupied apartments in Lansing, Michigan
791 1 room 1,569 2 rooms 4,524 3 rooms 5,794 4 rooms 5,842 5 rooms 2,868 6 rooms 752 7 rooms 538 8 rooms 483 9+ rooms
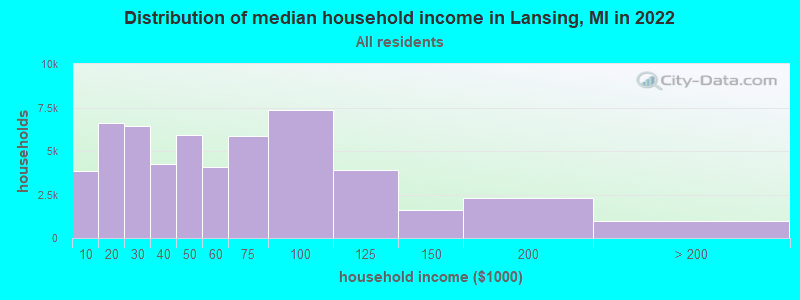
Lansing, MI household income distribution 3,864 Less than $10,0006,628 $10,000 to $19,9996,426 $20,000 to $29,9994,234 $30,000 to $39,9995,932 $40,000 to $49,9994,080 $50,000 to $59,9995,849 $60,000 to $74,9997,368 $75,000 to $99,9993,918 $100,000 to $124,9991,612 $125,000 to $149,9992,277 $150,000 to $199,999959 $200,000 or more
Home value of owner - occupied houses in 2022 in Lansing, MI 341 Less than $10,000221 $10,000 to $14,999198 $15,000 to $19,999773 $20,000 to $24,999206 $25,000 to $29,99945 $30,000 to $34,99948 $35,000 to $39,999566 $40,000 to $49,9991,093 $50,000 to $59,9991,735 $60,000 to $69,9991,508 $70,000 to $79,9991,198 $80,000 to $89,9992,124 $90,000 to $99,9995,512 $100,000 to $124,9993,953 $125,000 to $149,9993,350 $150,000 to $174,9991,873 $175,000 to $199,9992,364 $200,000 to $249,999830 $250,000 to $299,999459 $300,000 to $399,999255 $400,000 to $499,999650 $500,000 to $749,999627 $750,000 to $999,99957 $1,500,000 to $1,999,999Rent paid by renters in 2022 in Lansing, MI 172 Less than $100181 $150 to $199390 $200 to $249142 $250 to $299790 $300 to $349527 $350 to $399174 $400 to $449240 $450 to $4991,297 $500 to $549759 $550 to $5991,217 $600 to $6491,586 $650 to $6992,870 $700 to $7491,688 $750 to $7993,439 $800 to $8993,014 $900 to $9992,972 $1,000 to $1,249570 $1,250 to $1,499183 $1,500 to $1,999950 No cash rent
Percentage of workers working in this county: 80.2%Number of people working at home: 7,518 (13.2% of all workers )
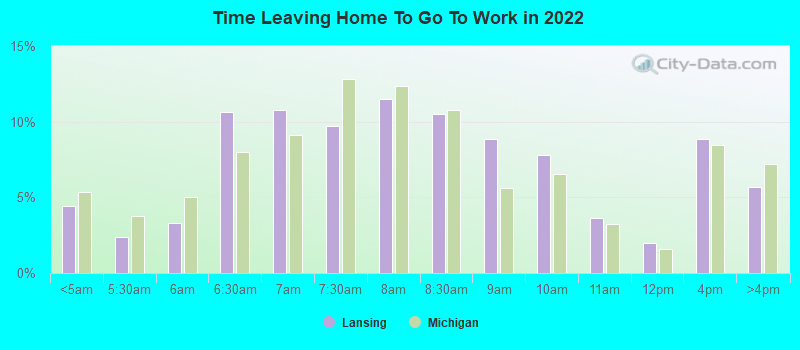
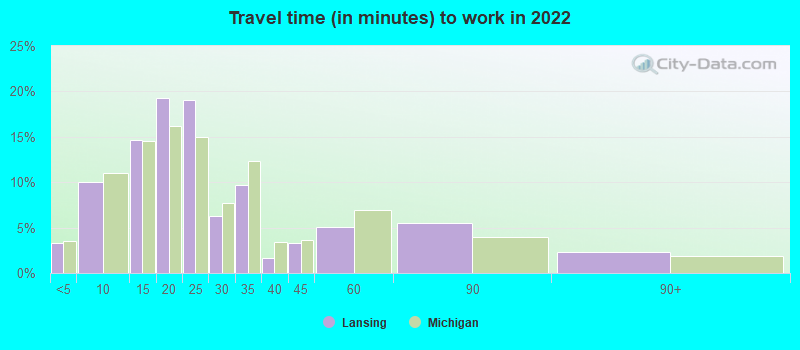
Travel time to work (commute)
Less than 5 minutes: 1,9245 to 9 minutes: 5,62810 to 14 minutes: 10,30115 to 19 minutes: 13,44220 to 24 minutes: 8,31025 to 29 minutes: 1,76030 to 34 minutes: 2,38635 to 39 minutes: 3340 to 44 minutes: 79945 to 59 minutes: 1,71760 to 89 minutes: 69890 or more minutes: 805
Means of transportation to work:
Drove a car alone: 55,427 (74.9%)Carpooled: 6,272 (8.5%)Bus : 1,066 (1.4%)Taxi: 1,141 (1.5%)Bicycle: 206 (0.3%)Walked: 762 (1.0%)Worked at home: 9,105 (12.3%)
Unemployment by race in 2022
Unemployment rate for White non-Hispanic residents 4.2% Males1.9% FemalesUnemployment rate for Black residents 14.5% Males10.7% FemalesUnemployment rate for American Indian and Alaska Native residents 3.3% Males6.6% FemalesUnemployment rate for Asian residents 0.2% Males2.9% FemalesUnemployment rate for other race residents 8.5% FemalesUnemployment rate for two or more race residents 10.3% Males15.7% FemalesUnemployment rate for Hispanic or Latino residents 3.2% Males5.7% Females
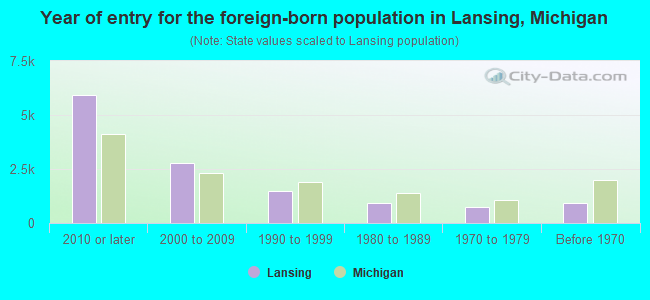
Year of entry for the foreign-born population in Lansing, Michigan
5,912 2010 or later 2,799 2000 to 2009 1,477 1990 to 1999 949 1980 to 1989 727 1970 to 1979 937 Before 1970
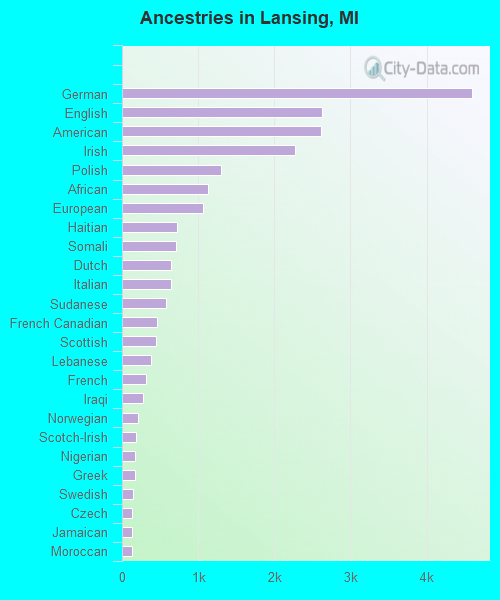
First ancestries reported:
German: 4,589 (9.0%)
English: 2,624 (5.1%)
American: 2,611 (5.1%)
Irish: 2,267 (4.4%)
Polish: 1,301 (2.5%)
African: 1,126 (2.2%)
European: 1,061 (2.1%)
Haitian: 726 (1.4%)
Somali: 707 (1.4%)
Dutch: 645 (1.3%)
Italian: 644 (1.3%)
Sudanese: 578 (1.1%)
French Canadian: 458 (0.9%)
Scottish: 444 (0.9%)
Lebanese: 381 (0.7%)
French: 311 (0.6%)
Iraqi: 271 (0.5%)
Norwegian: 215 (0.4%)
Scotch-Irish: 186 (0.4%)
Nigerian: 175 (0.3%)
Greek: 165 (0.3%)
Swedish: 138 (0.3%)
Czech: 134 (0.3%)
Jamaican: 130 (0.3%)
Moroccan: 127 (0.2%)
Russian: 119 (0.2%)
Danish: 93 (0.2%)
Ugandan: 80 (0.2%)
Welsh: 80 (0.2%)
British: 78 (0.2%)
Egyptian: 68 (0.1%)
Romanian: 68 (0.1%)
Iranian: 68 (0.1%)
Scandinavian: 68 (0.1%)
Hungarian: 60 (0.1%)
Finnish: 57 (0.1%)
Afghan: 51 (0.10%)
Eastern European: 51 (0.10%)
Ukrainian: 44 (0.09%)
Northern European: 43 (0.08%)
Belgian: 42 (0.08%)
Arab: 41 (0.08%)
Syrian: 36 (0.07%)
Palestinian: 34 (0.07%)
Canadian: 30 (0.06%)
Ghanaian: 27 (0.05%)
Lithuanian: 26 (0.05%)
Liberian: 24 (0.05%)
Armenian: 21 (0.04%)
Czechoslovakian: 20 (0.04%)
Brazilian: 20 (0.04%)
Croatian: 17 (0.03%)
Ethiopian: 16 (0.03%)
Bulgarian: 14 (0.03%)
Trinidadian and Tobagonian: 14 (0.03%)
Yugoslavian: 11 (0.02%)
Slovene: 10 (0.02%)
Kenyan: 10 (0.02%)
Pennsylvania German: 9 (0.02%)
Macedonian: 7 (0.01%)
Turkish: 7 (0.01%)
Swiss: 6 (0.01%)
Israeli: 6 (0.01%)
Maltese: 5 (0.01%)
Slovak: 4 (0.01%)
Most common places of birth for foreign-born residents (%): Mexico Lansing:
11.0% (1,224)Michigan:
10.9% (75,965)
India Lansing:
6.5% (728)Michigan:
11.1% (77,240)
Somalia Lansing:
6.2% (687)Michigan:
0.1% (1,042)
Cuba Lansing:
5.6% (620)Michigan:
0.9% (6,481)
Sudan Lansing:
5.6% (619)Michigan:
0.3% (1,860)
China, excluding Hong Kong and Taiwan Lansing:
5.0% (552)Michigan:
4.9% (34,295)
Other Eastern Africa Lansing:
4.2% (462)Michigan:
0.5% (3,687)
Burma (Myanmar) Lansing:
3.9% (437)Michigan:
0.6% (4,087)
Vietnam Lansing:
3.8% (427)Michigan:
1.8% (12,679)
Bhutan Lansing:
3.7% (411)Michigan:
0.1% (825)
Nepal Lansing:
3.4% (378)Michigan:
0.4% (2,853)
Haiti Lansing:
3.2% (354)Michigan:
0.2% (1,481)
Canada Lansing:
2.6% (293)Michigan:
5.0% (35,052)
Iraq Lansing:
2.6% (291)Michigan:
8.1% (55,954)
Other Middle Africa Lansing:
2.4% (271)Michigan:
0.1% (536)
Philippines Lansing:
2.4% (270)Michigan:
2.8% (19,112)
Korea Lansing:
2.0% (218)Michigan:
3.0% (20,884)
Ghana Lansing:
1.6% (183)Michigan:
0.3% (1,811)
Place of birth for U.S.-born residents:
This state: 81,918Other state: 21,563Northeast: 3,500Midwest: 7,110South: 7,652West: 3,301 82.8% of Lansing residents lived in the same house 1 years ago.
Out of people who lived in different houses, 34.6% lived in this county.
Out of people who lived in different counties, 68.5% lived in Michigan.
Lansing:
82.8%State average:
88.4%
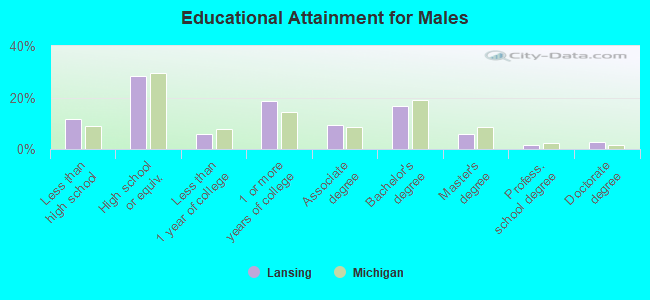
Education attainment for males 25 years and older:
No schooling: 1,194Nursery to 4th grade: 475th and 6th grade: 1187th and 8th grade: 3199th grade: 20310th grade: 45211th grade: 1,08612th grade, no diploma: 841High school graduate (or equivalency): 10,375Less than 1 year of college: 2,174Some college more than 1 year, no degree: 6,806Associate degree: 3,388Bachelor's degree: 6,148Master's degree: 2,164Professional school degree: 543Doctorate degree: 943
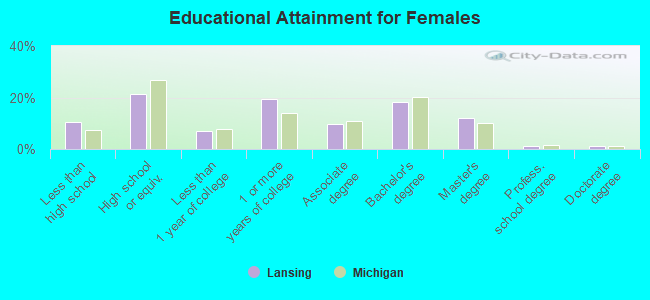
Education attainment for females 25 years and older:
No schooling: 1,019Nursery to 4th grade: 4635th and 6th grade: 1007th and 8th grade: 1549th grade: 9410th grade: 76411th grade: 79212th grade, no diploma: 558High school graduate (or equivalency): 8,087Less than 1 year of college: 2,593Some college more than 1 year, no degree: 7,342Associate degree: 3,695Bachelor's degree: 6,947Master's degree: 4,599Professional school degree: 449Doctorate degree: 424
Housing units in structures:
One, detached: 34,708One, attached: 1,925Two: 1,3933 or 4: 2,2185 to 9: 2,34510 to 19: 4,92520 to 49: 1,98950 or more: 4,853Mobile homes: 1,598Median worth of mobile homes: $23,300
Housing units lacking complete plumbing facilities in 2022: 1.7%Housing units lacking complete kitchen facilities in 2022: 0.7%House/condo owner moved in on average 10 years ago
Renter moved in on average 2 years ago
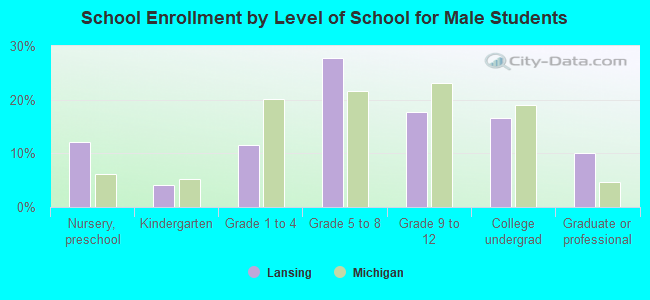
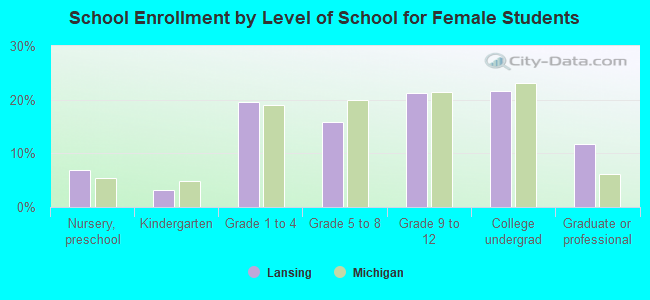
Private vs. public school enrollment:
Students in private schools in grades 1 to 8 (elementary and middle school): 650 Students in private schools in grades 9 to 12 (high school): 268 Students in private undergraduate colleges: 98