Housing density: 1,029 houses/condos per square mile
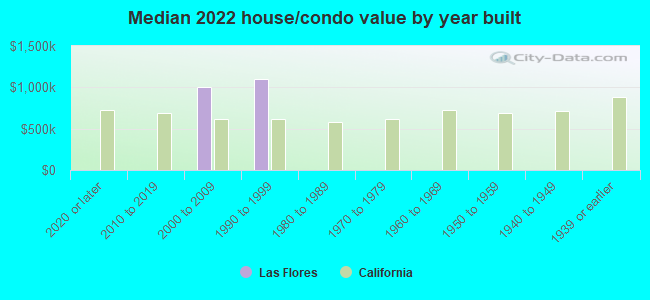
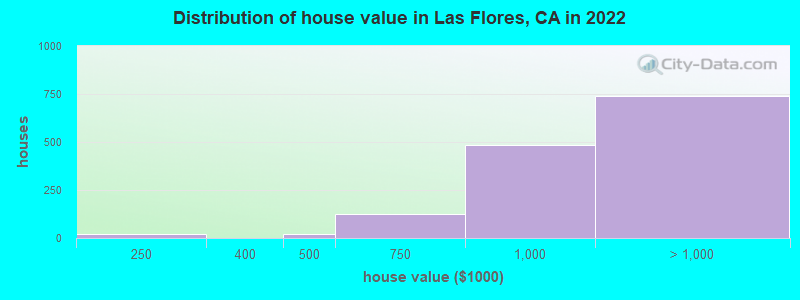
Median price asked for vacant for-sale houses and condos in 2022 in this county: $1,279,555.
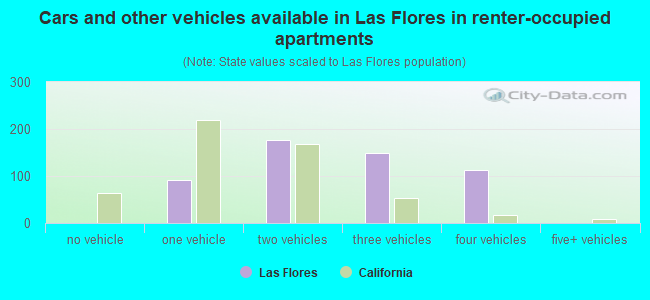
Median contract rent in 2022: over $2,000 (lower quartile is over $2,000, upper quartile is over $2,000)
Median rent asked for vacant for-rent units in 2022: $3,080
Median gross rent in Las Flores, CA in 2022: over $2,000
Housing units in Las Flores with a mortgage: 1,188 (128 second mortgage, 0 home equity loan, 119 both second mortgage and home equity loan) Houses without a mortgage: 0
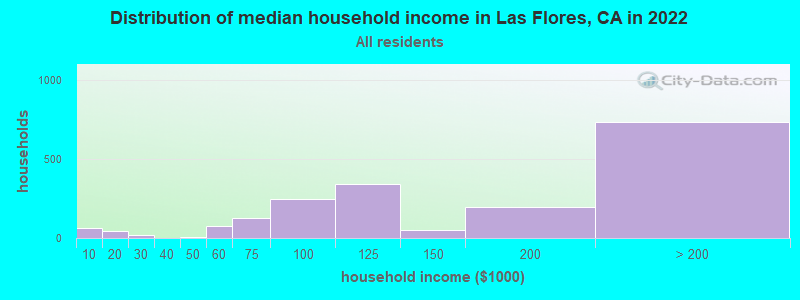
Median household income for houses/condos with a mortgage: $213,563
1,139 married couples with children.
200 single-parent households (0 men, 200 women).
75.1% of residents of Las Flores speak English at home.
5.5% of residents speak Spanish at home (55% speak English very well, 45% speak English well).
8.4% of residents speak other Indo-European language at home (61% speak English very well, 27% speak English well, 12% speak English not well).
5.0% of residents speak Asian or Pacific Island language at home (71% speak English very well, 20% speak English well, 9% don't speak English at all).
4.2% of residents speak other language at home (86% speak English very well, 4% speak English well, 10% speak English not well).
Foreign born population: 871 (15.2%)
(75.9% of them are naturalized citizens)
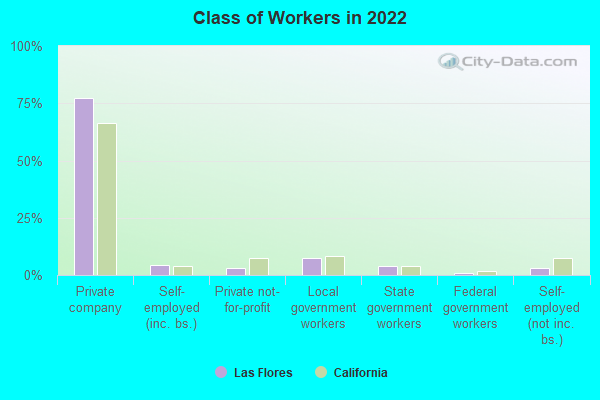
Percentage of workers working in this county: 88.8% Number of people working at home: 649 (19.9% of all workers)
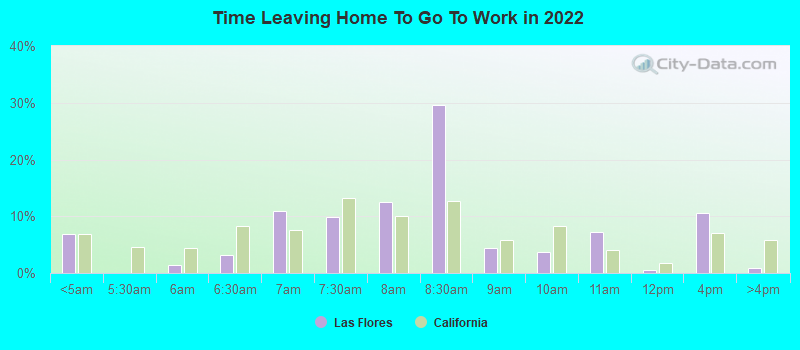
Travel time to work (commute)
Less than 5 minutes: 0
5 to 9 minutes: 137
10 to 14 minutes: 439
15 to 19 minutes: 247
20 to 24 minutes: 543
25 to 29 minutes: 238
30 to 34 minutes: 456
35 to 39 minutes: 99
40 to 44 minutes: 81
45 to 59 minutes: 211
60 to 89 minutes: 76
90 or more minutes: 90
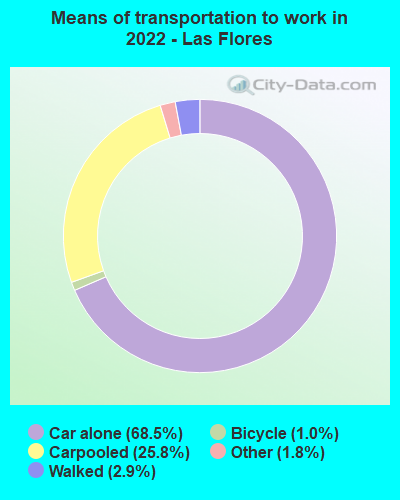
Means of transportation to work:
Drove a car alone: 545 (39.9%)
Carpooled: 222 (16.3%)
Taxi: 16 (1.2%)
Bicycle: 8 (0.6%)
Walked: 23 (1.7%)
Worked at home: 649 (47.5%)
Unemployment by race in 2022
Unemployment rate for White non-Hispanic residents
4.0%Males
1.5%Females
Unemployment rate for Asian residents
5.8%Males
Unemployment rate for two or more race residents
4.0%Males
3.0%Females
Unemployment rate for Hispanic or Latino residents
3.3%Females
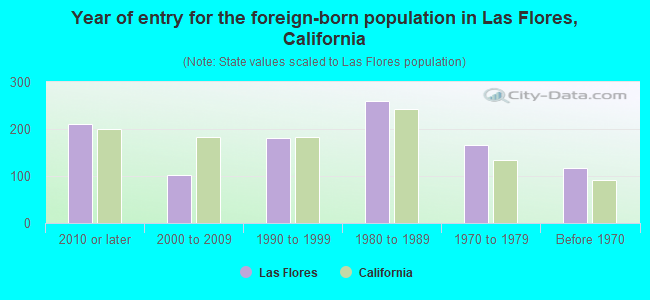
Year of entry for the foreign-born population in Las Flores, California
2102010 or later
1022000 to 2009
1811990 to 1999
2601980 to 1989
1661970 to 1979
116Before 1970
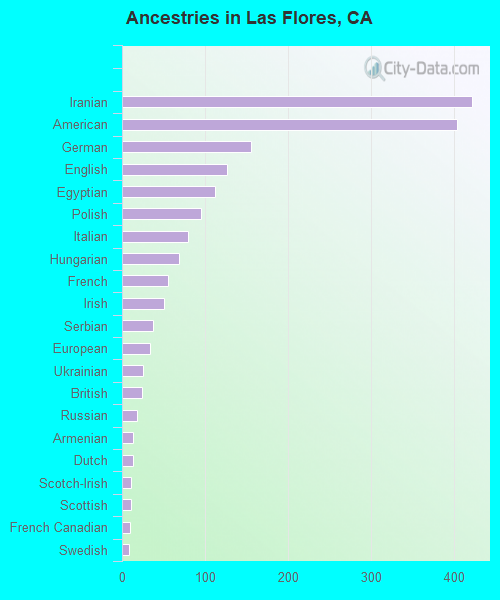
First ancestries reported:
Iranian: 421 (16.2%)
American: 403 (15.5%)
German: 155 (6.0%)
English: 126 (4.9%)
Egyptian: 112 (4.3%)
Polish: 95 (3.7%)
Italian: 80 (3.1%)
Hungarian: 69 (2.7%)
French: 56 (2.2%)
Irish: 50 (1.9%)
Serbian: 37 (1.4%)
European: 34 (1.3%)
Ukrainian: 25 (1.0%)
British: 24 (0.9%)
Russian: 18 (0.7%)
Armenian: 13 (0.5%)
Dutch: 13 (0.5%)
Scotch-Irish: 11 (0.4%)
Scottish: 11 (0.4%)
French Canadian: 10 (0.4%)
Swedish: 9 (0.3%)
Most common places of birth for foreign-born residents (%):
Iran
Las Flores:
26.6% (232)
California:
2.0% (206,004)
Mexico
Las Flores:
14.8% (129)
California:
37.2% (3,881,193)
Philippines
Las Flores:
11.3% (98)
California:
7.8% (818,297)
Kazakhstan
Las Flores:
10.6% (92)
California:
0.1% (6,648)
United Arab Emirates
Las Flores:
6.1% (53)
California:
0.0% (4,588)
China, excluding Hong Kong and Taiwan
Las Flores:
5.3% (46)
California:
6.6% (684,672)
Asia, n.e.c.
Las Flores:
4.7% (41)
California:
0.1% (11,122)
Other Eastern Europe
Las Flores:
3.8% (33)
California:
0.2% (17,699)
United Kingdom, excluding England and Scotland
Las Flores:
3.7% (32)
California:
0.6% (60,582)
India
Las Flores:
3.1% (27)
California:
5.2% (539,184)
Cambodia
Las Flores:
3.0% (26)
California:
0.5% (51,974)
Laos
Las Flores:
2.4% (21)
California:
0.5% (48,911)
Serbia
Las Flores:
2.1% (18)
California:
0.0% (4,595)
Korea
Las Flores:
2.1% (18)
California:
3.0% (315,248)
Egypt
Las Flores:
1.8% (16)
California:
0.4% (42,718)
Saudi Arabia
Las Flores:
1.7% (15)
California:
0.1% (7,408)
Place of birth for U.S.-born residents:
This state: 3,975
Other state: 808
Northeast: 121
Midwest: 379
South: 115
West: 187
84.9% of Las Flores residents lived in the same house 1 years ago. Out of people who lived in different houses, 48.8% lived in this county. Out of people who lived in different counties, 86.3% lived in California.
Las Flores:
84.9%
State average:
88.9%
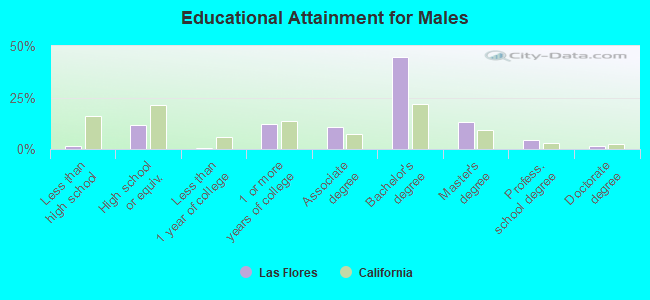
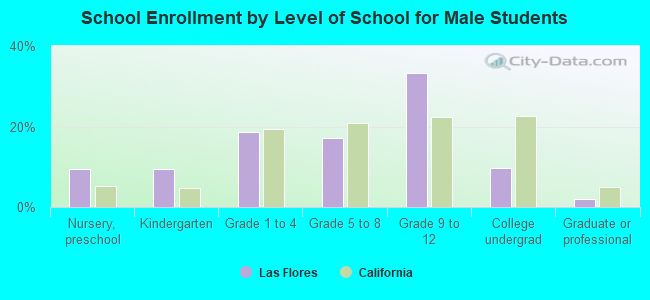
Education attainment for males 25 years and older:
No schooling: 0
Nursery to 4th grade: 0
5th and 6th grade: 0
7th and 8th grade: 0
9th grade: 0
10th grade: 10
11th grade: 0
12th grade, no diploma: 20
High school graduate (or equivalency): 207
Less than 1 year of college: 12
Some college more than 1 year, no degree: 221
Associate degree: 191
Bachelor's degree: 801
Master's degree: 234
Professional school degree: 77
Doctorate degree: 25
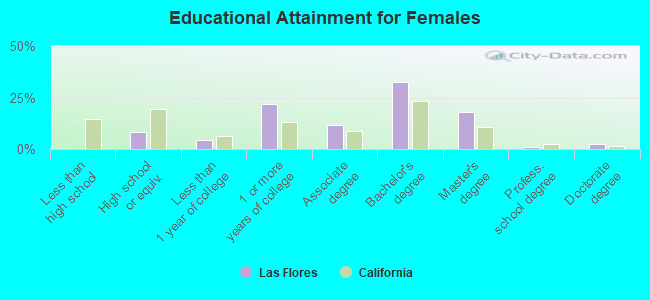
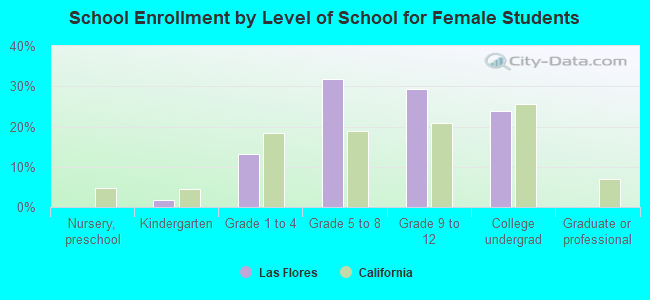
Education attainment for females 25 years and older:
No schooling: 0
Nursery to 4th grade: 0
5th and 6th grade: 0
7th and 8th grade: 0
9th grade: 0
10th grade: 0
11th grade: 0
12th grade, no diploma: 0
High school graduate (or equivalency): 143
Less than 1 year of college: 78
Some college more than 1 year, no degree: 390
Associate degree: 203
Bachelor's degree: 572
Master's degree: 321
Professional school degree: 19
Doctorate degree: 42
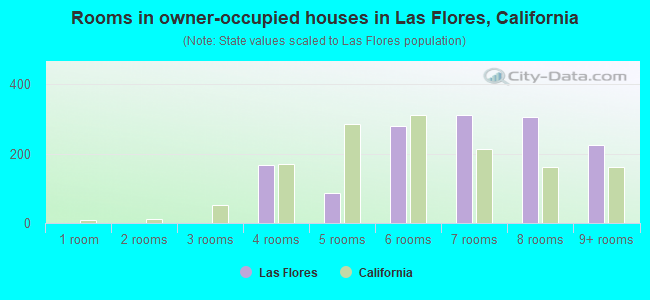
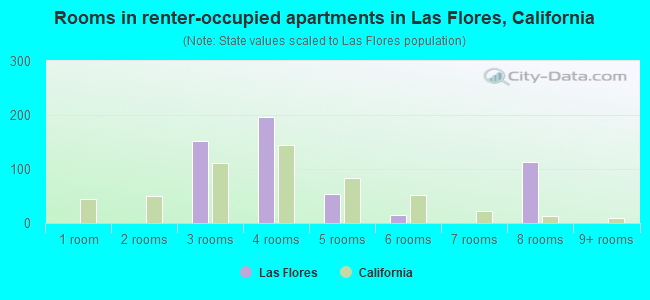
Housing units in structures:
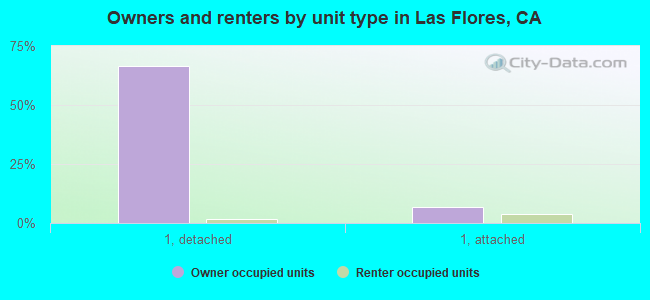
One, detached: 1,270
One, attached: 251
5 to 9: 62
10 to 19: 59
20 to 49: 177
50 or more: 206
Boats, RVs, vans, etc.: 27
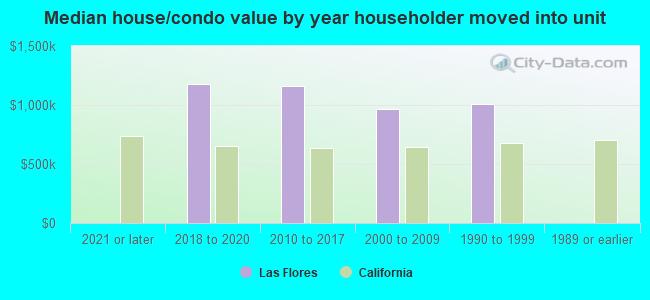
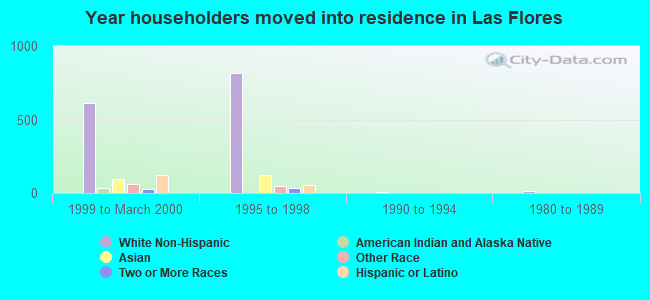
House/condo owner moved in on average 12 years ago