Lawrenceville, OH (Ohio) Houses and Residents
| Lawrenceville: | |
| Ohio: |
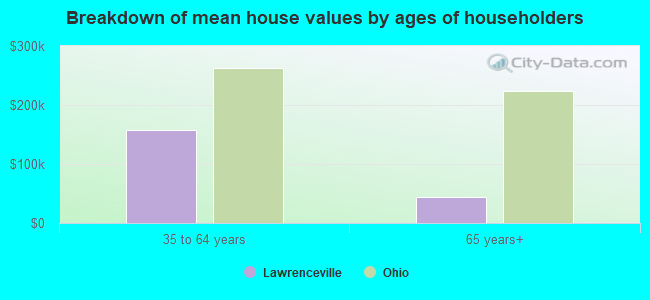
Mean price in 2022:
Detached houses: $247,944
Here: $247,944 State: $254,366 Mobile homes: $14,573
Here: $14,573 State: $62,719
Total population: 292 (All urban)
Houses: 166 (166 occupied: 101 owner occupied, 66 renter occupied)
| % of renters here: | 40% |
| State: | 33% |
Housing density: 1,233 houses/condos per square mile
Median price asked for vacant for-sale houses and condos in 2022 in this county: $300,061.
Median contract rent in 2022: $843 (lower quartile is $767, upper quartile is $922)
Median rent asked for vacant for-rent units in 2022: $381
Median gross rent in Lawrenceville, OH in 2022: $984
Housing units in Lawrenceville with a mortgage: 48 (8 second mortgage, 0 home equity loan, 8 both second mortgage and home equity loan)
Houses without a mortgage: 0


Latest news about housing in Lawrenceville, OH collected exclusively by city-data.com from local newspapers, TV, and radio stations

 | Is Columbus the best city in the Midwest? (709 replies) |
| Please Tell Me About Youngstown (98 replies) |
| Day-Trip Ideas? (8 replies) |
| Mt. Auburn or OTR (68 replies) |
| Where does Cleveland go from here? (34 replies) |
| Is Cleveland making a comeback? (69 replies) |

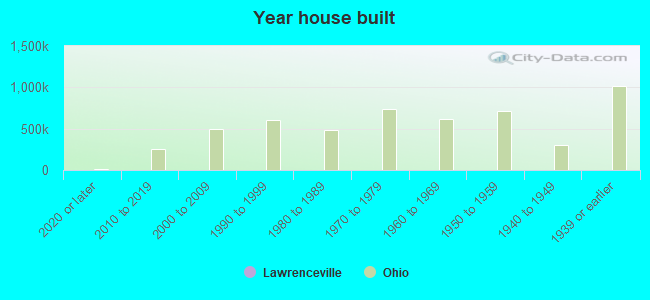
Median year apartment built: 1941
Household type by relationship:
Households: 412- Male householders: 100 (8 living alone), Female householders: 64 (27 living alone)
54 spouses (54 opposite-sex spouses), 50 unmarried partners, (50 opposite-sex unmarried partners), 65 children (65 natural, 0 adopted, 0 stepchildren), 53 grandchildren, 0 brothers or sisters, 9 parents, 0 foster children, 13 other relatives, 0 non-relatives
Size of family households: 43 2-persons, 21 3-persons, 11 5-persons, 8 7-or-more-persons.
Size of nonfamily households: 40 1-person, 51 2-persons.
20 married couples with children.
22 single-parent households (0 men, 22 women).
99.7% of residents of Lawrenceville speak English at home.
| Here: | 5.9 |
| State: | 6.7 |
| Here: | 4.7 |
| State: | 4.4 |
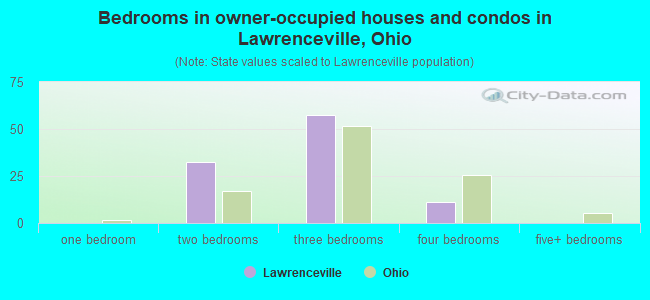
- Bedrooms in owner-occupied houses and condos in Lawrenceville, Ohio
- 0no bedroom
- 01 bedroom
- 322 bedrooms
- 583 bedrooms
- 114 bedrooms
- 05+ bedrooms
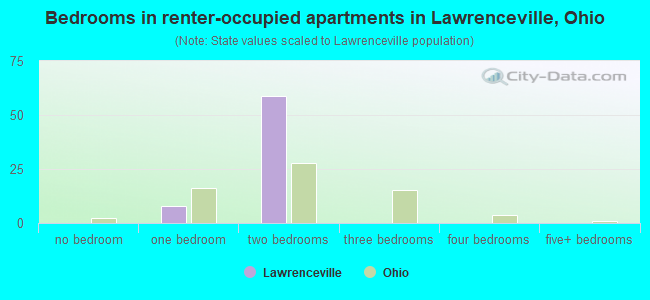
- Bedrooms in renter-occupied apartments in Lawrenceville, Ohio
- 0no bedroom
- 81 bedroom
- 592 bedrooms
- 03 bedrooms
- 04 bedrooms
- 05+ bedrooms
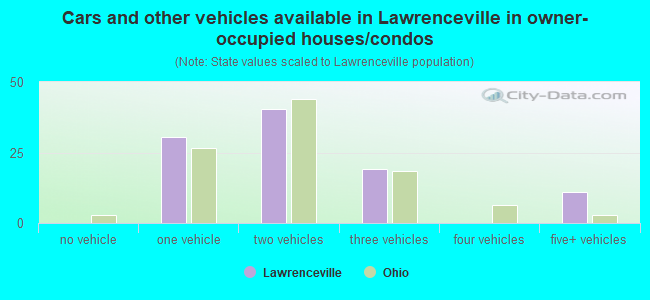
- Cars and other vehicles available in Lawrenceville in owner-occupied houses/condos
- 0no vehicle
- 301 vehicle
- 402 vehicles
- 193 vehicles
- 04 vehicles
- 115+ vehicles
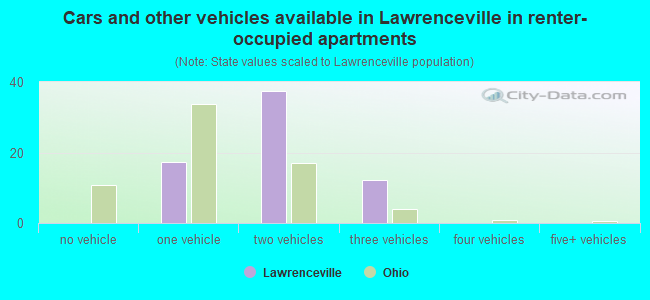
- Cars and other vehicles available in Lawrenceville in renter-occupied apartments
- 0no vehicle
- 171 vehicle
- 372 vehicles
- 123 vehicles
- 04 vehicles
- 05+ vehicles
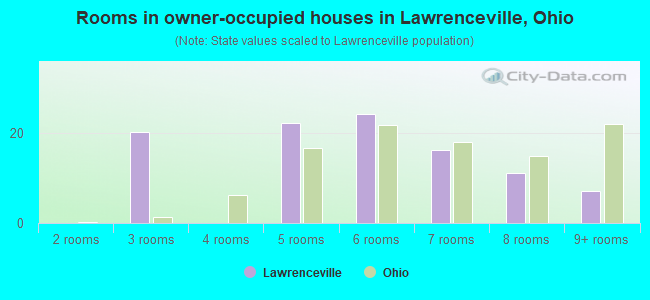
- Rooms in owner-occupied houses in Lawrenceville, Ohio
- 01 room
- 02 rooms
- 203 rooms
- 04 rooms
- 225 rooms
- 246 rooms
- 167 rooms
- 118 rooms
- 79+ rooms
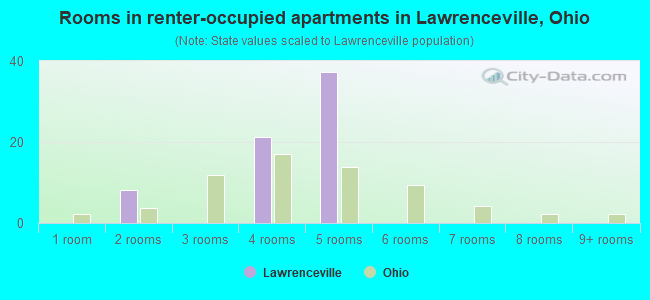
- Rooms in renter-occupied apartments in Lawrenceville, Ohio
- 01 room
- 82 rooms
- 03 rooms
- 214 rooms
- 375 rooms
- 06 rooms
- 07 rooms
- 08 rooms
- 09+ rooms
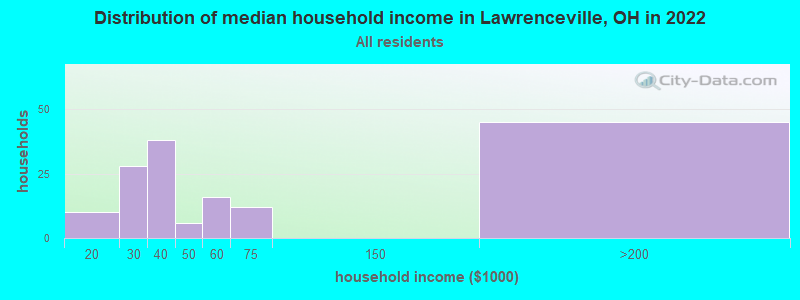
Lawrenceville, OH household income distribution

- 10$10,000 to $19,999
- 28$20,000 to $29,999
- 38$30,000 to $39,999
- 6$40,000 to $49,999
- 16$50,000 to $59,999
- 12$60,000 to $74,999
- 45$150,000 to $199,999
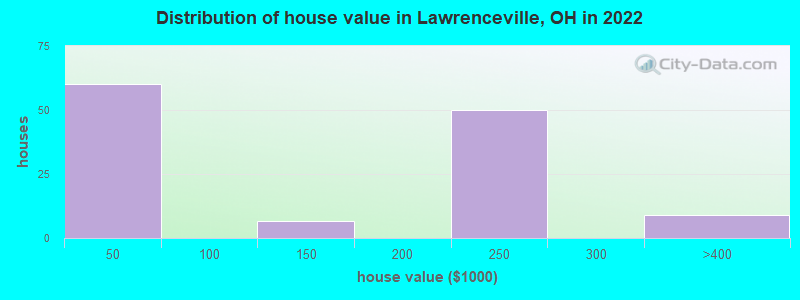
Home value of owner - occupied houses in 2022 in Lawrenceville, OH
-
- 12Less than $10,000
- 13$10,000 to $14,999
- 26$15,000 to $19,999
- 8$25,000 to $29,999
- 6$100,000 to $124,999
- 50$200,000 to $249,999
- 8$300,000 to $399,999
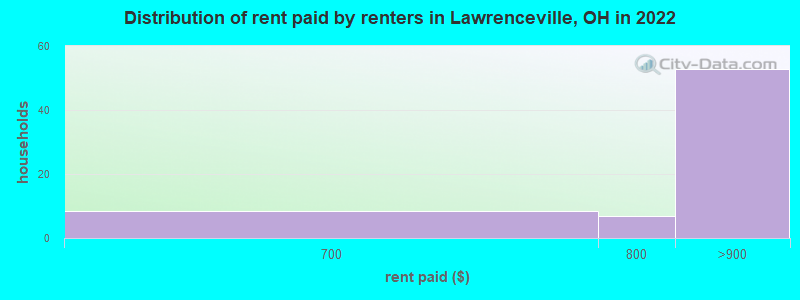
Rent paid by renters in 2022 in Lawrenceville, OH
-
- 8$650 to $699
- 7$700 to $749
- 52$800 to $899
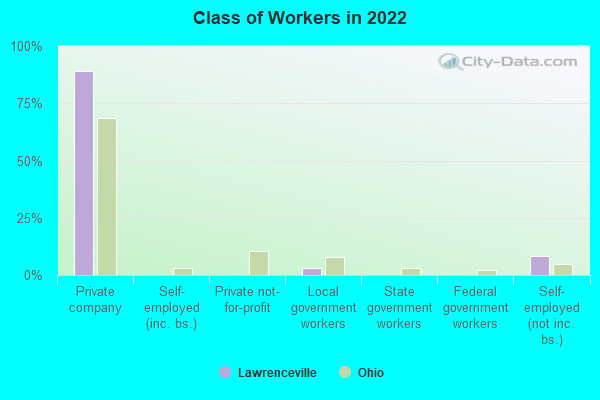
Percentage of workers working in this county: 60.1%
Number of people working at home: 0 (0.0% of all workers)
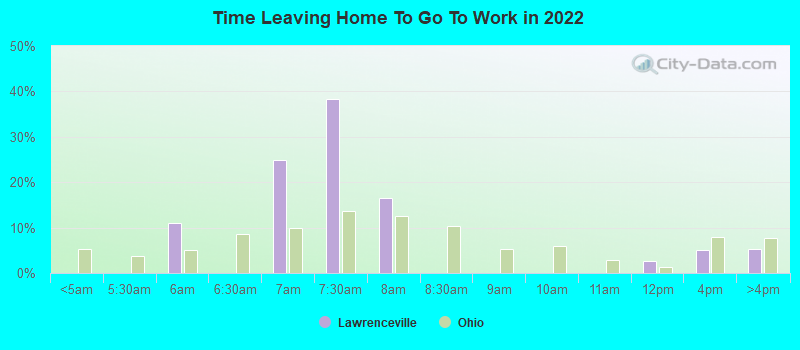
Travel time to work (commute)
- Less than 5 minutes: 32
- 5 to 9 minutes: 0
- 10 to 14 minutes: 29
- 15 to 19 minutes: 5
- 20 to 24 minutes: 55
- 25 to 29 minutes: 30
- 30 to 34 minutes: 34
- 35 to 39 minutes: 0
- 40 to 44 minutes: 0
- 45 to 59 minutes: 11
- 60 to 89 minutes: 27
- 90 or more minutes: 0
Means of transportation to work:
- Drove a car alone: 141 (91.6%)
- Carpooled: 6 (3.9%)
- Walked: 2 (1.3%)
- Worked at home: 5 (3.2%)
- Unemployment by race in 2022
- Unemployment rate for two or more race residents
- 100.0%Females
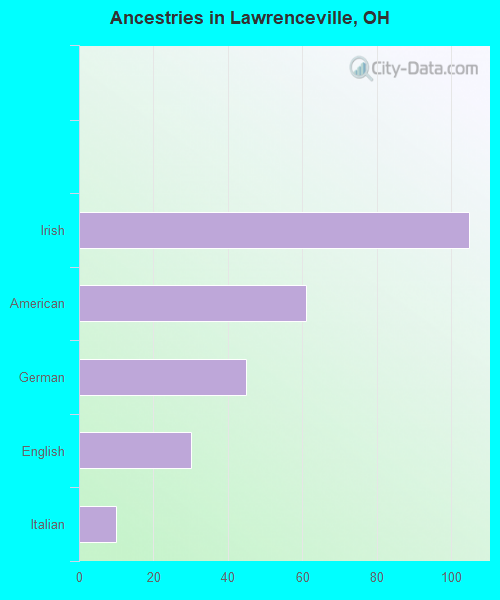
First ancestries reported:
- Irish: 105 (34.6%)
- American: 61 (20.1%)
- German: 45 (14.8%)
- English: 30 (9.9%)
- Italian: 10 (3.3%)
Place of birth for U.S.-born residents:
- This state: 376
- Other state: 30
- Northeast: 0
- Midwest: 19
- South: 11
- West: 0
82.5% of Lawrenceville residents lived in the same house 1 years ago.
Out of people who lived in different houses, 44.0% lived in this county.
| Lawrenceville: | 82.5% |
| State average: | 87.8% |
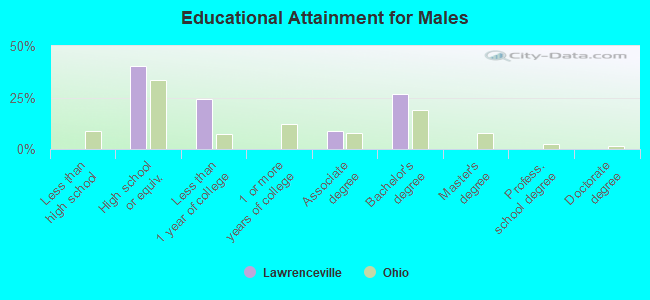
Education attainment for males 25 years and older:
- No schooling: 0
- Nursery to 4th grade: 0
- 5th and 6th grade: 0
- 7th and 8th grade: 0
- 9th grade: 0
- 10th grade: 0
- 11th grade: 0
- 12th grade, no diploma: 0
- High school graduate (or equivalency): 38
- Less than 1 year of college: 23
- Some college more than 1 year, no degree: 0
- Associate degree: 8
- Bachelor's degree: 25
- Master's degree: 0
- Professional school degree: 0
- Doctorate degree: 0
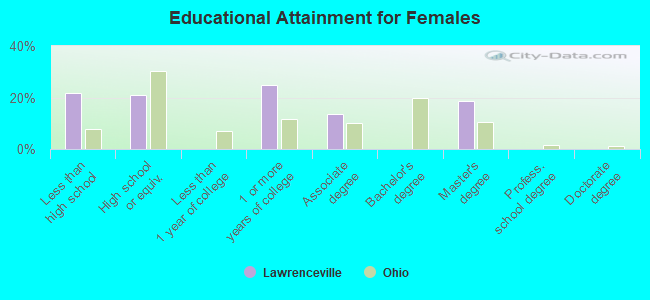
Education attainment for females 25 years and older:
- No schooling: 0
- Nursery to 4th grade: 0
- 5th and 6th grade: 0
- 7th and 8th grade: 0
- 9th grade: 0
- 10th grade: 8
- 11th grade: 19
- 12th grade, no diploma: 0
- High school graduate (or equivalency): 26
- Less than 1 year of college: 0
- Some college more than 1 year, no degree: 31
- Associate degree: 17
- Bachelor's degree: 0
- Master's degree: 23
- Professional school degree: 0
- Doctorate degree: 0


Housing units in structures:
- One, detached: 50
- One, attached: 57
- Two: 9
- Mobile homes: 50
Median worth of mobile homes: $17,490
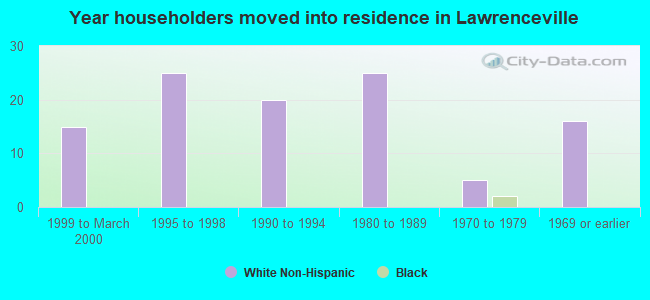
House/condo owner moved in on average 6 years ago
Renter moved in on average 0 years ago
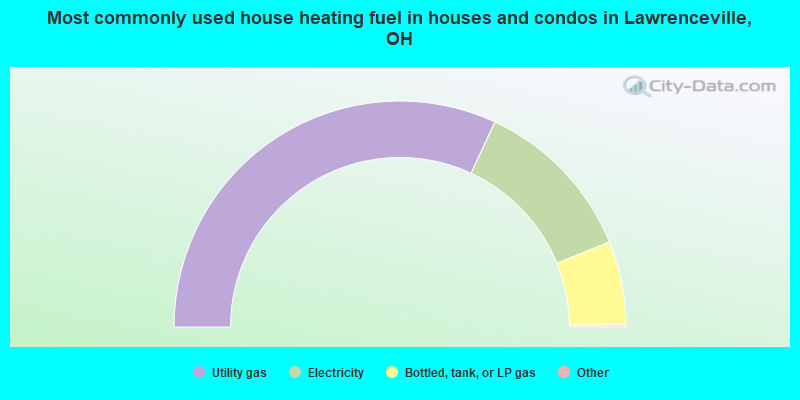
- 64.0%Utility gas
- 24.0%Electricity
- 12.0%Bottled, tank, or LP gas
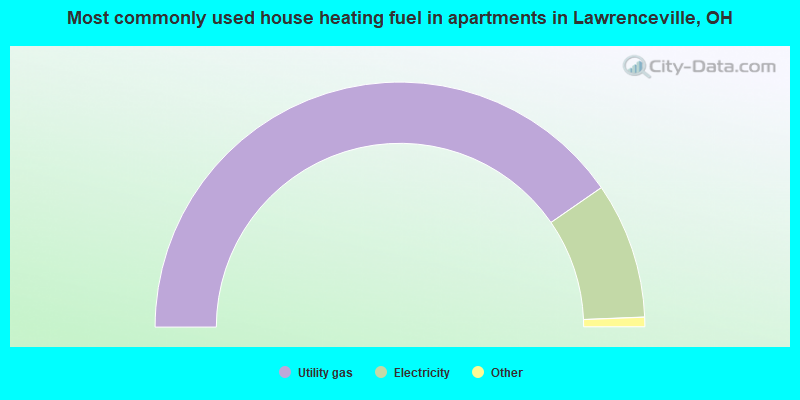
- 81.8%Utility gas
- 18.2%Electricity
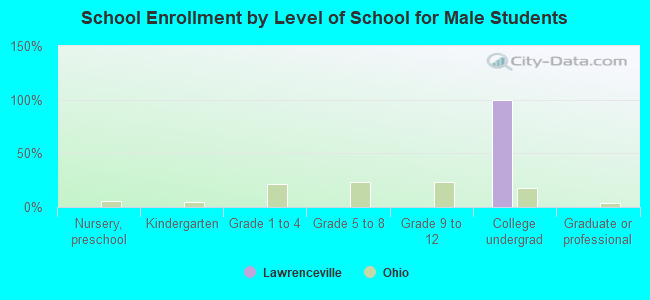
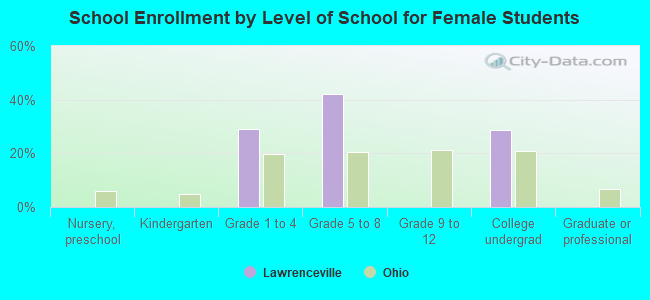
Private vs. public school enrollment:
| Here: | 0.0% |
| Ohio: | 16.0% |
| Here: | 0.0% |
| Ohio: | 22.3% |