Lawton, OK (Oklahoma) Houses and Residents
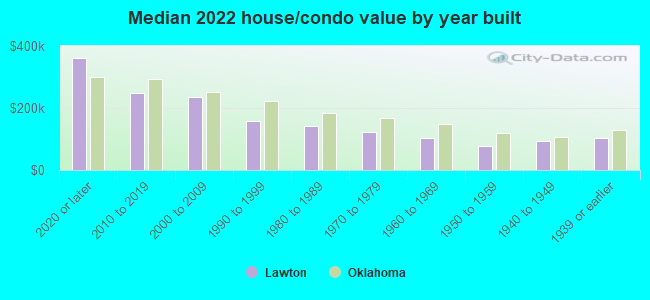
| Lawton: | $121,100 |
| Oklahoma: | $191,700 |
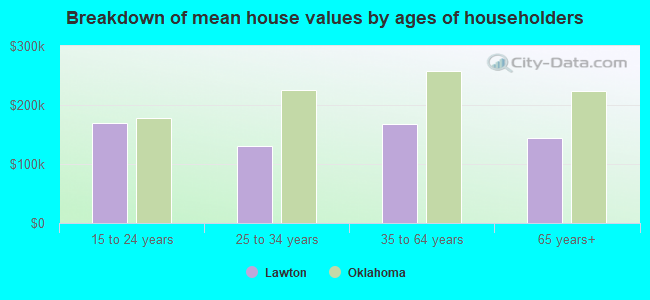
Mean price in 2022:
Detached houses: $197,556
Here: $197,556 State: $255,409 Townhouses or other attached units: $196,638
Here: $196,638 State: $206,466 In 2-unit structures: $134,597
Here: $134,597 State: $195,100 In 3-to-4-unit structures: $102,232
Here: $102,232 State: $140,612 Mobile homes: $84,653
Here: $84,653 State: $110,804 Occupied boats, RVs, vans, etc.: $13,399
Here: $13,399 State: $68,690
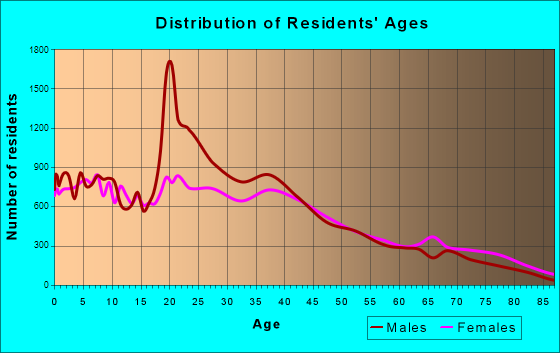
Total population: 97,017 (Urban population: 89,707, Rural population: 3,323 (41 farm, 3,282 nonfarm))
Houses: 40,388 (34,625 occupied: 16,082 owner occupied, 18,543 renter occupied)
| % of renters here: | 54% |
| State: | 35% |
Housing density: 538 houses/condos per square mile
Median price asked for vacant for-sale houses and condos in 2022: $66,624.
Median contract rent in 2022: $711 (lower quartile is $554, upper quartile is $892)
Median rent asked for vacant for-rent units in 2022: $934
Median gross rent in Lawton, OK in 2022: $918
Housing units in Lawton with a mortgage: 9,654 (386 second mortgage, 32 home equity loan, 247 both second mortgage and home equity loan)
Houses without a mortgage: 244
Median household income for houses/condos with a mortgage: $75,090
Median household income for apartments without a mortgage: $50,151
Median monthly housing costs: $890
Compare current foreclosures in Lawton, OK:
| Photo | Address | Area | Beds / Baths | Price | Details |
|---|---|---|---|---|---|

|
#1
SW Washington Ave
Lawton, OK 73505
|
850 sq. feet
|
1 baths 3 beds |
$22,500
|
show details |

|
#2
NW 33rd St
Lawton, OK 73505
|
1,274 sq. feet
|
2 baths 4 beds |
$153,900
|
show details |

|
#3
NW Prentice Ave
Lawton, OK 73507
|
1,050 sq. feet
|
1 baths 3 beds |
$52,500
|
show details |

|
#4
SW 7th St
Lawton, OK 73501
|
1,448 sq. feet
|
2 baths 3 beds |
$95,500
|
show details |

|
#5
NW Glendale Dr
Lawton, OK 73507
|
1,624 sq. feet
|
2 baths 3 beds |
$23,900
|
show details |

|
#6
SW 13th St
Lawton, OK 73501
|
1,066 sq. feet
|
1 baths 3 beds |
$4,275
|
show details |

|
#7
NW 38th St
Lawton, OK 73505
|
1,771 sq. feet
|
2 baths 3 beds |
$17,900
|
show details |

|
#8
SW Oak Cliff Ave
Lawton, OK 73505
|
1,084 sq. feet
|
2 baths 3 beds |
show details | |

|
#9
NW Woodland Dr
Lawton, OK 73505
|
1,050 sq. feet
|
2 baths 3 beds |
show details | |

|
#10
SW Wendy Dr
Lawton, OK 73505
|
1,936 sq. feet
|
2 baths 4 beds |
show details |
| Photo | Address | Area | Beds / Baths | Price | Details |
|---|---|---|---|---|---|

|
#11
NE Highlander Cir
Lawton, OK 73507
|
1,699 sq. feet
|
2 baths 3 beds |
show details | |

|
#12
NW Dearborn Ave
Lawton, OK 73505
|
1,122 sq. feet
|
1 baths 3 beds |
show details | |

|
#13
NW Bell Ave
Lawton, OK 73507
|
977 sq. feet
|
2 baths 3 beds |
show details | |

|
#14
NW Chestnut Ln
Lawton, OK 73505
|
1,752 sq. feet
|
2 baths 4 beds |
show details | |

|
#15
NE Fullerton St
Lawton, OK 73507
|
957 sq. feet
|
1 baths 3 beds |
show details | |

|
#16
NW Euclid Ave
Lawton, OK 73505
|
894 sq. feet
|
1 baths 3 beds |
show details | |

|
#17
SW Wolf Ave
Lawton, OK 73505
|
2,128 sq. feet
|
3 baths 4 beds |
show details | |

|
#18
NE Kingsbriar Dr
Lawton, OK 73507
|
1,837 sq. feet
|
2 baths 3 beds |
show details | |

|
#19
SW Washington Ave
Lawton, OK 73501
|
1,196 sq. feet
|
1 baths 3 beds |
show details | |

|
#20
SW Coral Ave
Lawton, OK 73505
|
1,788 sq. feet
|
2 baths 3 beds |
show details |
| Photo | Address | Area | Beds / Baths | Price | Details |
|---|---|---|---|---|---|

|
#21
NW 22nd St
Lawton, OK 73505
|
1,220 sq. feet
|
1 baths 2 beds |
show details | |

|
#22
NE Carver Ave
Lawton, OK 73507
|
1,052 sq. feet
|
1 baths 2 beds |
show details | |

|
#23
NW 47th St
Lawton, OK 73505
|
2,136 sq. feet
|
2 baths 3 beds |
show details | |

|
#24
SE Hardin Ave
Lawton, OK 73501
|
1,751 sq. feet
|
2 baths 3 beds |
show details | |

|
#25
SE Drexel Dr
Lawton, OK 73501
|
1,224 sq. feet
|
2 baths 3 beds |
show details | |

|
#26
SE Woodlawn Rd
Lawton, OK 73501
|
2,019 sq. feet
|
2 baths 3 beds |
show details | |

|
#27
NW 74th St
Lawton, OK 73505
|
2,848 sq. feet
|
2 baths 4 beds |
show details | |

|
#28
SE Caber Cir
Lawton, OK 73501
|
1,166 sq. feet
|
2 baths 3 beds |
show details | |

|
#29
Thurman Dr
Lawton, OK 73507
|
2,193 sq. feet
|
2 baths 4 beds |
show details | |

|
#30
SW River Bend Rd
Lawton, OK 73505
|
2,119 sq. feet
|
2 baths 3 beds |
show details |
| Photo | Address | Area | Beds / Baths | Price | Details |
|---|---|---|---|---|---|

|
#31
SE Hillcrest Ave
Lawton, OK 73501
|
1,820 sq. feet
|
2 baths 3 beds |
show details | |

|
#32
SW Chaucer Cir
Lawton, OK 73505
|
1,648 sq. feet
|
2 baths 3 beds |
show details | |

|
#33
NW Willow Springs Dr
Lawton, OK 73505
|
1,040 sq. feet
|
2 baths 3 beds |
show details | |

|
#34
NW 36th St
Lawton, OK 73505
|
1,932 sq. feet
|
2 baths 3 beds |
show details | |

|
#35
NW Cherry Ave
Lawton, OK 73507
|
1,011 sq. feet
|
1 baths 2 beds |
show details | |

|
#36
SW K Ave
Lawton, OK 73505
|
1,384 sq. feet
|
1 baths 3 beds |
show details | |

|
#37
Baylee Creek Cir
Lawton, OK 73501
|
2,093 sq. feet
|
2 baths 4 beds |
show details | |

|
#38
NW 46th St
Lawton, OK 73505
|
1,377 sq. feet
|
1 baths 3 beds |
show details | |

|
#39
NW Oak Ave
Lawton, OK 73507
|
1,028 sq. feet
|
1 baths 2 beds |
show details | |

|
#40
NW Cheyenne Cir
Lawton, OK 73505
|
1,345 sq. feet
|
2 baths 3 beds |
show details |
| Photo | Address | Area | Beds / Baths | Price | Details |
|---|---|---|---|---|---|

|
#41
NE Babbit St
Lawton, OK 73507
|
1,140 sq. feet
|
1 baths 3 beds |
show details | |

|
#42
NW Parkwood Pl
Lawton, OK 73505
|
1,796 sq. feet
|
2 baths 3 beds |
show details | |

|
#43
SE Glasgow Ave
Lawton, OK 73501
|
1,333 sq. feet
|
2 baths 3 beds |
show details | |

|
#44
SE Sullivan Dr
Lawton, OK 73501
|
1,514 sq. feet
|
1 baths 3 beds |
show details | |

|
#45
NE Winfield Cir
Lawton, OK 73507
|
1,718 sq. feet
|
2 baths 3 beds |
show details | |

|
#46
NW Cherry Ave
Lawton, OK 73505
|
1,025 sq. feet
|
1 baths 3 beds |
show details | |

|
#47
NW 13th St
Lawton, OK 73507
|
1,284 sq. feet
|
2 baths 4 beds |
show details | |

|
#48
NW Ash Ave
Lawton, OK 73505
|
1,528 sq. feet
|
1 baths 3 beds |
show details | |

|
#49
NW 49th St
Lawton, OK 73505
|
1,673 sq. feet
|
2 baths 3 beds |
show details | |

|
Check over 1 million property listings on Foreclosure.com!
|
browse all offers | |||

Latest news about housing in Lawton, OK collected exclusively by city-data.com from local newspapers, TV, and radio stations

 | Good family steakhouse in Lawton? (8 replies) |
| Oklahoma and Indiana Apartments Skimp on Amenities (11 replies) |
| Selling Home (Eastlake) in Lawton, OK (0 replies) |
| Best areas to look for homes in or around Lawton (3 replies) |
| So where's the cheap houses? (16 replies) |
| 2019: A Depressing Lawton, Oklahoma Story (52 replies) |
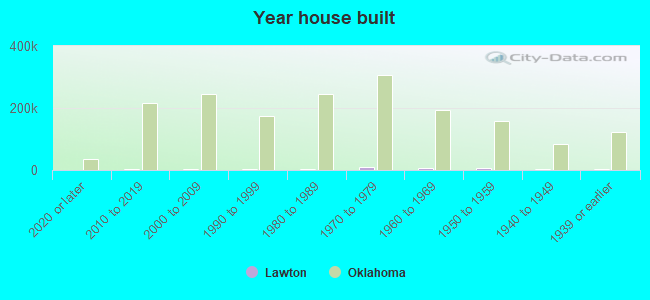
Median year apartment built: 1975
Household type by relationship:
Households: 91,553- Male householders: 17,601 (6,867 living alone), Female householders: 17,024 (4,924 living alone)
12,975 spouses (12,705 opposite-sex spouses), 3,082 unmarried partners, (2,896 opposite-sex unmarried partners), 23,473 children (22,053 natural, 437 adopted, 983 stepchildren), 3,388 grandchildren, 928 brothers or sisters, 634 parents, 56 foster children, 681 other relatives, 2,865 non-relatives
- In group quarters: 8,846
Size of family households: 8,959 2-persons, 4,961 3-persons, 3,995 4-persons, 1,423 5-persons, 342 6-persons, 314 7-or-more-persons.
Size of nonfamily households: 11,791 1-person, 2,263 2-persons, 446 3-persons, 65 4-persons, 66 5-persons.
10,545 married couples with children.
6,610 single-parent households (1,907 men, 4,703 women).
87.6% of residents of Lawton speak English at home.
6.8% of residents speak Spanish at home (76% speak English very well, 17% speak English well, 5% speak English not well, 2% don't speak English at all).
2.1% of residents speak other Indo-European language at home (69% speak English very well, 19% speak English well, 11% speak English not well, 1% don't speak English at all).
2.4% of residents speak Asian or Pacific Island language at home (48% speak English very well, 32% speak English well, 11% speak English not well, 9% don't speak English at all).
0.9% of residents speak other language at home (77% speak English very well, 23% speak English well).
Foreign born population: 4,365 (4.8%)
(63.8% of them are naturalized citizens)
| Here: | 5.9 |
| State: | 6.1 |
| Here: | 4.8 |
| State: | 4.5 |
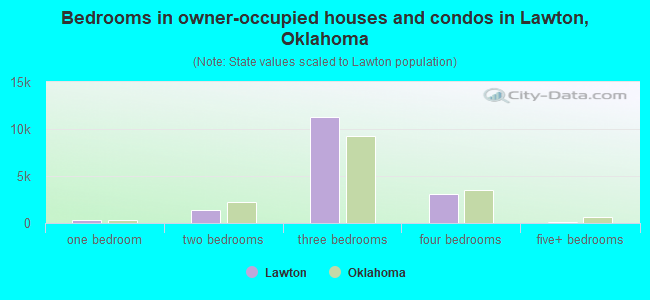
- Bedrooms in owner-occupied houses and condos in Lawton, Oklahoma
- 0no bedroom
- 3191 bedroom
- 1,3512 bedrooms
- 11,2353 bedrooms
- 3,0974 bedrooms
- 805+ bedrooms
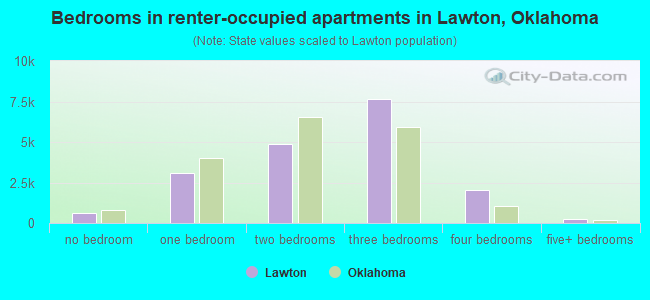
- Bedrooms in renter-occupied apartments in Lawton, Oklahoma
- 636no bedroom
- 3,0781 bedroom
- 4,8992 bedrooms
- 7,6613 bedrooms
- 2,0384 bedrooms
- 2315+ bedrooms
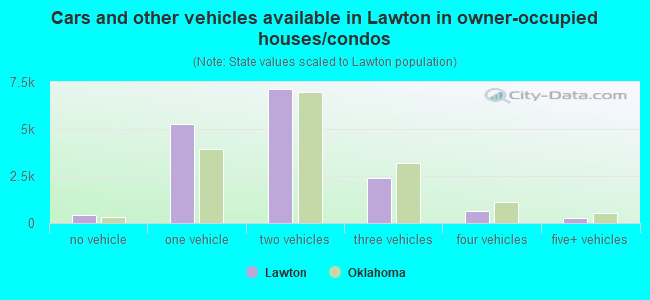
- Cars and other vehicles available in Lawton in owner-occupied houses/condos
- 414no vehicle
- 5,2541 vehicle
- 7,1322 vehicles
- 2,3803 vehicles
- 6594 vehicles
- 2435+ vehicles
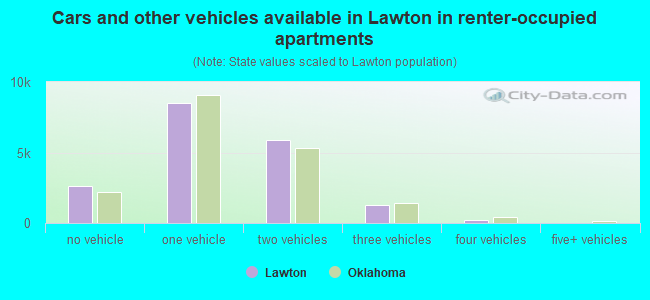
- Cars and other vehicles available in Lawton in renter-occupied apartments
- 2,642no vehicle
- 8,5001 vehicle
- 5,9022 vehicles
- 1,3033 vehicles
- 1964 vehicles
- 05+ vehicles
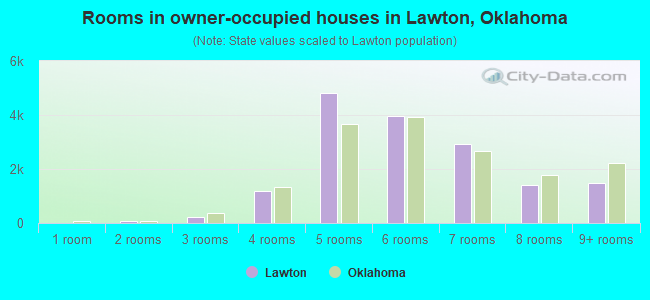
- Rooms in owner-occupied houses in Lawton, Oklahoma
- 01 room
- 682 rooms
- 2173 rooms
- 1,1934 rooms
- 4,8065 rooms
- 3,9796 rooms
- 2,9237 rooms
- 1,4008 rooms
- 1,4969+ rooms
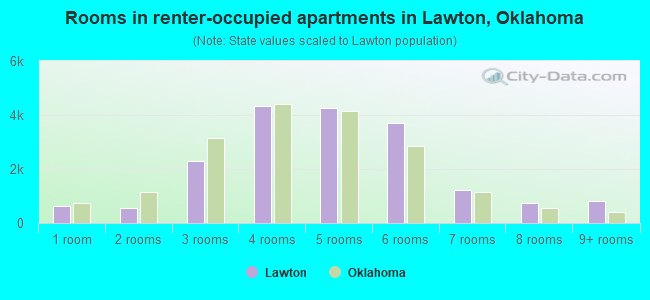
- Rooms in renter-occupied apartments in Lawton, Oklahoma
- 6361 room
- 5422 rooms
- 2,2893 rooms
- 4,3484 rooms
- 4,2495 rooms
- 3,6916 rooms
- 1,2087 rooms
- 7498 rooms
- 8319+ rooms
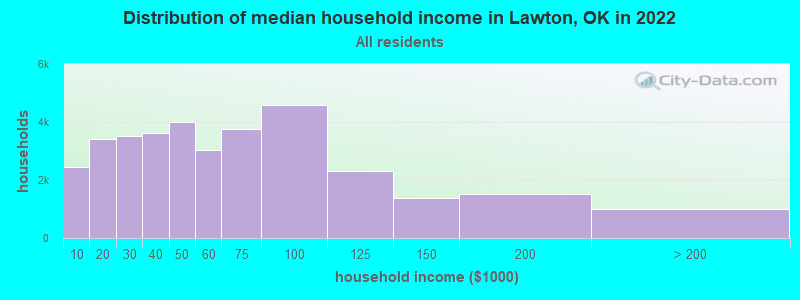
Lawton, OK household income distribution

- 2,437Less than $10,000
- 3,427$10,000 to $19,999
- 3,519$20,000 to $29,999
- 3,633$30,000 to $39,999
- 4,009$40,000 to $49,999
- 3,037$50,000 to $59,999
- 3,773$60,000 to $74,999
- 4,574$75,000 to $99,999
- 2,299$100,000 to $124,999
- 1,392$125,000 to $149,999
- 1,531$150,000 to $199,999
- 994$200,000 or more
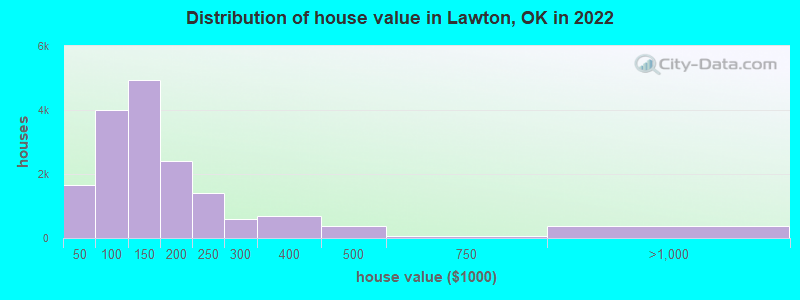
Home value of owner - occupied houses in 2022 in Lawton, OK
-
- 55Less than $10,000
- 429$10,000 to $14,999
- 58$15,000 to $19,999
- 281$20,000 to $24,999
- 280$25,000 to $29,999
- 74$30,000 to $34,999
- 112$35,000 to $39,999
- 355$40,000 to $49,999
- 284$50,000 to $59,999
- 648$60,000 to $69,999
- 976$70,000 to $79,999
- 625$80,000 to $89,999
- 1,122$90,000 to $99,999
- 3,252$100,000 to $124,999
- 1,672$125,000 to $149,999
- 1,749$150,000 to $174,999
- 645$175,000 to $199,999
- 1,403$200,000 to $249,999
- 598$250,000 to $299,999
- 680$300,000 to $399,999
- 362$400,000 to $499,999
- 54$500,000 to $749,999
- 316$750,000 to $999,999
- 52$1,000,000 to $1,499,999
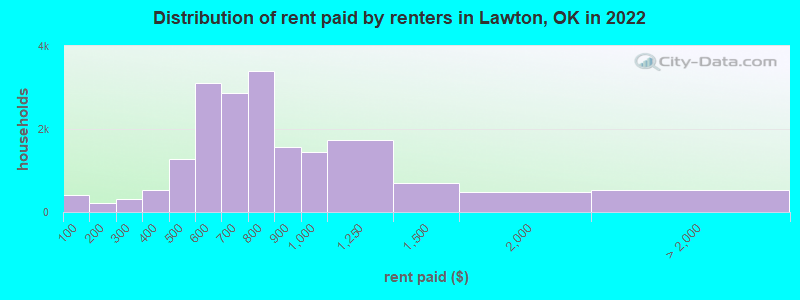
Rent paid by renters in 2022 in Lawton, OK
-
- 406Less than $100
- 74$100 to $149
- 146$150 to $199
- 166$200 to $249
- 148$250 to $299
- 180$300 to $349
- 351$350 to $399
- 366$400 to $449
- 919$450 to $499
- 1,639$500 to $549
- 1,466$550 to $599
- 1,561$600 to $649
- 1,314$650 to $699
- 1,383$700 to $749
- 2,003$750 to $799
- 1,571$800 to $899
- 1,441$900 to $999
- 1,723$1,000 to $1,249
- 687$1,250 to $1,499
- 477$1,500 to $1,999
- 78$2,500 to $2,999
- 444No cash rent
Percentage of workers working in this county: 96.1%
Number of people working at home: 6,843 (16.5% of all workers)
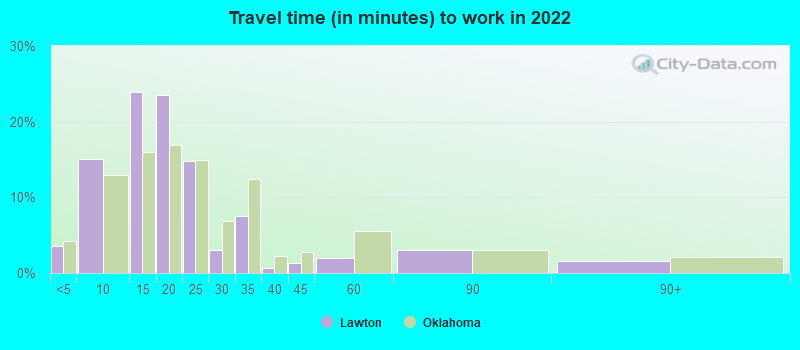
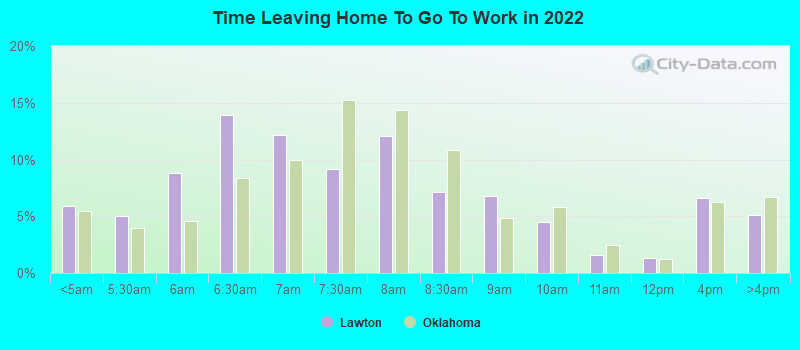
Travel time to work (commute)
- Less than 5 minutes: 1,263
- 5 to 9 minutes: 6,752
- 10 to 14 minutes: 10,429
- 15 to 19 minutes: 9,651
- 20 to 24 minutes: 4,391
- 25 to 29 minutes: 598
- 30 to 34 minutes: 1,995
- 35 to 39 minutes: 207
- 40 to 44 minutes: 562
- 45 to 59 minutes: 275
- 60 to 89 minutes: 526
- 90 or more minutes: 397
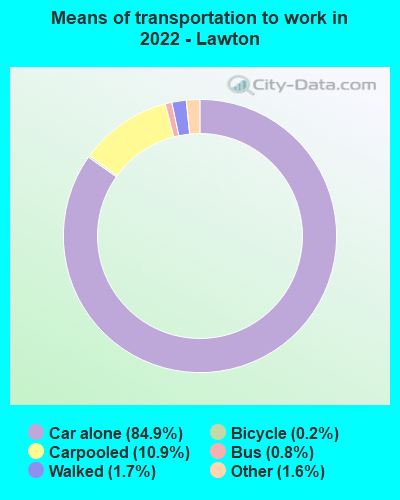
Means of transportation to work:
- Drove a car alone: 39,093 (78.5%)
- Carpooled: 4,071 (8.2%)
- Bus: 284 (0.6%)
- Taxi: 881 (1.8%)
- Bicycle: 96 (0.2%)
- Walked: 510 (1.0%)
- Worked at home: 5,142 (10.3%)
- Unemployment by race in 2022
- Unemployment rate for White non-Hispanic residents
- 3.6%Males
- 5.4%Females
- Unemployment rate for Black residents
- 18.0%Males
- 7.7%Females
- Unemployment rate for American Indian and Alaska Native residents
- 5.9%Males
- 22.6%Females
- Unemployment rate for Asian residents
- 25.7%Males
- 1.9%Females
- Unemployment rate for other race residents
- 6.5%Males
- 9.9%Females
- Unemployment rate for two or more race residents
- 9.0%Males
- 11.8%Females
- Unemployment rate for Hispanic or Latino residents
- 7.6%Males
- 12.6%Females
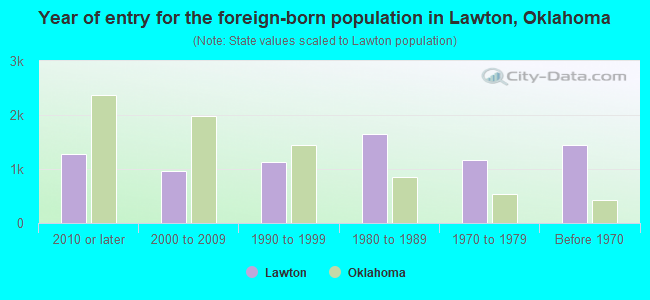
- Year of entry for the foreign-born population in Lawton, Oklahoma
- 1,2752010 or later
- 9622000 to 2009
- 1,1291990 to 1999
- 1,6541980 to 1989
- 1,1611970 to 1979
- 1,441Before 1970
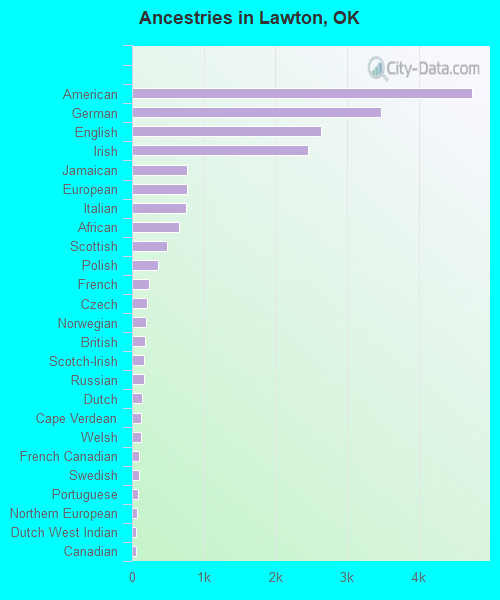
First ancestries reported:
- American: 4,745 (10.2%)
- German: 3,474 (7.5%)
- English: 2,639 (5.7%)
- Irish: 2,453 (5.3%)
- Jamaican: 766 (1.6%)
- European: 761 (1.6%)
- Italian: 749 (1.6%)
- African: 656 (1.4%)
- Scottish: 485 (1.0%)
- Polish: 358 (0.8%)
- French: 237 (0.5%)
- Czech: 214 (0.5%)
- Norwegian: 191 (0.4%)
- British: 180 (0.4%)
- Scotch-Irish: 164 (0.4%)
- Russian: 163 (0.4%)
- Dutch: 134 (0.3%)
- Cape Verdean: 129 (0.3%)
- Welsh: 122 (0.3%)
- French Canadian: 98 (0.2%)
- Swedish: 94 (0.2%)
- Portuguese: 85 (0.2%)
- Northern European: 76 (0.2%)
- Dutch West Indian: 61 (0.1%)
- Canadian: 60 (0.1%)
- Danish: 58 (0.1%)
- Romanian: 50 (0.1%)
- Eastern European: 41 (0.09%)
- Kenyan: 36 (0.08%)
- Ghanaian: 35 (0.08%)
- Hungarian: 31 (0.07%)
- Czechoslovakian: 31 (0.07%)
- South African: 28 (0.06%)
- Cajun: 26 (0.06%)
- Zimbabwean: 25 (0.05%)
- Ukrainian: 25 (0.05%)
- British West Indian: 19 (0.04%)
- Ethiopian: 16 (0.03%)
- Greek: 14 (0.03%)
- Serbian: 14 (0.03%)
- Nigerian: 14 (0.03%)
- Austrian: 14 (0.03%)
- Belgian: 13 (0.03%)
- Australian: 13 (0.03%)
- Swiss: 12 (0.03%)
- Turkish: 12 (0.03%)
- Egyptian: 10 (0.02%)
- German Russian: 9 (0.02%)
- Albanian: 8 (0.02%)
- Scandinavian: 7 (0.02%)
- Slovak: 7 (0.02%)
- Haitian: 7 (0.02%)
- Finnish: 5 (0.01%)
- Lithuanian: 3 (0.01%)
- Lebanese: 3 (0.01%)
Most common places of birth for foreign-born residents (%):
| Lawton: | 16.7% (897) |
| Oklahoma: | 2.3% (5,498) |
| Lawton: | 15.6% (842) |
| Oklahoma: | 42.4% (103,425) |
| Lawton: | 10.4% (561) |
| Oklahoma: | 1.7% (4,140) |
| Lawton: | 8.5% (459) |
| Oklahoma: | 2.3% (5,671) |
| Lawton: | 6.1% (329) |
| Oklahoma: | 5.6% (13,699) |
| Lawton: | 5.7% (307) |
| Oklahoma: | 0.4% (997) |
| Lawton: | 2.4% (129) |
| Oklahoma: | 0.1% (129) |
| Lawton: | 2.1% (115) |
| Oklahoma: | 0.2% (589) |
| Lawton: | 2.0% (106) |
| Oklahoma: | 1.2% (2,959) |
| Lawton: | 1.7% (92) |
| Oklahoma: | 0.3% (633) |
| Lawton: | 1.5% (83) |
| Oklahoma: | 4.1% (10,034) |
Place of birth for U.S.-born residents:
- This state: 35,477
- Other state: 47,504
- Northeast: 3,943
- Midwest: 8,687
- South: 22,709
- West: 12,165
76.8% of Lawton residents lived in the same house 1 years ago.
Out of people who lived in different houses, 31.1% lived in this county.
Out of people who lived in different counties, 25.2% lived in Oklahoma.
| Lawton: | 76.8% |
| State average: | 85.5% |
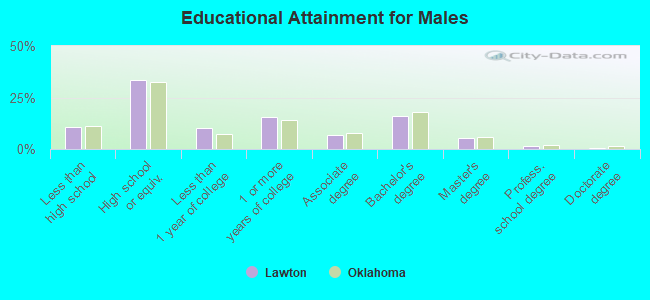
Education attainment for males 25 years and older:
- No schooling: 230
- Nursery to 4th grade: 118
- 5th and 6th grade: 129
- 7th and 8th grade: 307
- 9th grade: 838
- 10th grade: 483
- 11th grade: 445
- 12th grade, no diploma: 677
- High school graduate (or equivalency): 10,108
- Less than 1 year of college: 3,005
- Some college more than 1 year, no degree: 4,739
- Associate degree: 2,090
- Bachelor's degree: 4,814
- Master's degree: 1,541
- Professional school degree: 372
- Doctorate degree: 193
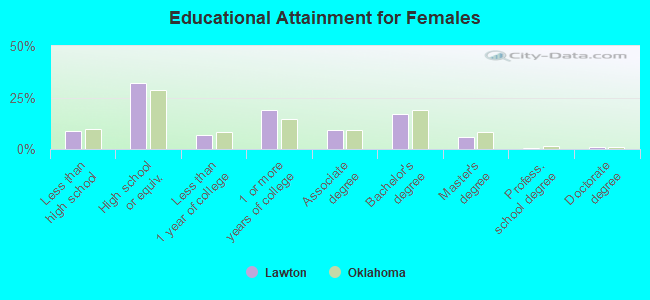
Education attainment for females 25 years and older:
- No schooling: 323
- Nursery to 4th grade: 120
- 5th and 6th grade: 51
- 7th and 8th grade: 187
- 9th grade: 101
- 10th grade: 471
- 11th grade: 769
- 12th grade, no diploma: 510
- High school graduate (or equivalency): 9,092
- Less than 1 year of college: 1,892
- Some college more than 1 year, no degree: 5,402
- Associate degree: 2,568
- Bachelor's degree: 4,757
- Master's degree: 1,668
- Professional school degree: 85
- Doctorate degree: 277
Housing units in structures:
- One, detached: 28,467
- One, attached: 1,392
- Two: 1,259
- 3 or 4: 2,053
- 5 to 9: 2,117
- 10 to 19: 1,214
- 20 to 49: 1,262
- 50 or more: 1,493
- Mobile homes: 1,063
- Boats, RVs, vans, etc.: 68
Median worth of mobile homes: $27,100
Housing units lacking complete kitchen facilities in 2022: 2.8%
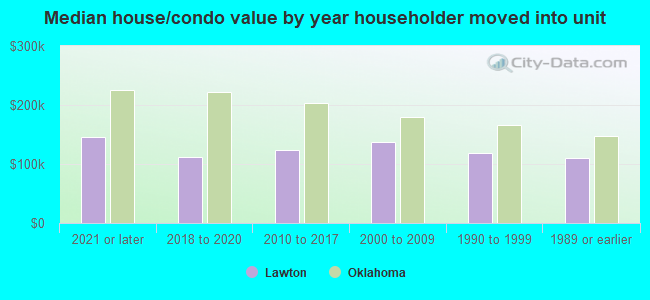
House/condo owner moved in on average 12 years ago
Renter moved in on average 2 years ago
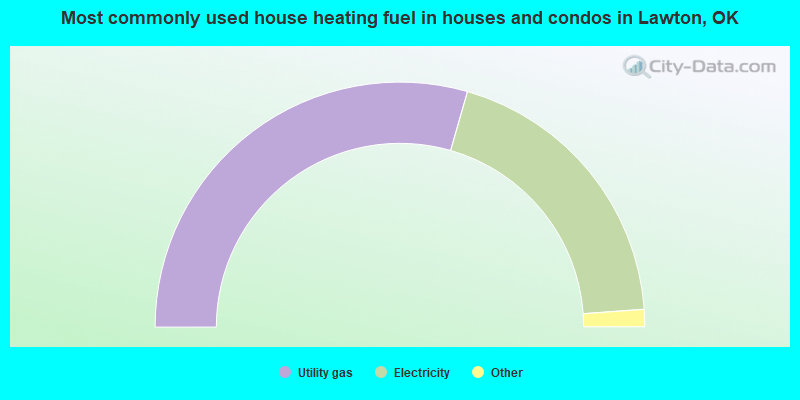
- 58.9%Utility gas
- 38.8%Electricity
- 1.1%Bottled, tank, or LP gas
- 0.6%No fuel used
- 0.5%Other fuel
- 0.1%Wood
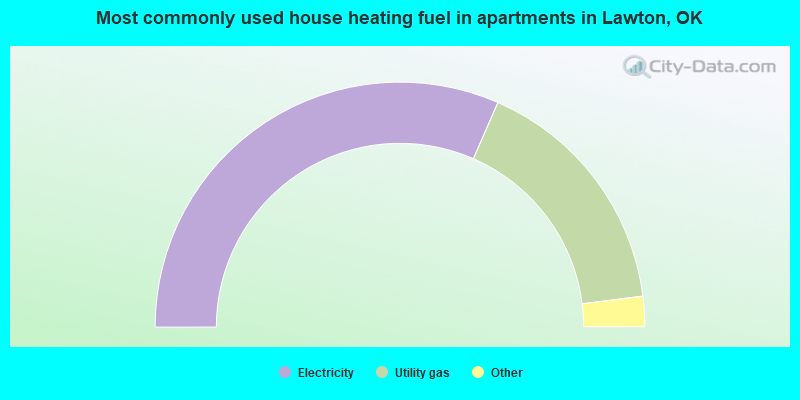
- 63.1%Electricity
- 32.9%Utility gas
- 1.9%Bottled, tank, or LP gas
- 1.1%No fuel used
- 0.8%Wood
- 0.2%Other fuel
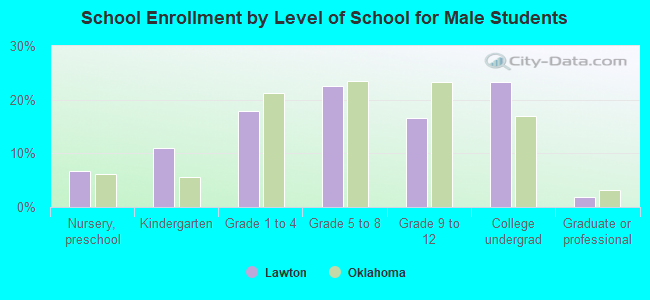
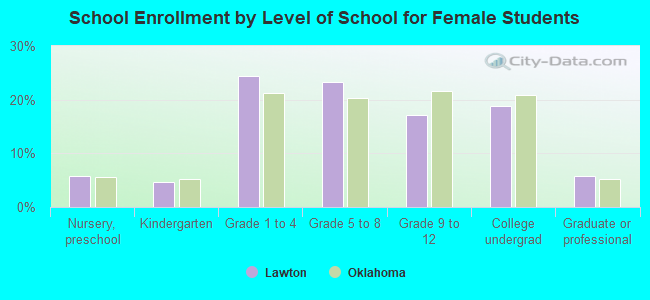
Private vs. public school enrollment:
| Here: | 8.8% |
| Oklahoma: | 11.7% |
| Here: | 5.2% |
| Oklahoma: | 11.7% |
| Here: | 9.3% |
| Oklahoma: | 19.3% |