Linntown, PA (Pennsylvania) Houses and Residents
| Linntown: | $250,384 |
| Pennsylvania: | $245,500 |
Mean price in 2022:
Detached houses: $247,900
Here: $247,900 State: $317,202
Total population: 1,489 (Urban population: 1,483 (all inside urban clusters), Rural population: 0)
Houses: 738 (598 occupied: 431 owner occupied, 172 renter occupied)
| % of renters here: | 29% |
| State: | 31% |
Housing density: 1,038 houses/condos per square mile
Median price asked for vacant for-sale houses and condos in 2022 in this county: $165,459.
Median contract rent in 2022: $1,645 (lower quartile is $1,013, upper quartile is $1,925)
Median rent asked for vacant for-rent units in 2022: $1,340
Median gross rent in Linntown, PA in 2022: over $2,000
Housing units in Linntown with a mortgage: 314 (34 second mortgage, 0 home equity loan, 34 both second mortgage and home equity loan)
Houses without a mortgage: 0
Median household income for houses/condos with a mortgage: $100,980
Median household income for apartments without a mortgage: $122,689
Median monthly housing costs: $1,399
Compare current foreclosures near Linntown, PA:
| Photo | Address | Area | Beds / Baths | Price | Details |
|---|---|---|---|---|---|

|
#1
Market St
Mifflinburg, PA 17844
|
2,582 sq. feet
|
2 baths 3 beds |
$265,500
|
show details |

|
#2
Avenue F
Danville, PA 17821
|
1,600 sq. feet
|
2 baths 3 beds |
$289,500
|
show details |

|
#3
Merand Ln
Mifflinburg, PA 17844
|
1,565 sq. feet
|
2 baths 3 beds |
show details | |

|
#4
8th St
Northumberland, PA 17857
|
1,620 sq. feet
|
1 baths 4 beds |
show details | |

|
#5
Ash St
Watsontown, PA 17777
|
1,536 sq. feet
|
1 baths 4 beds |
show details | |

|
#6
W Library Ave
Danville, PA 17821
|
1,191 sq. feet
|
1 baths 2 beds |
show details | |

|
#7
Route 204
Selinsgrove, PA 17870
|
1,169 sq. feet
|
1 baths 1 beds |
show details | |

|
#8
S 2nd St
Sunbury, PA 17801
|
2,216 sq. feet
|
2 baths 6 beds |
show details | |

|
#9
S State Route 44
Allenwood, PA 17810
|
1,109 sq. feet
|
2 baths 3 beds |
show details | |

|
#10
Old Rd
Montgomery, PA 17752
|
1,960 sq. feet
|
1 baths 3 beds |
show details |
| Photo | Address | Area | Beds / Baths | Price | Details |
|---|---|---|---|---|---|

|
#11
Pennsylvania Ave
Watsontown, PA 17777
|
- sq. feet
|
- baths - beds |
show details | |

|
#12
Aspen St
Mifflinburg, PA 17844
|
- sq. feet
|
- baths - beds |
show details | |

|
#13
Brush Valley Rd
Sunbury, PA 17801
|
- sq. feet
|
- baths - beds |
show details | |

|
#14
Old Turnpike Rd
Millmont, PA 17845
|
- sq. feet
|
- baths - beds |
show details | |

|
#15
Sunbury Rd
Danville, PA 17821
|
- sq. feet
|
- baths - beds |
show details | |

|
#16
Devon Ct
Selinsgrove, PA 17870
|
- sq. feet
|
- baths - beds |
show details | |

|
#17
Kellys Dam Rd # 312
Danville, PA 17821
|
- sq. feet
|
- baths - beds |
show details | |

|
#18
Elm St
Watsontown, PA 17777
|
- sq. feet
|
- baths - beds |
show details | |

|
#19
Scholls Aly
Selinsgrove, PA 17870
|
- sq. feet
|
- baths - beds |
show details | |

|
#20
N Old Trl
Selinsgrove, PA 17870
|
- sq. feet
|
- baths - beds |
show details |
| Photo | Address | Area | Beds / Baths | Price | Details |
|---|---|---|---|---|---|

|
#21
Sunset Dr
Selinsgrove, PA 17870
|
- sq. feet
|
- baths - beds |
show details | |

|
#22
Thomas St
Mifflinburg, PA 17844
|
- sq. feet
|
- baths - beds |
show details | |

|
#23
Mainzer Hill Rd
Danville, PA 17821
|
- sq. feet
|
- baths - beds |
show details | |

|
#24
State Route 61
Sunbury, PA 17801
|
- sq. feet
|
- baths - beds |
show details | |

|
#25
Mccracken Rd
Danville, PA 17821
|
- sq. feet
|
- baths - beds |
show details | |

|
#26
N 3rd St Apt 2
Lewisburg, PA 17837
|
- sq. feet
|
- baths - beds |
show details | |

|
#27
Fisher Ave
Lewisburg, PA 17837
|
- sq. feet
|
- baths - beds |
show details | |

|
#28
N Star Blvd
Milton, PA 17847
|
- sq. feet
|
- baths - beds |
show details | |

|
#29
Old Rd
Montgomery, PA 17752
|
- sq. feet
|
- baths - beds |
show details | |

|
#30
Orange St
Danville, PA 17821
|
- sq. feet
|
- baths - beds |
show details |
| Photo | Address | Area | Beds / Baths | Price | Details |
|---|---|---|---|---|---|

|
#31
Rhoads Hill Rd
Danville, PA 17821
|
- sq. feet
|
- baths - beds |
show details | |

|
#32
Susquehanna Rd
Northumberland, PA 17857
|
- sq. feet
|
- baths - beds |
show details | |

|
#33
Grand St
Danville, PA 17821
|
- sq. feet
|
- baths - beds |
show details | |

|
#34
Twin Oaks Ln
Selinsgrove, PA 17870
|
- sq. feet
|
- baths - beds |
show details | |

|
#35
Back Rd
Allenwood, PA 17810
|
- sq. feet
|
- baths - beds |
show details | |

|
#36
S Market St
Selinsgrove, PA 17870
|
- sq. feet
|
- baths - beds |
show details | |

|
#37
State Route 61
Sunbury, PA 17801
|
- sq. feet
|
- baths - beds |
show details | |

|
#38
N Market St
Selinsgrove, PA 17870
|
- sq. feet
|
- baths - beds |
show details | |

|
#39
Dogwood Dr
Middleburg, PA 17842
|
- sq. feet
|
- baths - beds |
show details | |

|
#40
Verdilla Rd
Port Trevorton, PA 17864
|
- sq. feet
|
- baths - beds |
show details |
| Photo | Address | Area | Beds / Baths | Price | Details |
|---|---|---|---|---|---|

|
#41
Lynnewood Rd
Watsontown, PA 17777
|
- sq. feet
|
- baths - beds |
show details | |

|
#42
Sherwood Dr
Montgomery, PA 17752
|
- sq. feet
|
- baths - beds |
show details | |

|
#43
Grayson View Ct
Selinsgrove, PA 17870
|
- sq. feet
|
- baths - beds |
show details | |

|
#44
Pleasant Dr
Selinsgrove, PA 17870
|
- sq. feet
|
- baths - beds |
show details | |

|
#45
S 8th St
Lewisburg, PA 17837
|
- sq. feet
|
- baths - beds |
show details | |

|
#46
S Hill Dr
Middleburg, PA 17842
|
- sq. feet
|
- baths - beds |
show details | |

|
#47
Us Route 15
Allenwood, PA 17810
|
- sq. feet
|
- baths - beds |
show details | |

|
#48
Green Ridge Rd
Mifflinburg, PA 17844
|
- sq. feet
|
- baths - beds |
show details | |

|
#49
N Front St
Lewisburg, PA 17837
|
- sq. feet
|
- baths - beds |
show details | |

|
Check over 1 million property listings on Foreclosure.com!
|
browse all offers | |||


 | selinsgrove/ snyder county? (45 replies) |
| lewisburg, pa..considering a move from nj (7 replies) |
| Subdivisions in Lewisburg (7 replies) |
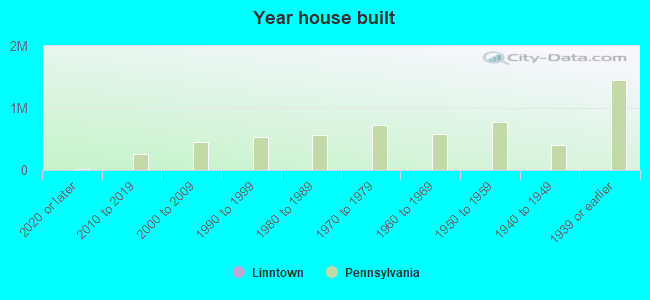
Median year apartment built: 1962
Household type by relationship:
Households: 1,684- Male householders: 309 (33 living alone), Female householders: 281 (35 living alone)
414 spouses (414 opposite-sex spouses), 45 unmarried partners, (7 opposite-sex unmarried partners), 579 children (579 natural, 0 adopted, 0 stepchildren), 0 grandchildren, 0 brothers or sisters, 14 parents, 0 foster children, 38 other relatives, 0 non-relatives
Size of family households: 207 2-persons, 58 3-persons, 128 4-persons, 77 5-persons.
Size of nonfamily households: 72 1-person, 56 2-persons.
404 married couples with children.
31 single-parent households (0 men, 31 women).
90.5% of residents of Linntown speak English at home.
4.9% of residents speak Spanish at home (75% speak English very well, 25% speak English well).
2.9% of residents speak other Indo-European language at home (89% speak English very well, 11% speak English not well).
1.1% of residents speak Asian or Pacific Island language at home (100% speak English very well).
Foreign born population: 69 (4.1%)
(31.9% of them are naturalized citizens)
| Here: | 7.5 |
| State: | 6.8 |
| Here: | 6.6 |
| State: | 4.3 |
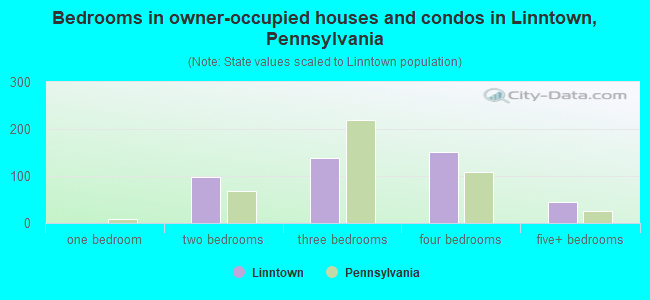
- Bedrooms in owner-occupied houses and condos in Linntown, Pennsylvania
- 0no bedroom
- 01 bedroom
- 982 bedrooms
- 1383 bedrooms
- 1524 bedrooms
- 445+ bedrooms
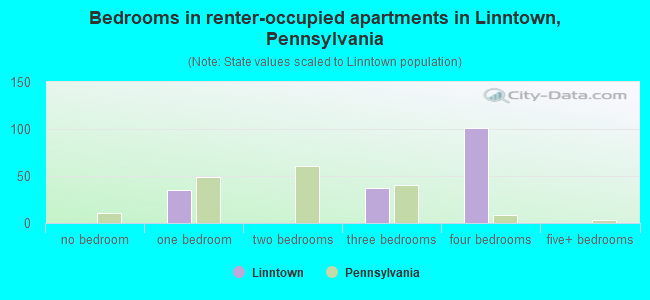
- Bedrooms in renter-occupied apartments in Linntown, Pennsylvania
- 0no bedroom
- 351 bedroom
- 02 bedrooms
- 373 bedrooms
- 1014 bedrooms
- 05+ bedrooms
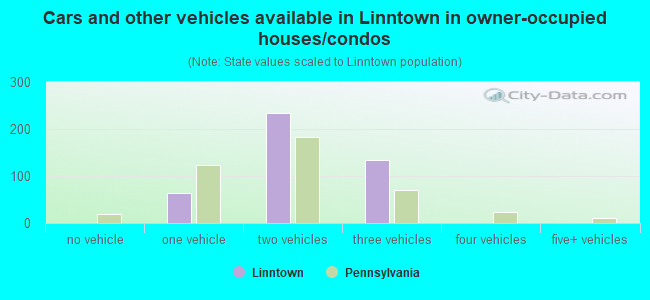
- Cars and other vehicles available in Linntown in owner-occupied houses/condos
- 0no vehicle
- 631 vehicle
- 2332 vehicles
- 1353 vehicles
- 04 vehicles
- 05+ vehicles
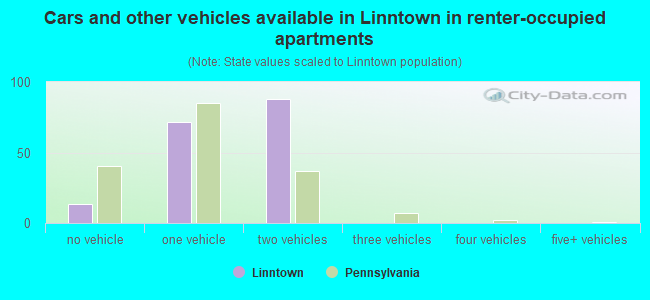
- Cars and other vehicles available in Linntown in renter-occupied apartments
- 13no vehicle
- 711 vehicle
- 882 vehicles
- 03 vehicles
- 04 vehicles
- 05+ vehicles
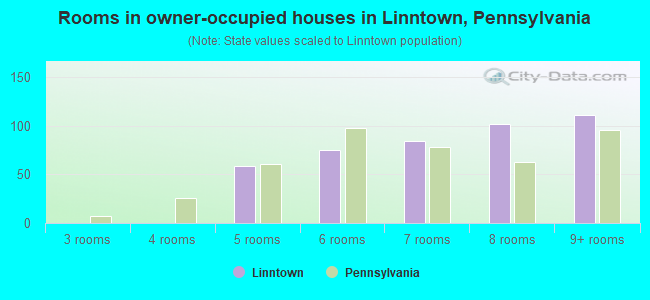
- Rooms in owner-occupied houses in Linntown, Pennsylvania
- 01 room
- 02 rooms
- 03 rooms
- 04 rooms
- 595 rooms
- 756 rooms
- 847 rooms
- 1028 rooms
- 1119+ rooms
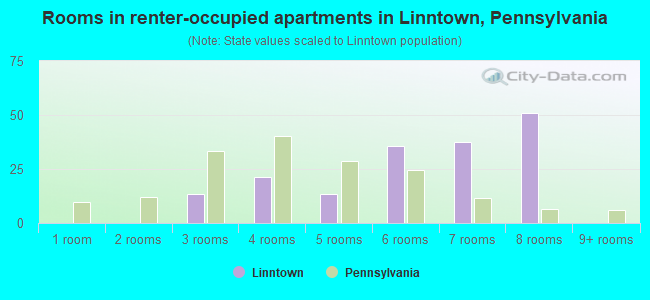
- Rooms in renter-occupied apartments in Linntown, Pennsylvania
- 01 room
- 02 rooms
- 133 rooms
- 214 rooms
- 135 rooms
- 366 rooms
- 387 rooms
- 518 rooms
- 09+ rooms
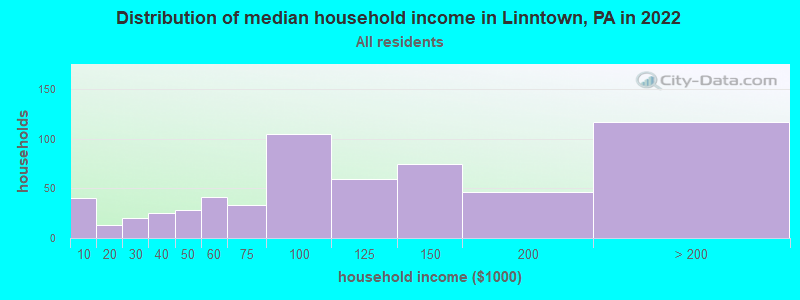
Linntown, PA household income distribution

- 40Less than $10,000
- 13$10,000 to $19,999
- 20$20,000 to $29,999
- 25$30,000 to $39,999
- 28$40,000 to $49,999
- 41$50,000 to $59,999
- 33$60,000 to $74,999
- 105$75,000 to $99,999
- 60$100,000 to $124,999
- 75$125,000 to $149,999
- 46$150,000 to $199,999
- 117$200,000 or more
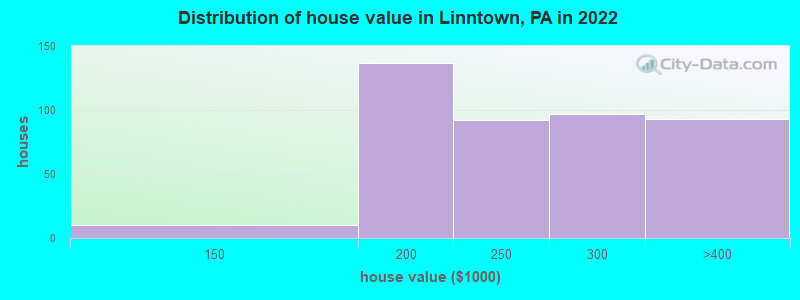
Home value of owner - occupied houses in 2022 in Linntown, PA
-
- 9$100,000 to $124,999
- 86$150,000 to $174,999
- 50$175,000 to $199,999
- 91$200,000 to $249,999
- 96$250,000 to $299,999
- 92$300,000 to $399,999
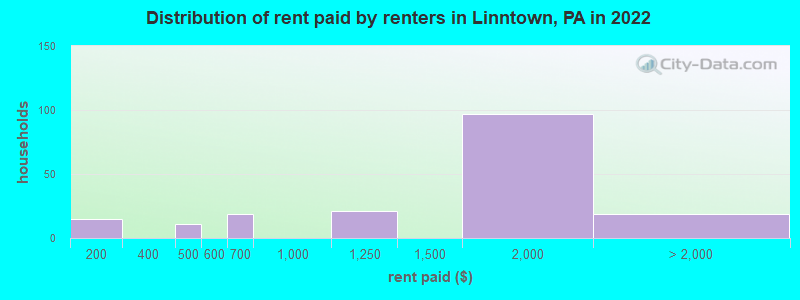
Rent paid by renters in 2022 in Linntown, PA
-
- 15$150 to $199
- 11$450 to $499
- 18$650 to $699
- 21$1,000 to $1,249
- 97$1,500 to $1,999
- 18$3,000 to $3,499
Percentage of workers working in this county: 68.3%
Number of people working at home: 110 (13.0% of all workers)
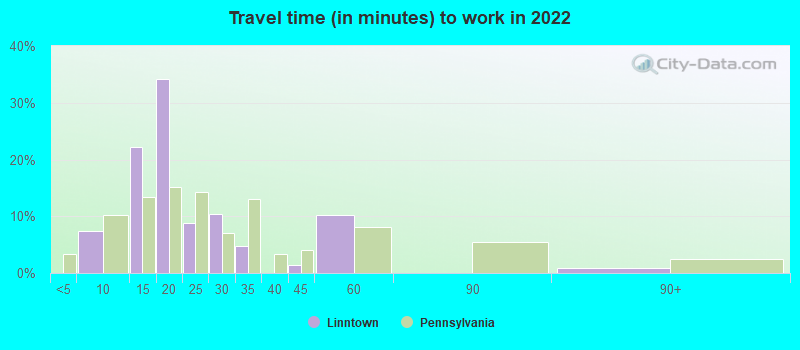
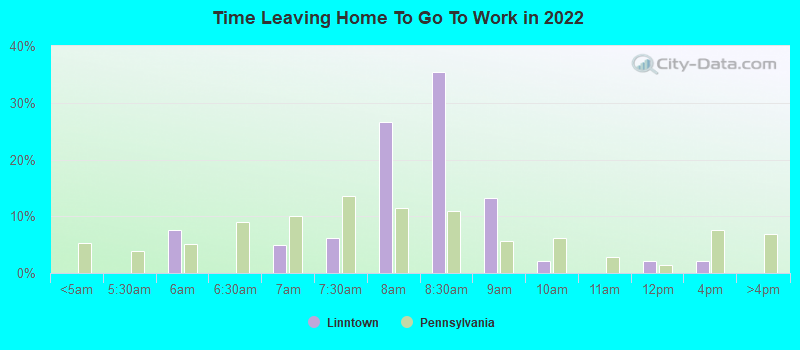
Travel time to work (commute)
- Less than 5 minutes: 0
- 5 to 9 minutes: 260
- 10 to 14 minutes: 66
- 15 to 19 minutes: 109
- 20 to 24 minutes: 119
- 25 to 29 minutes: 75
- 30 to 34 minutes: 91
- 35 to 39 minutes: 14
- 40 to 44 minutes: 0
- 45 to 59 minutes: 0
- 60 to 89 minutes: 4
- 90 or more minutes: 0
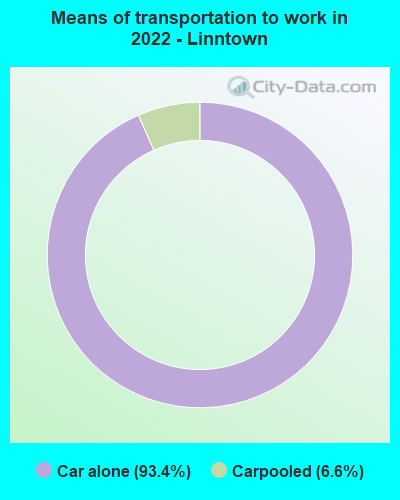
Means of transportation to work:
- Drove a car alone: 430 (76.5%)
- Carpooled: 30 (5.3%)
- Worked at home: 110 (19.6%)
- Unemployment by race in 2022
- Unemployment rate for White non-Hispanic residents
- 11.8%Males
- 2.8%Females
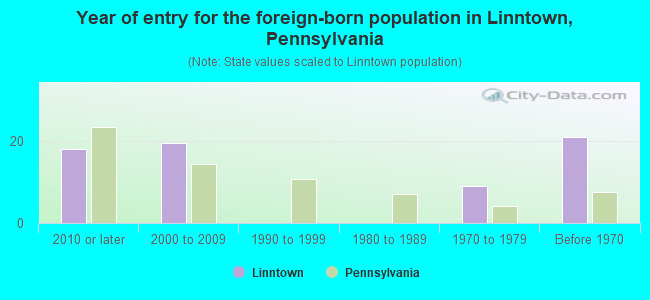
- Year of entry for the foreign-born population in Linntown, Pennsylvania
- 182010 or later
- 202000 to 2009
- 01990 to 1999
- 01980 to 1989
- 91970 to 1979
- 21Before 1970
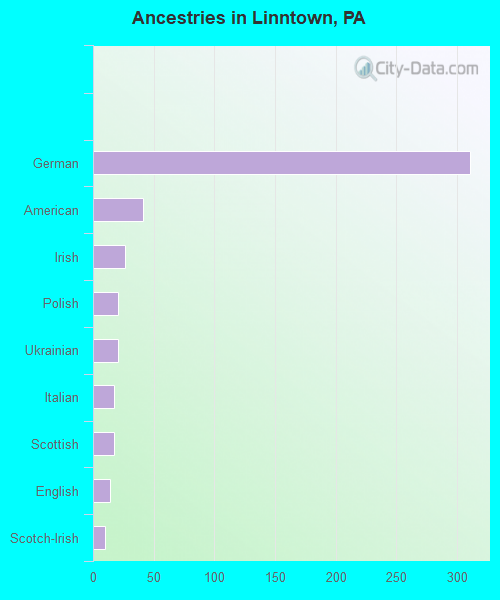
First ancestries reported:
- German: 311 (47.9%)
- American: 41 (6.3%)
- Irish: 26 (4.0%)
- Polish: 21 (3.2%)
- Ukrainian: 21 (3.2%)
- Italian: 17 (2.6%)
- Scottish: 17 (2.6%)
- English: 14 (2.2%)
- Scotch-Irish: 10 (1.5%)
Most common places of birth for foreign-born residents (%):
| Linntown: | 55.1% (38) |
| Pennsylvania: | 10.7% (100,596) |
| Linntown: | 30.4% (21) |
| Pennsylvania: | 2.1% (19,841) |
| Linntown: | 11.6% (8) |
| Pennsylvania: | 0.6% (5,742) |
Place of birth for U.S.-born residents:
- This state: 1,065
- Other state: 473
- Northeast: 157
- Midwest: 102
- South: 170
- West: 42
92.0% of Linntown residents lived in the same house 1 years ago.
Out of people who lived in different houses, 44.4% lived in this county.
Out of people who lived in different counties, 0.0% lived in Pennsylvania.
| Linntown: | 92.0% |
| State average: | 89.3% |
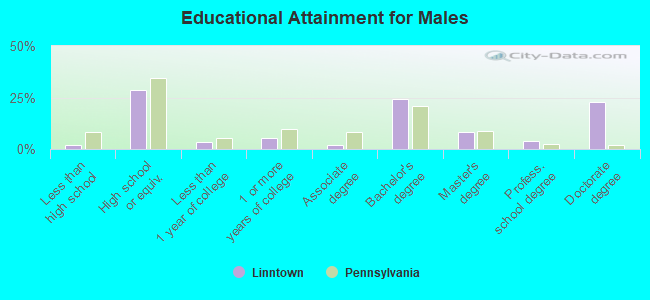
Education attainment for males 25 years and older:
- No schooling: 0
- Nursery to 4th grade: 0
- 5th and 6th grade: 0
- 7th and 8th grade: 11
- 9th grade: 0
- 10th grade: 0
- 11th grade: 0
- 12th grade, no diploma: 0
- High school graduate (or equivalency): 179
- Less than 1 year of college: 21
- Some college more than 1 year, no degree: 32
- Associate degree: 13
- Bachelor's degree: 151
- Master's degree: 50
- Professional school degree: 24
- Doctorate degree: 143
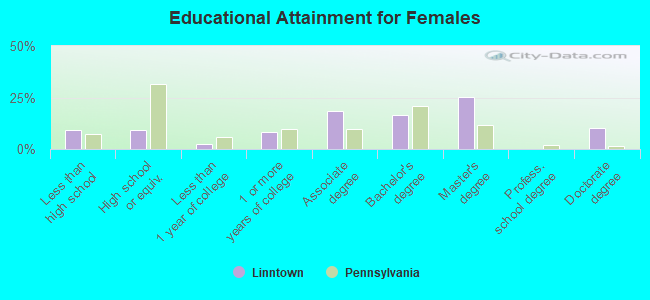
Education attainment for females 25 years and older:
- No schooling: 0
- Nursery to 4th grade: 0
- 5th and 6th grade: 0
- 7th and 8th grade: 0
- 9th grade: 0
- 10th grade: 31
- 11th grade: 11
- 12th grade, no diploma: 10
- High school graduate (or equivalency): 51
- Less than 1 year of college: 13
- Some college more than 1 year, no degree: 46
- Associate degree: 104
- Bachelor's degree: 93
- Master's degree: 142
- Professional school degree: 0
- Doctorate degree: 57
Housing units in structures:
- One, detached: 653
- Two: 15
- 5 to 9: 21
- 10 to 19: 13
- 20 to 49: 13
- Mobile homes: 22
Housing units lacking complete kitchen facilities in 2022: 7.3%
House/condo owner moved in on average 12 years ago
Renter moved in on average 5 years ago
- 38.5%Electricity
- 30.7%Utility gas
- 25.1%Fuel oil, kerosene, etc.
- 3.1%Other fuel
- 2.6%Bottled, tank, or LP gas
- 49.1%Electricity
- 38.5%Fuel oil, kerosene, etc.
- 12.4%Utility gas
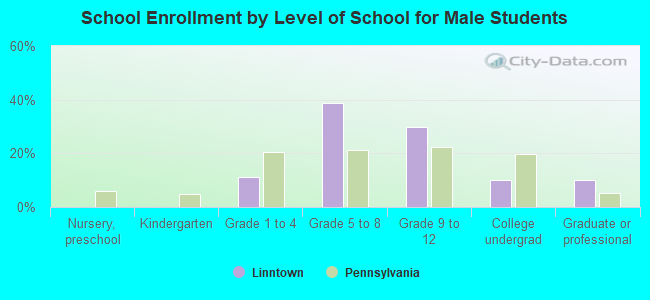
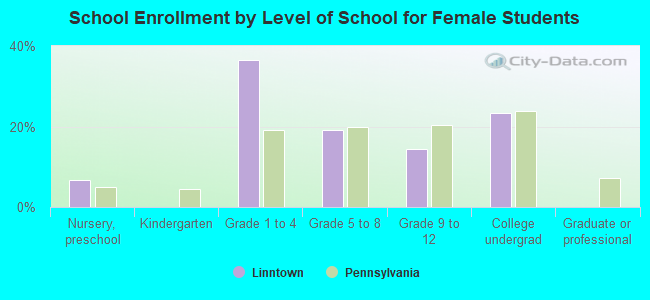
Private vs. public school enrollment:
| Here: | 0.0% |
| Pennsylvania: | 15.7% |
| Here: | 0.0% |
| Pennsylvania: | 13.4% |
| Here: | 50.0% |
| Pennsylvania: | 39.8% |