Littlelot, TN (Tennessee) Houses and Residents
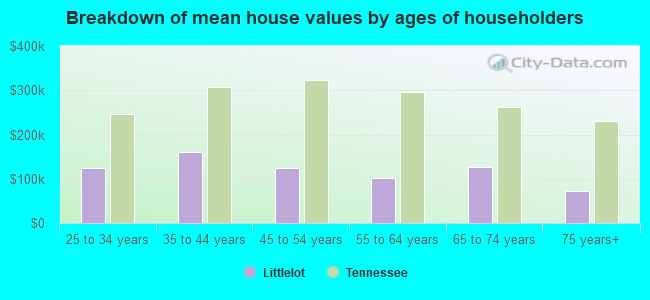
| Littlelot: | $224,697 |
| Tennessee: | $284,800 |
Total population: 4,637 (Urban population: 0, Rural population: 4,374 (196 farm, 4,178 nonfarm))
Houses: 1,751 (1,614 occupied: 1,365 owner occupied, 249 renter occupied)
| % of renters here: | 15% |
| State: | 33% |
Housing density: 19 houses/condos per square mile
Median price asked for vacant for-sale houses and condos in 2022 in this county: $232,054.
Median contract rent in 2022: $816 (lower quartile is $733, upper quartile is $931)
Median rent asked for vacant for-rent units in 2022: $850
Median gross rent in Littlelot, TN in 2022: $1,065
Housing units in Littlelot with a mortgage: 430 (19 second mortgage, 39 home equity loan, 0 both second mortgage and home equity loan)
Houses without a mortgage: 253


Household type by relationship:
Households: 23,177- In family households: 20,063 (4,576 male householders, 1,805 female householders)
4,809 spouses, 6,573 children (5,816 natural, 195 adopted, 562 stepchildren), 769 grandchildren, 179 brothers or sisters, 193 parents, foster children, 253 other relatives, 705 non-relatives
- In nonfamily households: 3,114 (1,343 male householders (1,083 living alone)), 1,252 female householders (1,112 living alone)), 519 nonrelatives
- In group quarters: 1,513 (1,480 institutionalized population)
3,849 married couples with children.
1,083 single-parent households (337 men, 746 women).
97.6% of residents of Littlelot speak English at home.
1.9% of residents speak Spanish at home (71% speak English very well, 29% speak English not well).
0.4% of residents speak other Indo-European language at home (100% speak English very well).
Foreign born population: 90 (1.8%)
(67.8% of them are naturalized citizens)
| Here: | 6.3 |
| State: | 6.5 |
| Here: | 4.9 |
| State: | 4.4 |
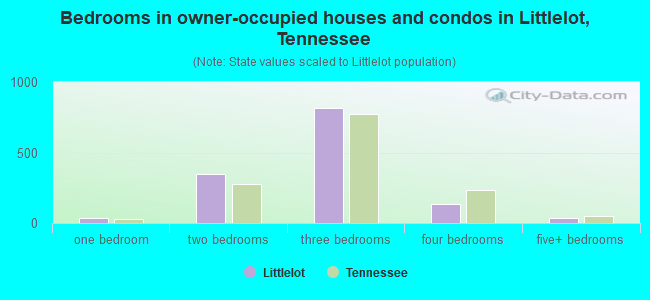
- Bedrooms in owner-occupied houses and condos in Littlelot, Tennessee
- 0no bedroom
- 321 bedroom
- 3462 bedrooms
- 8143 bedrooms
- 1344 bedrooms
- 395+ bedrooms
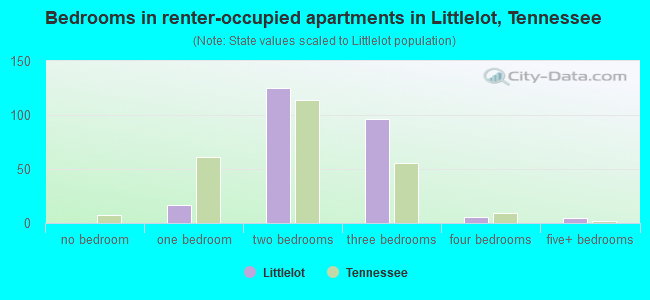
- Bedrooms in renter-occupied apartments in Littlelot, Tennessee
- 0no bedroom
- 171 bedroom
- 1252 bedrooms
- 963 bedrooms
- 64 bedrooms
- 55+ bedrooms
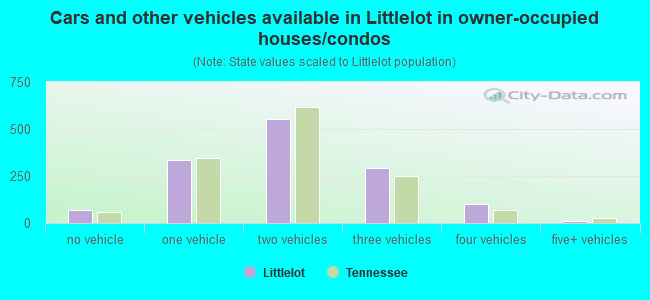
- Cars and other vehicles available in Littlelot in owner-occupied houses/condos
- 70no vehicle
- 3371 vehicle
- 5532 vehicles
- 2933 vehicles
- 994 vehicles
- 135+ vehicles
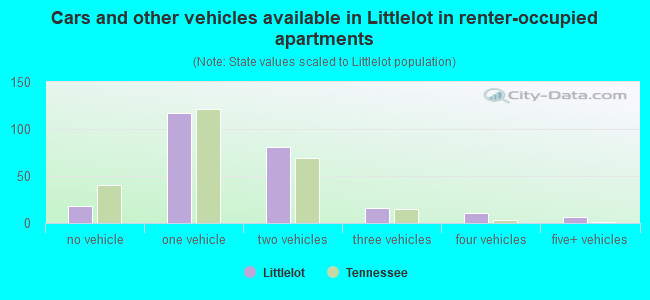
- Cars and other vehicles available in Littlelot in renter-occupied apartments
- 18no vehicle
- 1171 vehicle
- 812 vehicles
- 163 vehicles
- 114 vehicles
- 65+ vehicles
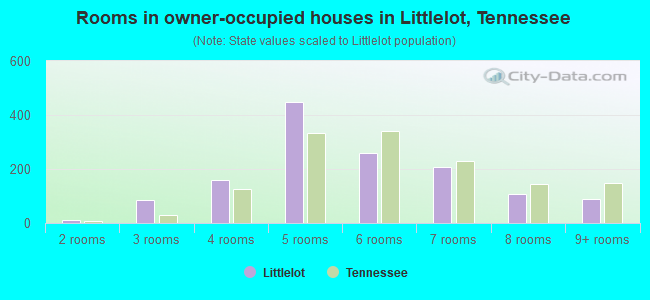
- Rooms in owner-occupied houses in Littlelot, Tennessee
- 01 room
- 122 rooms
- 843 rooms
- 1584 rooms
- 4495 rooms
- 2586 rooms
- 2067 rooms
- 1098 rooms
- 899+ rooms
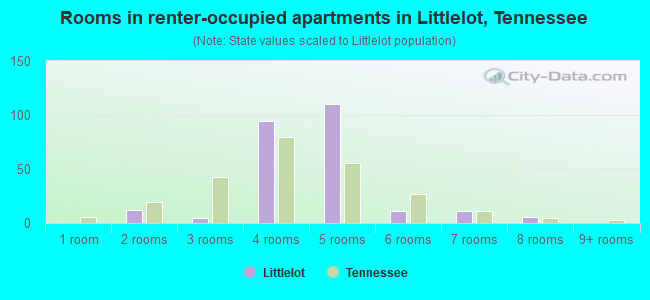
- Rooms in renter-occupied apartments in Littlelot, Tennessee
- 01 room
- 122 rooms
- 53 rooms
- 944 rooms
- 1105 rooms
- 116 rooms
- 117 rooms
- 68 rooms
- 09+ rooms
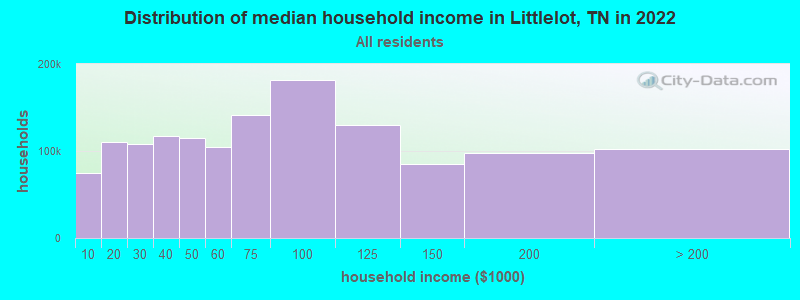
Littlelot, TN household income distribution

- 49,165Less than $10,000
- 82,464$10,000 to $19,999
- 78,206$20,000 to $29,999
- 79,962$30,000 to $39,999
- 77,313$40,000 to $49,999
- 71,560$50,000 to $59,999
- 97,564$60,000 to $74,999
- 124,357$75,000 to $99,999
- 93,005$100,000 to $124,999
- 55,398$125,000 to $149,999
- 60,805$150,000 to $199,999
- 51,401$200,000 or more
Percentage of workers working in this county: 29.2%
Number of people working at home: 210 (9.8% of all workers)
Travel time to work (commute)
- Less than 5 minutes: 17
- 5 to 9 minutes: 83
- 10 to 14 minutes: 92
- 15 to 19 minutes: 138
- 20 to 24 minutes: 247
- 25 to 29 minutes: 118
- 30 to 34 minutes: 255
- 35 to 39 minutes: 87
- 40 to 44 minutes: 62
- 45 to 59 minutes: 336
- 60 to 89 minutes: 327
- 90 or more minutes: 110
Means of transportation to work:
- Drove a car alone: 1,432 (74.9%)
- Carpooled: 414 (21.6%)
- Motorcycle: 8 (0.4%)
- Walked: 5 (0.3%)
- Other means: 13 (0.7%)
- Worked at home: 41 (2.1%)
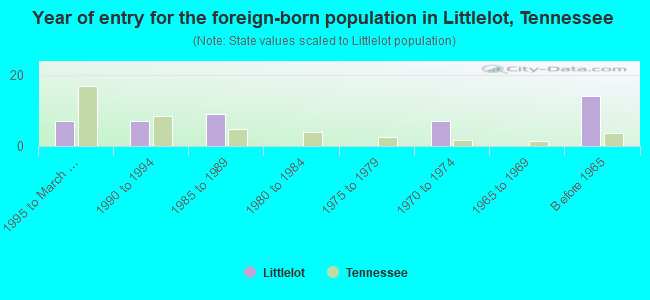
- Year of entry for the foreign-born population in Littlelot, Tennessee
- 71995 to March 2000
- 71990 to 1994
- 91985 to 1989
- 01980 to 1984
- 01975 to 1979
- 71970 to 1974
- 01965 to 1969
- 14Before 1965
Most common places of birth for foreign-born residents (%):
| Littlelot: | 36.4% (16) |
| Tennessee: | 4.8% (7,701) |
| Littlelot: | 34.1% (15) |
| Tennessee: | 0.3% (546) |
| Littlelot: | 15.9% (7) |
| Tennessee: | 3.6% (5,726) |
| Littlelot: | 13.6% (6) |
| Tennessee: | 4.4% (6,981) |
Place of birth for U.S.-born residents:
- This state: 3,213
- Other state: 1,117
- Northeast: 160
- Midwest: 437
- South: 367
- West: 153
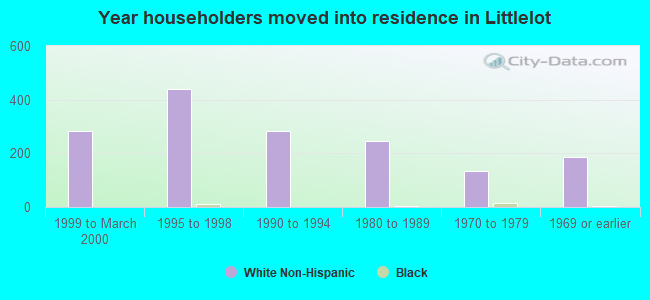
58% of Littlelot residents lived in the same house 5 years ago.
Out of people who lived in different houses, 31% lived in this county.
Out of people who lived in different counties, 74% lived in Tennessee.
Education attainment for males 25 years and older:
- No schooling: 20
- Nursery to 4th grade: 17
- 5th and 6th grade: 49
- 7th and 8th grade: 123
- 9th grade: 139
- 10th grade: 120
- 11th grade: 72
- 12th grade, no diploma: 50
- High school graduate (or equivalency): 481
- Less than 1 year of college: 82
- Some college more than 1 year, no degree: 116
- Associate degree: 69
- Bachelor's degree: 65
- Master's degree: 18
- Professional school degree: 6
- Doctorate degree: 0

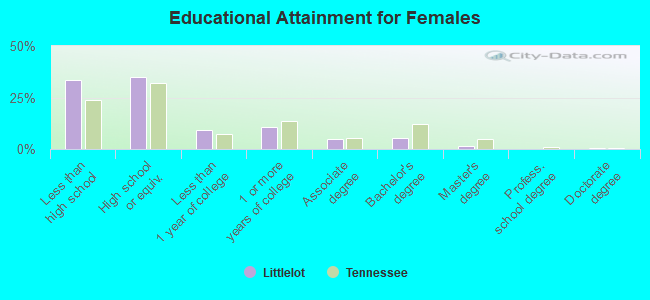
Education attainment for females 25 years and older:
- No schooling: 16
- Nursery to 4th grade: 13
- 5th and 6th grade: 41
- 7th and 8th grade: 99
- 9th grade: 49
- 10th grade: 100
- 11th grade: 82
- 12th grade, no diploma: 55
- High school graduate (or equivalency): 476
- Less than 1 year of college: 129
- Some college more than 1 year, no degree: 143
- Associate degree: 64
- Bachelor's degree: 76
- Master's degree: 17
- Professional school degree: 0
- Doctorate degree: 6


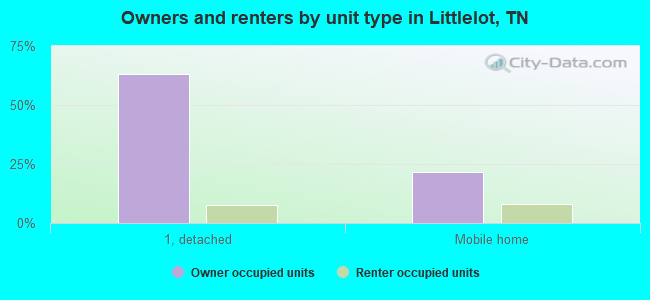
Housing units in structures:
- One, detached: 1,203
- 3 or 4: 9
- Mobile homes: 528
- Boats, RVs, vans, etc.: 11
Median worth of mobile homes: $105,249
Housing units lacking complete kitchen facilities: 2.2%
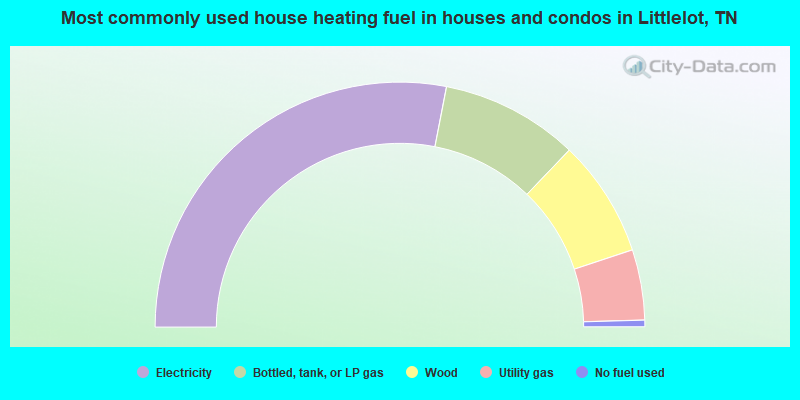
- 56.1%Electricity
- 18.2%Bottled, tank, or LP gas
- 15.5%Wood
- 9.3%Utility gas
- 0.9%No fuel used
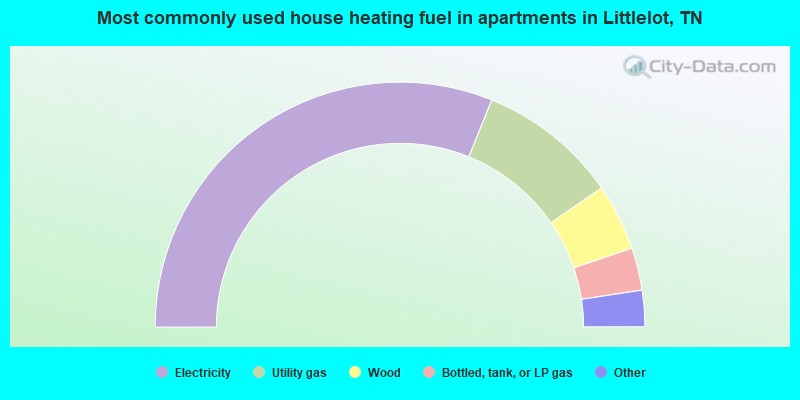
- 62.2%Electricity
- 18.5%Utility gas
- 8.8%Wood
- 5.6%Bottled, tank, or LP gas
- 2.8%No fuel used
- 2.0%Fuel oil, kerosene, etc.
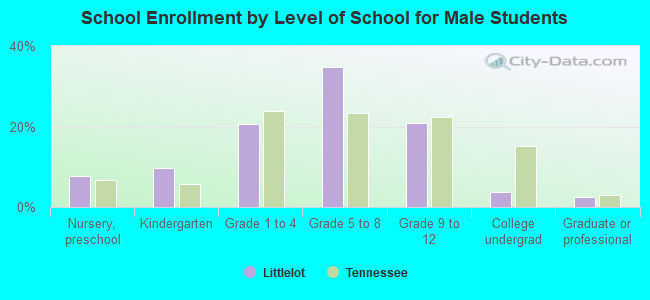
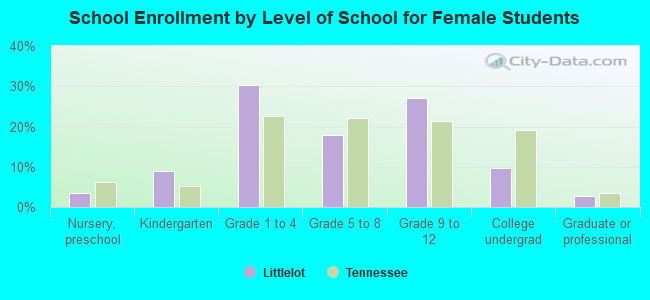
Private vs. public school enrollment:
| Here: | 4.9% |
| Tennessee: | 9.5% |
| Here: | 15.9% |
| Tennessee: | 10.4% |
| Here: | 10.8% |
| Tennessee: | 22.8% |