Lynnfield, MA (Massachusetts) Houses and Residents
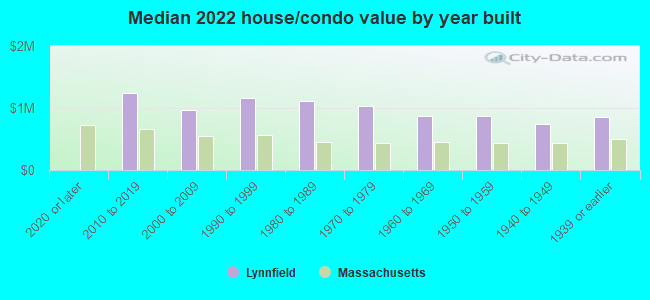
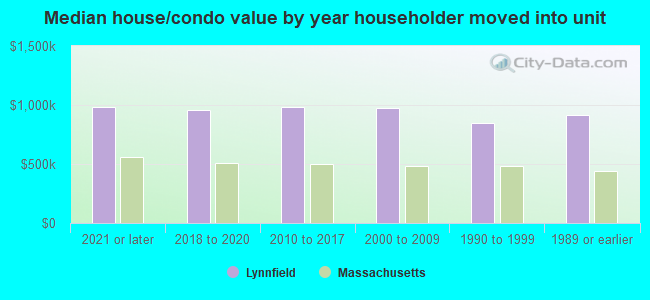
| Lynnfield: | $934,293 |
| Massachusetts: | $534,700 |
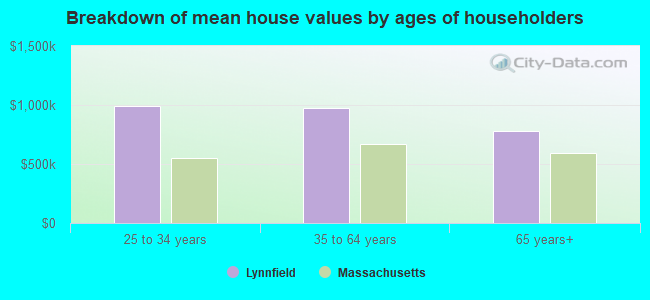
Mean price in 2022:
Detached houses: $836,148
Here: $836,148 State: $651,570 Townhouses or other attached units: $928,380
Here: $928,380 State: $617,749 In 3-to-4-unit structures: $279,396
Here: $279,396 State: $601,912 In 5-or-more-unit structures: $515,853
Here: $515,853 State: $555,768
Total population: 11,596 (Urban population: 11,542, Rural population: 0)
Houses: 4,893 (4,687 occupied: 4,012 owner occupied, 688 renter occupied)
| % of renters here: | 15% |
| State: | 38% |
Housing density: 482 houses/condos per square mile
Median price asked for vacant for-sale houses and condos in 2022: $832,583.
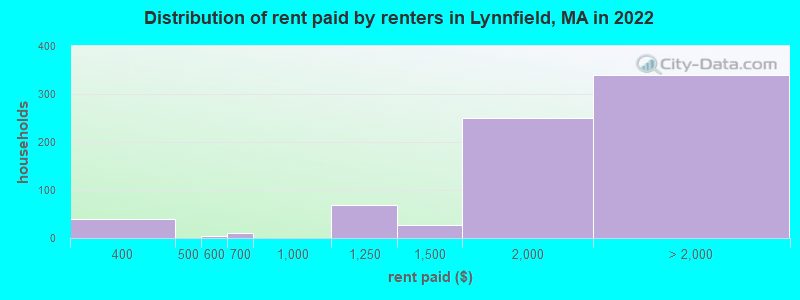
Median contract rent in 2022: over $2,000 (lower quartile is $1,568, upper quartile is over $2,000)
Median gross rent in Lynnfield, MA in 2022: over $2,000
Housing units in Lynnfield with a mortgage: 2,883 (547 second mortgage, 0 home equity loan, 531 both second mortgage and home equity loan)
Houses without a mortgage: 175
Median household income for houses/condos with a mortgage: $195,737
Median household income for apartments without a mortgage: $94,066
Median monthly housing costs: $2,811
Compare current foreclosures near Lynnfield, MA:
| Photo | Address | Area | Beds / Baths | Price | Details |
|---|---|---|---|---|---|

|
#1
Williams Rd
Lynnfield, MA 01940
|
1,368 sq. feet
|
1 baths 1 beds |
show details | |

|
#2
Bourque Rd
Lynnfield, MA 01940
|
2,292 sq. feet
|
2 baths 3 beds |
show details | |

|
#3
Cider Mill Rd
Lynnfield, MA 01940
|
4,348 sq. feet
|
2 baths 2 beds |
show details | |

|
#4
Beaver Ave
Lynnfield, MA 01940
|
1,344 sq. feet
|
1 baths 3 beds |
show details | |

|
#5
Lowell St
Lynnfield, MA 01940
|
2,330 sq. feet
|
1 baths 3 beds |
show details | |

|
#6
Main St
Lynnfield, MA 01940
|
960 sq. feet
|
1 baths 2 beds |
show details | |

|
#7
Boyd St
Boston, MA 02124
|
3,970 sq. feet
|
3 baths 9 beds |
$650,000
|
show details |

|
#8
Portland St
Lynn, MA 01902
|
851 sq. feet
|
2 baths 2 beds |
show details | |

|
#9
Church St
Boston, MA 02122
|
3,663 sq. feet
|
3 baths 6 beds |
show details | |

|
#10
Lyons St
Lowell, MA 01852
|
1,314 sq. feet
|
1 baths 2 beds |
show details |
| Photo | Address | Area | Beds / Baths | Price | Details |
|---|---|---|---|---|---|

|
#11
Lawrence Ave
Boston, MA 02121
|
3,366 sq. feet
|
2 baths 5 beds |
show details | |

|
#12
Boston Rd
Chelmsford, MA 01824
|
1,392 sq. feet
|
1 baths 3 beds |
show details | |

|
#13
Hadley St # 2
Medford, MA 02155
|
1,866 sq. feet
|
1 baths 3 beds |
show details | |

|
#14
Bloomfield St
Boston, MA 02124
|
2,667 sq. feet
|
2 baths 6 beds |
show details | |

|
#15
Chase St
Beverly, MA 01915
|
1,407 sq. feet
|
1 baths 3 beds |
show details | |

|
#16
Forest Park Rd
Woburn, MA 01801
|
1,132 sq. feet
|
1 baths 3 beds |
show details | |

|
#17
Salem Rd
Billerica, MA 01821
|
1,428 sq. feet
|
1 baths 4 beds |
show details | |

|
#18
Weare St
Lawrence, MA 01843
|
1,222 sq. feet
|
1 baths 3 beds |
show details | |

|
#19
Margin Street
Lynn, MA 01905
|
1,240 sq. feet
|
2 baths 2 beds |
show details | |

|
#20
Mill River Ln
Rowley, MA 01969
|
2,705 sq. feet
|
2 baths 4 beds |
show details |
| Photo | Address | Area | Beds / Baths | Price | Details |
|---|---|---|---|---|---|

|
#21
S Broadway
Lawrence, MA 01843
|
5,706 sq. feet
|
2 baths 6 beds |
show details | |

|
#22
Cora St
Winthrop, MA 02152
|
1,452 sq. feet
|
1 baths 2 beds |
show details | |

|
#23
Thornton St
Lawrence, MA 01841
|
912 sq. feet
|
1 baths 2 beds |
show details | |

|
#24
Lincoln Ave
Saugus, MA 01906
|
1,080 sq. feet
|
1 baths 3 beds |
show details | |

|
#25
Gordon St
Allston, MA 02134
|
3,246 sq. feet
|
2 baths 5 beds |
show details | |

|
#26
Magnolia St
Boston, MA 02125
|
3,654 sq. feet
|
3 baths 6 beds |
show details | |

|
#27
Merrill Ave
Lynn, MA 01902
|
1,136 sq. feet
|
1 baths 3 beds |
show details | |

|
#28
Atlantic Street, Unit A 10 A/k/a Unit 10, Marilyn Condominium
Lynn, MA 01902
|
576 sq. feet
|
1 baths 1 beds |
show details | |

|
#29
Essex St
Swampscott, MA 01907
|
2,029 sq. feet
|
2 baths 3 beds |
show details | |

|
#30
Forest St
Boston, MA 02119
|
1,540 sq. feet
|
1 baths 3 beds |
show details |
| Photo | Address | Area | Beds / Baths | Price | Details |
|---|---|---|---|---|---|

|
#31
Chestnut St
Lynn, MA 01902
|
5,391 sq. feet
|
3 baths 9 beds |
show details | |

|
#32
Salem St
North Andover, MA 01845
|
1,572 sq. feet
|
1 baths 2 beds |
show details | |

|
#33
Iroquois St
Boston, MA 02120
|
2,524 sq. feet
|
1 baths 4 beds |
show details | |

|
#34
Emily Rd
Tewksbury, MA 01876
|
1,600 sq. feet
|
1 baths 3 beds |
show details | |

|
#35
Cardington Ave
Billerica, MA 01821
|
1,242 sq. feet
|
1 baths 5 beds |
show details | |

|
#36
Chester St # 1
Lawrence, MA 01843
|
4,935 sq. feet
|
3 baths 9 beds |
show details | |

|
#37
Duff St
Watertown, MA 02472
|
1,743 sq. feet
|
1 baths 3 beds |
show details | |

|
#38
W 7th St # B
Boston, MA 02127
|
946 sq. feet
|
1 baths 2 beds |
show details | |

|
#39
North St
Andover, MA 01810
|
2,196 sq. feet
|
1 baths 5 beds |
show details | |

|
#40
Shawmut Ave Apt 1
Boston, MA 02118
|
610 sq. feet
|
1 baths 1 beds |
show details |
| Photo | Address | Area | Beds / Baths | Price | Details |
|---|---|---|---|---|---|

|
#41
Newton St
Lawrence, MA 01843
|
2,232 sq. feet
|
2 baths 4 beds |
show details | |

|
#42
Gladstone St
Boston, MA 02128
|
2,184 sq. feet
|
2 baths 6 beds |
show details | |

|
#43
Liana St
Woburn, MA 01801
|
962 sq. feet
|
1 baths 2 beds |
show details | |

|
#44
Limewood Ave
Billerica, MA 01821
|
1,409 sq. feet
|
1 baths 3 beds |
show details | |

|
#45
E Brookline St Apt 3
Boston, MA 02118
|
642 sq. feet
|
1 baths 2 beds |
show details | |

|
#46
Thorndike Rd
North Andover, MA 01845
|
1,297 sq. feet
|
2 baths 4 beds |
show details | |

|
#47
E 5th St
Boston, MA 02127
|
2,111 sq. feet
|
2 baths 4 beds |
show details | |

|
#48
E 5th St
Boston, MA 02127
|
1,912 sq. feet
|
1 baths 3 beds |
show details | |

|
#49
Emerson St
Boston, MA 02127
|
3,390 sq. feet
|
3 baths 6 beds |
show details | |

|
Check over 1 million property listings on Foreclosure.com!
|
browse all offers | |||

Latest news about housing in Lynnfield, MA collected exclusively by city-data.com from local newspapers, TV, and radio stations

 | How Much Massachusetts Households Make Per Year: Census Data (37 replies) |
| 2024 Real Estate Observations (859 replies) |
| Indian Community rental homes (1 reply) |
| 2023 Real Estate Observations (5278 replies) |
| 2021 Real Estate Observations (1729 replies) |
| What Are the Cheapest and Most Expensive Single Family Home For Sale In Your Town? (50 replies) |

Median year apartment built: 2003
Household type by relationship:
Households: 12,935- Male householders: 2,302 (323 living alone), Female householders: 2,342 (512 living alone)
3,232 spouses (3,232 opposite-sex spouses), 108 unmarried partners, (41 opposite-sex unmarried partners), 4,523 children (4,393 natural, 120 adopted, 10 stepchildren), 164 grandchildren, 42 brothers or sisters, 55 parents, 0 foster children, 68 other relatives, 63 non-relatives
- In group quarters: 33
Size of family households: 1,324 2-persons, 1,023 3-persons, 740 4-persons, 529 5-persons, 27 6-persons, 8 7-or-more-persons.
Size of nonfamily households: 900 1-person, 105 2-persons, 12 3-persons.
2,793 married couples with children.
305 single-parent households (61 men, 244 women).
82.3% of residents of Lynnfield speak English at home.
4.0% of residents speak Spanish at home (71% speak English very well, 12% speak English well, 16% speak English not well).
6.2% of residents speak other Indo-European language at home (82% speak English very well, 13% speak English well, 5% speak English not well).
6.4% of residents speak Asian or Pacific Island language at home (42% speak English very well, 12% speak English well, 46% speak English not well).
0.2% of residents speak other language at home (50% speak English well, 50% speak English not well).
Foreign born population: 1,575 (12.2%)
(75.1% of them are naturalized citizens)
| Here: | 7.8 |
| State: | 6.5 |
| Here: | 3.7 |
| State: | 4.0 |
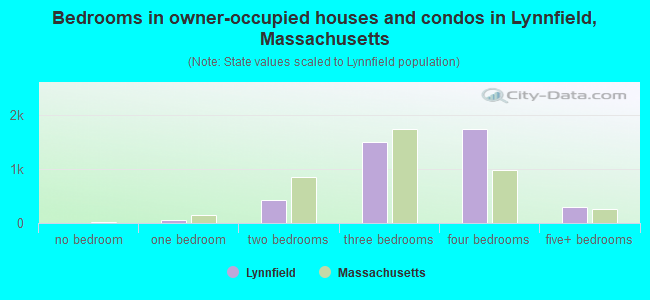
- Bedrooms in owner-occupied houses and condos in Lynnfield, Massachusetts
- 0no bedroom
- 571 bedroom
- 4312 bedrooms
- 1,4963 bedrooms
- 1,7374 bedrooms
- 2925+ bedrooms
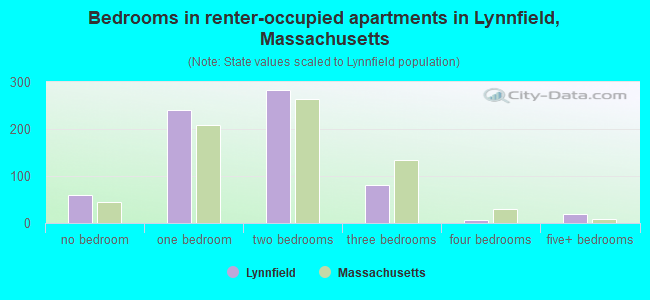
- Bedrooms in renter-occupied apartments in Lynnfield, Massachusetts
- 60no bedroom
- 2401 bedroom
- 2832 bedrooms
- 803 bedrooms
- 64 bedrooms
- 205+ bedrooms
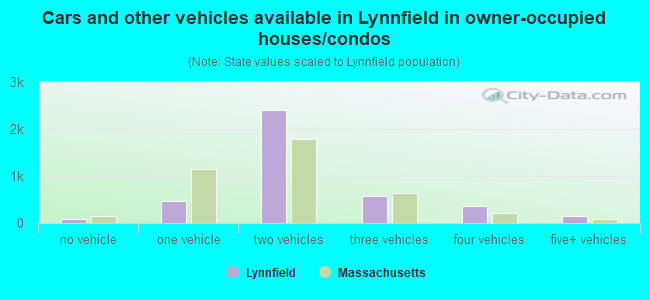
- Cars and other vehicles available in Lynnfield in owner-occupied houses/condos
- 81no vehicle
- 4631 vehicle
- 2,3982 vehicles
- 5713 vehicles
- 3564 vehicles
- 1435+ vehicles
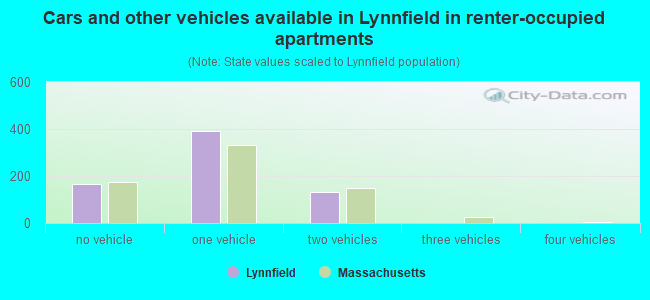
- Cars and other vehicles available in Lynnfield in renter-occupied apartments
- 166no vehicle
- 3901 vehicle
- 1332 vehicles
- 03 vehicles
- 04 vehicles
- 05+ vehicles
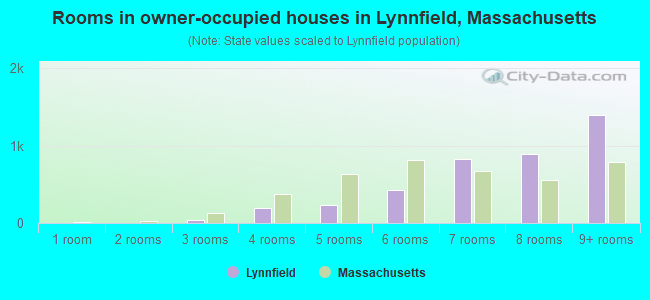
- Rooms in owner-occupied houses in Lynnfield, Massachusetts
- 01 room
- 02 rooms
- 333 rooms
- 1954 rooms
- 2345 rooms
- 4296 rooms
- 8227 rooms
- 8998 rooms
- 1,3999+ rooms
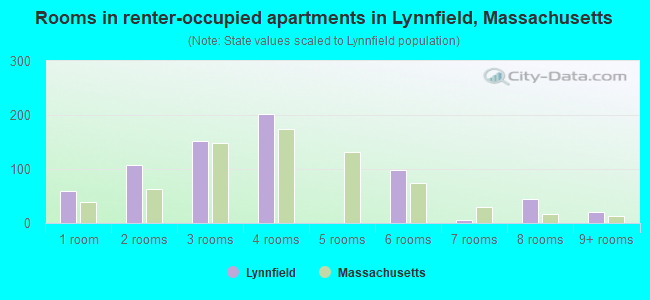
- Rooms in renter-occupied apartments in Lynnfield, Massachusetts
- 601 room
- 1082 rooms
- 1513 rooms
- 2024 rooms
- 05 rooms
- 986 rooms
- 67 rooms
- 448 rooms
- 209+ rooms
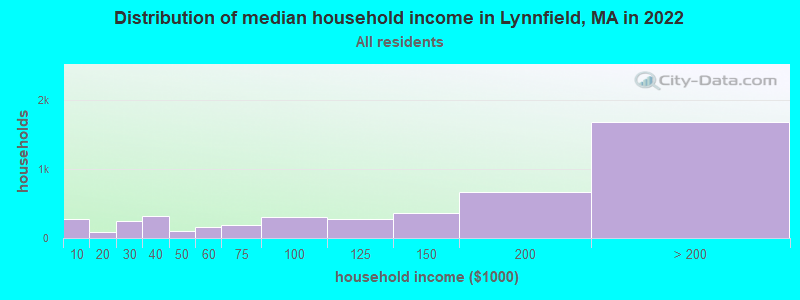
Lynnfield, MA household income distribution

- 278Less than $10,000
- 88$10,000 to $19,999
- 254$20,000 to $29,999
- 324$30,000 to $39,999
- 103$40,000 to $49,999
- 163$50,000 to $59,999
- 192$60,000 to $74,999
- 302$75,000 to $99,999
- 271$100,000 to $124,999
- 364$125,000 to $149,999
- 662$150,000 to $199,999
- 1,687$200,000 or more
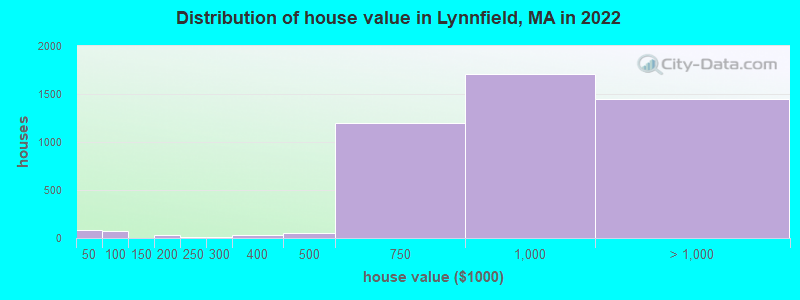
Home value of owner - occupied houses in 2022 in Lynnfield, MA
-
- 84Less than $10,000
- 31$60,000 to $69,999
- 38$80,000 to $89,999
- 23$150,000 to $174,999
- 5$175,000 to $199,999
- 11$200,000 to $249,999
- 10$250,000 to $299,999
- 28$300,000 to $399,999
- 56$400,000 to $499,999
- 1,194$500,000 to $749,999
- 1,712$750,000 to $999,999
- 1,254$1,000,000 to $1,499,999
- 133$1,500,000 to $1,999,999
- 55$2,000,000 or more
Rent paid by renters in 2022 in Lynnfield, MA
-
- 8$300 to $349
- 31$350 to $399
- 3$550 to $599
- 10$650 to $699
- 69$1,000 to $1,249
- 26$1,250 to $1,499
- 250$1,500 to $1,999
- 205$2,000 to $2,499
- 58$2,500 to $2,999
- 11$3,000 to $3,499
- 47$3,500 or more
- 15No cash rent
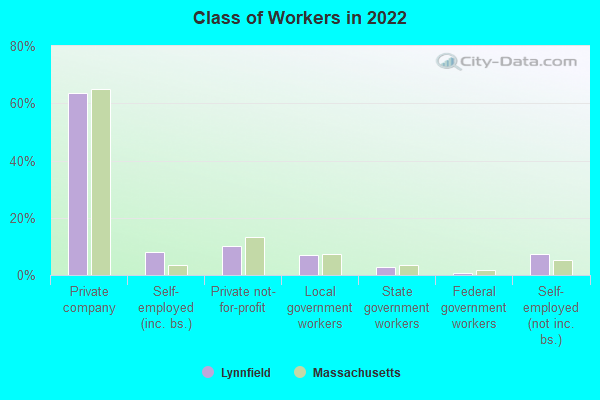
Percentage of workers working in this county: 51.2%
Number of people working at home: 1,786 (27.7% of all workers)
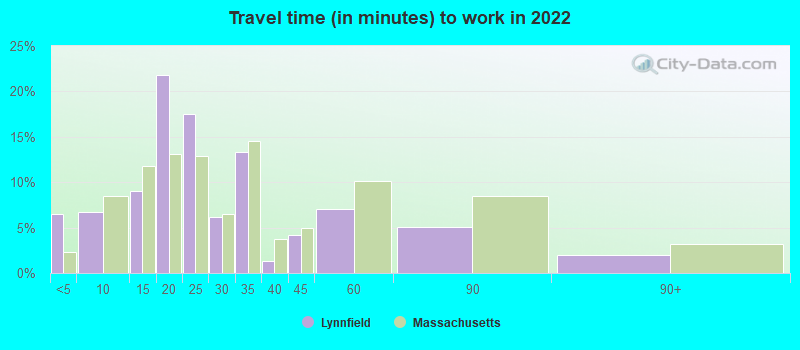
Travel time to work (commute)
- Less than 5 minutes: 118
- 5 to 9 minutes: 348
- 10 to 14 minutes: 271
- 15 to 19 minutes: 453
- 20 to 24 minutes: 649
- 25 to 29 minutes: 262
- 30 to 34 minutes: 855
- 35 to 39 minutes: 427
- 40 to 44 minutes: 354
- 45 to 59 minutes: 638
- 60 to 89 minutes: 453
- 90 or more minutes: 41
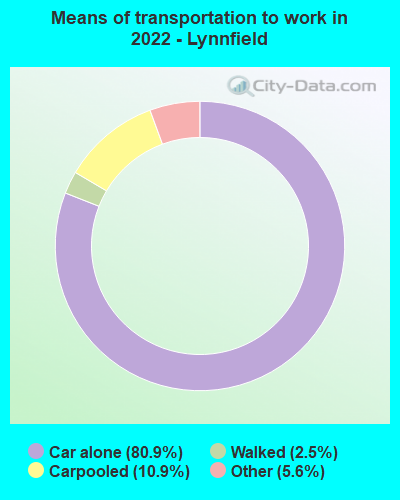
Means of transportation to work:
- Drove a car alone: 3,546 (59.5%)
- Carpooled: 365 (6.1%)
- Taxi: 371 (6.2%)
- Walked: 98 (1.6%)
- Worked at home: 1,786 (30.0%)
- Unemployment by race in 2022
- Unemployment rate for White non-Hispanic residents
- 2.5%Males
- 2.0%Females
- Unemployment rate for Black residents
- 20.9%Males
- Unemployment rate for other race residents
- 33.4%Females
- Unemployment rate for Hispanic or Latino residents
- 7.8%Males
- 25.6%Females
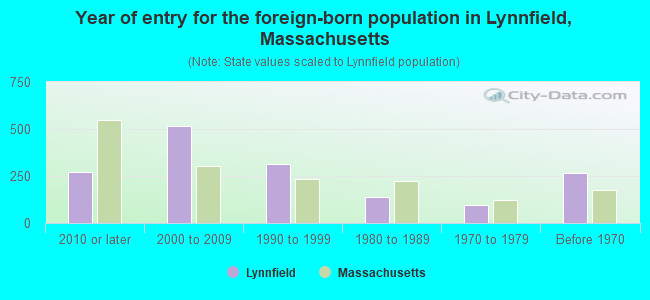
- Year of entry for the foreign-born population in Lynnfield, Massachusetts
- 2722010 or later
- 5172000 to 2009
- 3131990 to 1999
- 1381980 to 1989
- 941970 to 1979
- 267Before 1970
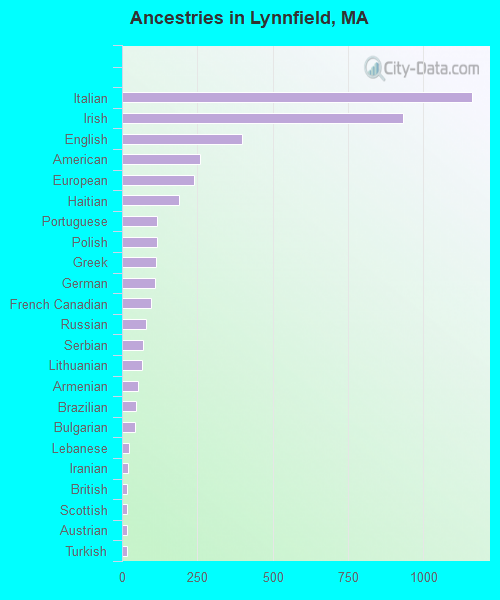
First ancestries reported:
- Italian: 1,161 (20.3%)
- Irish: 933 (16.3%)
- English: 397 (6.9%)
- American: 258 (4.5%)
- European: 238 (4.2%)
- Haitian: 190 (3.3%)
- Portuguese: 117 (2.0%)
- Polish: 115 (2.0%)
- Greek: 113 (2.0%)
- German: 108 (1.9%)
- French Canadian: 96 (1.7%)
- Russian: 79 (1.4%)
- Serbian: 71 (1.2%)
- Lithuanian: 66 (1.2%)
- Armenian: 54 (0.9%)
- Brazilian: 48 (0.8%)
- Bulgarian: 44 (0.8%)
- Lebanese: 24 (0.4%)
- Iranian: 19 (0.3%)
- British: 17 (0.3%)
- Scottish: 17 (0.3%)
- Austrian: 15 (0.3%)
- Turkish: 15 (0.3%)
- Canadian: 8 (0.1%)
- Czech: 7 (0.1%)
- Northern European: 7 (0.1%)
- Swedish: 7 (0.1%)
- Slavic: 3 (0.05%)
Most common places of birth for foreign-born residents (%):
| Lynnfield: | 28.1% (427) |
| Massachusetts: | 8.4% (103,233) |
| Lynnfield: | 11.0% (168) |
| Massachusetts: | 6.8% (82,934) |
| Lynnfield: | 9.9% (150) |
| Massachusetts: | 2.3% (28,158) |
| Lynnfield: | 7.8% (119) |
| Massachusetts: | 7.6% (92,959) |
| Lynnfield: | 6.5% (99) |
| Massachusetts: | 2.3% (27,810) |
| Lynnfield: | 3.7% (57) |
| Massachusetts: | 4.9% (60,432) |
| Lynnfield: | 2.6% (40) |
| Massachusetts: | 1.4% (16,886) |
| Lynnfield: | 2.0% (30) |
| Massachusetts: | 4.1% (50,360) |
| Lynnfield: | 1.9% (29) |
| Massachusetts: | 1.0% (12,709) |
| Lynnfield: | 1.9% (29) |
| Massachusetts: | 8.3% (101,767) |
| Lynnfield: | 1.6% (25) |
| Massachusetts: | 1.0% (12,529) |
| Lynnfield: | 1.6% (25) |
| Massachusetts: | 0.1% (1,277) |
| Lynnfield: | 1.6% (24) |
| Massachusetts: | 0.5% (5,553) |
Place of birth for U.S.-born residents:
- This state: 9,274
- Other state: 1,992
- Northeast: 1,420
- Midwest: 230
- South: 298
- West: 41
90.9% of Lynnfield residents lived in the same house 1 years ago.
Out of people who lived in different houses, 17.9% lived in this county.
Out of people who lived in different counties, 58.5% lived in Massachusetts.
| Lynnfield: | 90.9% |
| State average: | 87.7% |
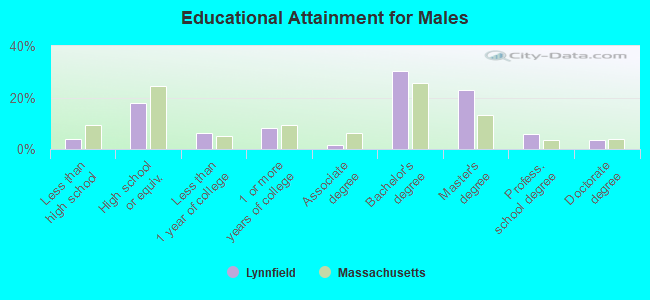
Education attainment for males 25 years and older:
- No schooling: 18
- Nursery to 4th grade: 0
- 5th and 6th grade: 13
- 7th and 8th grade: 10
- 9th grade: 0
- 10th grade: 71
- 11th grade: 0
- 12th grade, no diploma: 50
- High school graduate (or equivalency): 747
- Less than 1 year of college: 265
- Some college more than 1 year, no degree: 335
- Associate degree: 60
- Bachelor's degree: 1,253
- Master's degree: 952
- Professional school degree: 240
- Doctorate degree: 138
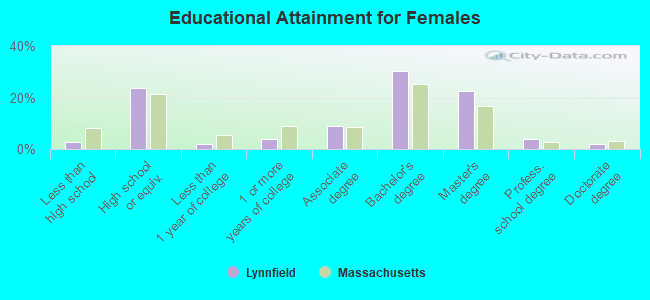
Education attainment for females 25 years and older:
- No schooling: 84
- Nursery to 4th grade: 0
- 5th and 6th grade: 0
- 7th and 8th grade: 0
- 9th grade: 0
- 10th grade: 0
- 11th grade: 0
- 12th grade, no diploma: 41
- High school graduate (or equivalency): 1,106
- Less than 1 year of college: 100
- Some college more than 1 year, no degree: 184
- Associate degree: 429
- Bachelor's degree: 1,429
- Master's degree: 1,056
- Professional school degree: 186
- Doctorate degree: 88


Housing units in structures:
- One, detached: 3,823
- One, attached: 294
- Two: 162
- 3 or 4: 55
- 5 to 9: 43
- 10 to 19: 48
- 20 to 49: 81
- 50 or more: 383
Housing units lacking complete kitchen facilities in 2022: 3.5%
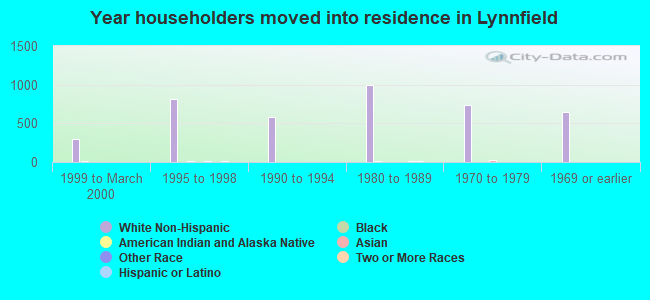
House/condo owner moved in on average 13 years ago
Renter moved in on average 3 years ago
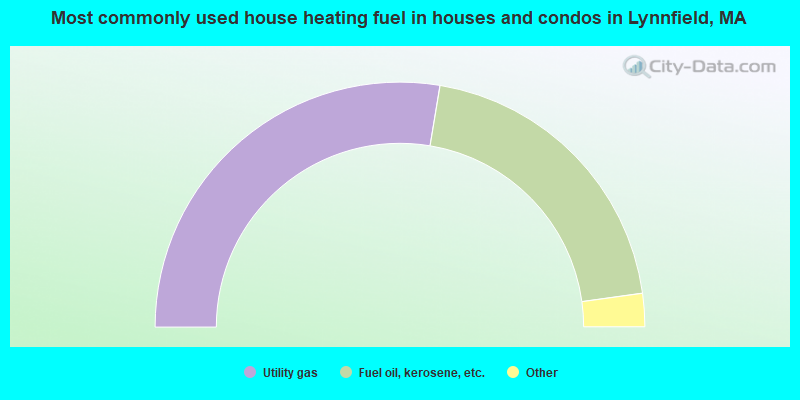
- 55.3%Utility gas
- 40.4%Fuel oil, kerosene, etc.
- 2.6%Bottled, tank, or LP gas
- 1.7%Electricity
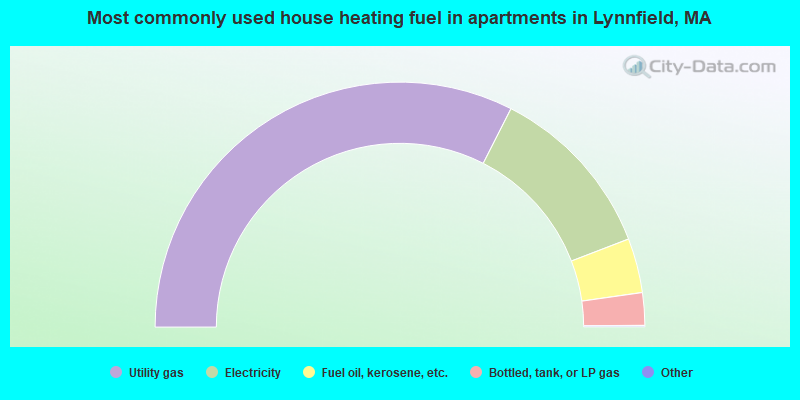
- 65.1%Utility gas
- 23.4%Electricity
- 7.2%Fuel oil, kerosene, etc.
- 4.3%Bottled, tank, or LP gas
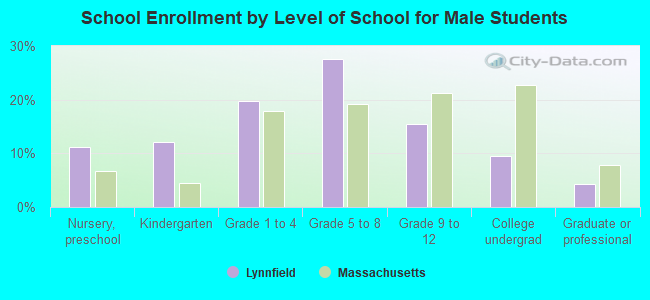
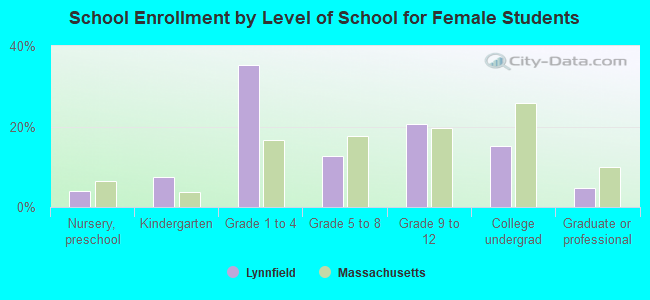
Private vs. public school enrollment:
| Here: | 14.7% |
| Massachusetts: | 10.3% |
| Here: | 18.6% |
| Massachusetts: | 12.3% |
| Here: | 58.9% |
| Massachusetts: | 51.2% |