Maple Heights, OH (Ohio) Houses and Residents
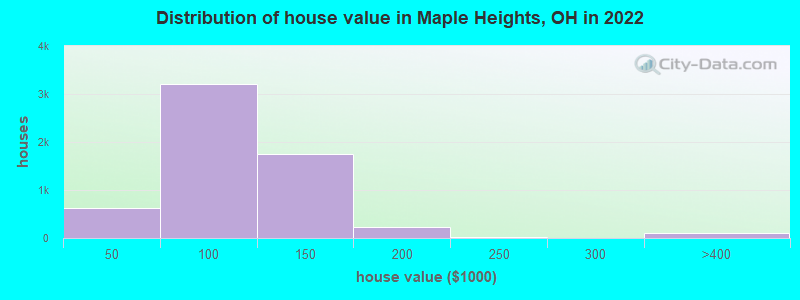
Estimated median house or condo value in 2022: $94,471 (it was $84,800 in 2000 )
Maple Heights:
$94,471Ohio:
$204,100
Lower value quartile - upper value quartile: $73,602 - $118,249Mean price in 2022: Detached houses: $133,689 Here:
$133,689State:
$254,366
Townhouses or other attached units: $97,996 Here:
$97,996State:
$225,733
In 2-unit structures: $163,339 Here:
$163,339State:
$144,384
In 3-to-4-unit structures: $119,747 Here:
$119,747State:
$203,002
In 5-or-more-unit structures: $77,456 Here:
$77,456State:
$211,593
Total population: 22,735 (All urban)
Houses: 11,119 (10,131 occupied: 6,414 owner occupied, 3,776 renter occupied )
% of renters here:
37%State:
33%
Housing density: 2,142 houses/condos per square mile
Median price asked for vacant for-sale houses and condos in 2022: $37,942.
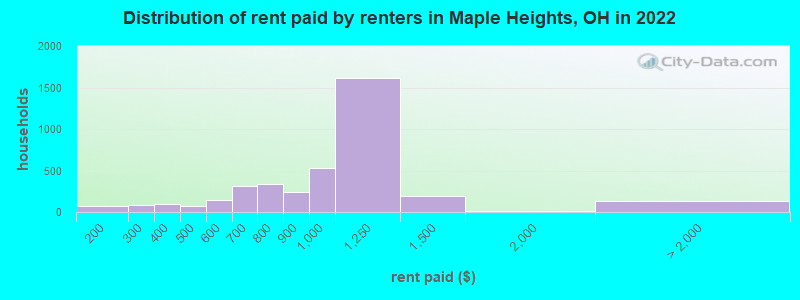
Median contract rent in 2022: $973 (lower quartile is $764, upper quartile is $1,173)
Median rent asked for vacant for-rent units in 2022: $1,287
Median gross rent in Maple Heights, OH in 2022: $1,238
Housing units in Maple Heights with a mortgage: 3,981 (314 second mortgage, 13 home equity loan, 164 both second mortgage and home equity loan )Houses without a mortgage: 220
Median household income for houses/condos with a mortgage: $59,996
Median household income for apartments without a mortgage: $46,326
Median monthly housing costs: $989
Data:
Median house or condo value ($)
Median house or condo value ($ change since 2000)
Median house or condo value ($) - White
Median house or condo value ($) - Black or African American
Median house or condo value ($) - Asian
Median house or condo value ($) - Hispanic or Latino
Median house or condo value ($) - American Indian and Alaska Native
Median house or condo value ($) - Multirace
Median house or condo value ($) - Other Race
Median price asked for mobile homes ($)
Household density (households per square mile)
Mean house or condo value by units in structure - 1, detached ($)
Mean house or condo value by units in structure - 1, attached ($)
Mean house or condo value by units in structure - 2 ($)
Mean house or condo value by units in structure by units in structure - 3 or 4 ($)
Mean house or condo value by units in structure - 5 or more ($)
Mean house or condo value by units in structure - Boat, RV, van, etc. ($)
Mean house or condo value by units in structure - Mobile home ($)
Median contract rent ($)
Median contract rent - Lower quartile ($)
Median contract rent - Upper quartile ($)
Median gross rent ($)
Urban houses (%)
Rural houses (%)
Houses occupied (%)
Houses occupied (% change since 2000)
Houses owner occupied (%)
Houses owner occupied (% change since 2000)
Houses renter occupied (%)
Houses renter occupied (% change since 2000)
Vacant housing units - For rent (%)
Vacant housing units - For rent (% change since 2000)
Vacant housing units - For sale only (%)
Vacant housing units - For sale only (% change since 2000)
Vacant housing units - Rented or sold, not occupied (%)
Vacant housing units - Rented or sold, not occupied (% change since 2000)
Vacant housing units - For seasonal, recreational, or occasional use (%)
Vacant housing units - For seasonal, recreational, or occasional use (% change since 2000)
Vacant housing units - For migrant workers (%)
Vacant housing units - For migrant workers (% change since 2000)
Vacant housing units - Other vacant (%)
Vacant housing units - Other vacant (% change since 2000)
Median monthly housing costs ($)
Median household income for houses/condos with a mortgage ($)
Median household income for houses/condos without a mortgage ($)
Median household income ($)
Median household income ($) - White
Median household income ($) - Black or African American
Median household income ($) - Asian
Median household income ($) - Hispanic or Latino
Median household income ($) - American Indian and Alaska Native
Median household income ($) - Multirace
Median household income ($) - Other Race
Mortgage status - with mortgage (%)
Mortgage status - with second mortgage (%)
Mortgage status - with home equity loan (%)
Mortgage status - with both second mortgage and home equity loan (%)
Mortgage status - without a mortgage (%)
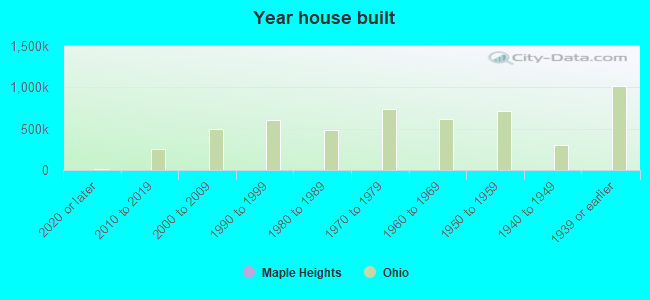
Median year house/condo built
Median year apartment built
Household type by relationship - Male householder living alone (%)
Household type by relationship - Male householder not living alone (%)
Household type by relationship - Female householder living alone (%)
Household type by relationship - Female householder not living alone (%)
Household type by relationship - Opposite-Sex spouse (%)
Household type by relationship - Same-Sex spouse (%)
Household type by relationship - Opposite-Sex unmarried partner (%)
Household type by relationship - Same-Sex unmarried partner (%)
Household type by relationship - In group quarters (%)
Size of family households - 2-person household (%)
Size of family households - 3-person household (%)
Size of family households - 4-person household (%)
Size of family households - 5-person household (%)
Size of family households - 6-person household (%)
Size of family households - 7-or-more-person household (%)
Size of nonfamily households - 1-person household (%)
Size of nonfamily households - 2-person household (%)
Size of nonfamily households - 3-person household (%)
Size of nonfamily households - 4-person household (%)
Size of nonfamily households - 5-person household (%)
Size of nonfamily households - 6-person household (%)
Size of nonfamily households - 7-or-moreperson household (%)
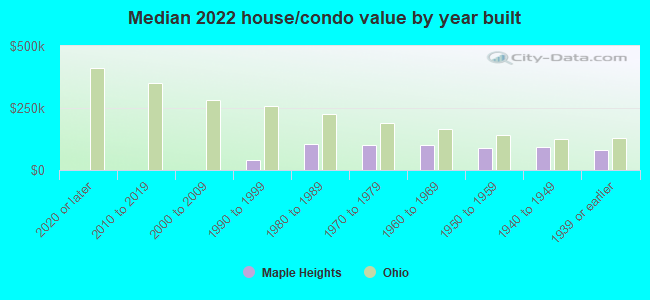
Year house built - Built 2010 or later (%)
Year house built - Built 2000 to 2009 (%)
Year house built - Built 1990 to 1999 (%)
Year house built - Built 1980 to 1989 (%)
Year house built - Built 1970 to 1979 (%)
Year house built - Built 1960 to 1969 (%)
Year house built - Built 1950 to 1959 (%)
Year house built - Built 1940 to 1949 (%)
Year house built - Built 1939 or earlier (%)
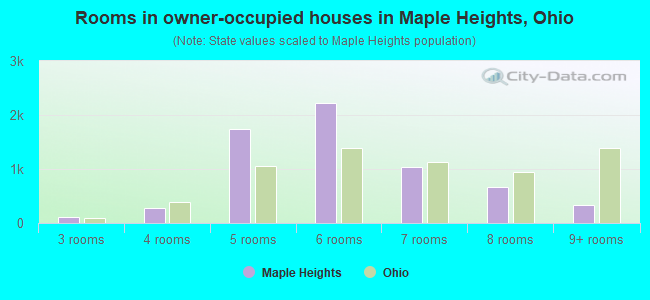
Median number of rooms in houses and condos
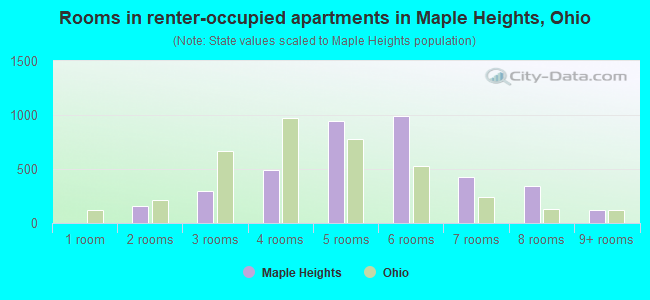
Median number of rooms in apartments
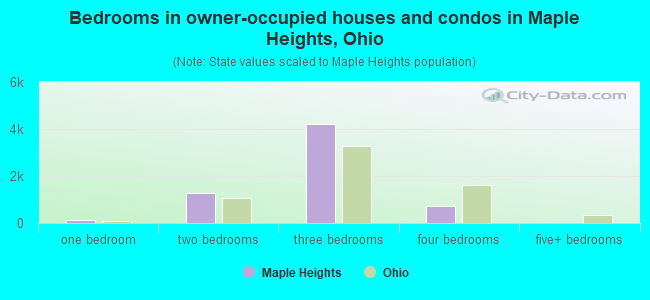
Median number of bedrooms in owner occupied houses
Mean number of bedrooms in owner occupied houses
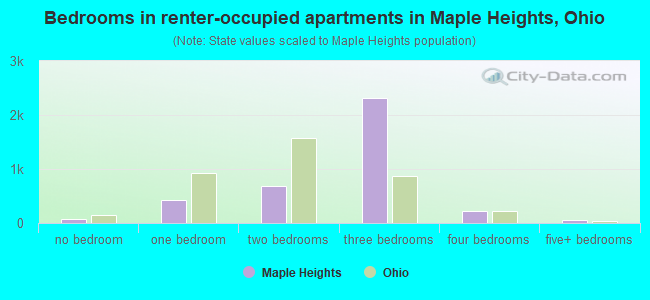
Median number of bedrooms in renter occupied houses
Mean number of bedrooms in renter occupied houses
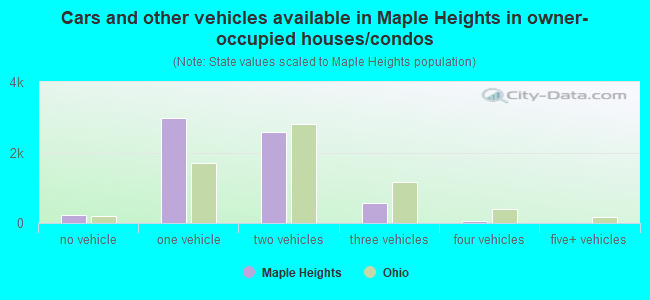
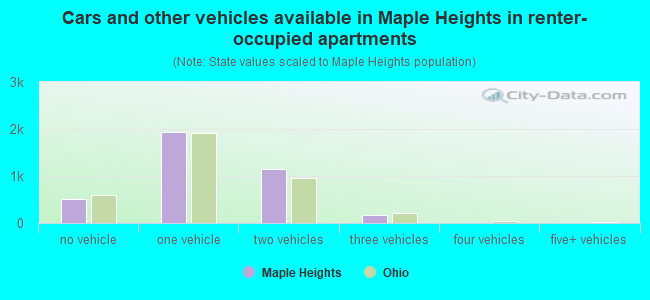
Median number of vehichles in owner occupied houses
Mean number of vehichles in owner occupied houses
Median number of vehichles in renter occupied houses
Mean number of vehichles in renter occupied houses
Rooms in owner-occupied houses - 1 room (%)
Rooms in owner-occupied houses - 2 rooms (%)
Rooms in owner-occupied houses - 3 rooms (%)
Rooms in owner-occupied houses - 4 rooms (%)
Rooms in owner-occupied houses - 5 rooms (%)
Rooms in owner-occupied houses - 6 rooms (%)
Rooms in owner-occupied houses - 7 rooms (%)
Rooms in owner-occupied houses - 8 rooms (%)
Rooms in owner-occupied houses - 9+ rooms (%)
Rooms in renter-occupied houses - 1 room (%)
Rooms in renter-occupied houses - 2 rooms (%)
Rooms in renter-occupied houses - 3 rooms (%)
Rooms in renter-occupied houses - 4 rooms (%)
Rooms in renter-occupied houses - 5 rooms (%)
Rooms in renter-occupied houses - 6 rooms (%)
Rooms in renter-occupied houses - 7 rooms (%)
Rooms in renter-occupied houses - 8 rooms (%)
Rooms in renter-occupied houses - 9+ rooms (%)
Bedrooms in owner-occupied houses - no bedrooms (%)
Bedrooms in owner-occupied houses - 1 bedroom (%)
Bedrooms in owner-occupied houses - 2 bedrooms (%)
Bedrooms in owner-occupied houses - 3 bedrooms (%)
Bedrooms in owner-occupied houses - 4 bedrooms (%)
Bedrooms in owner-occupied houses - 5+ bedrooms (%)
Bedrooms in renter-occupied houses - no bedrooms (%)
Bedrooms in renter-occupied houses - 1 bedroom (%)
Bedrooms in renter-occupied houses - 2 bedrooms (%)
Bedrooms in renter-occupied houses - 3 bedrooms (%)
Bedrooms in renter-occupied houses - 4 bedrooms (%)
Bedrooms in renter-occupied houses - 5+ bedrooms (%)
Vehicles available in owner-occupied houses - no vehicle available (%)
Vehicles available in owner-occupied houses - 1 vehicle available(%)
Vehicles available in owner-occupied houses - 2 Vehicles available (%)
Vehicles available in owner-occupied houses - 3 Vehicles available (%)
Vehicles available in owner-occupied houses - 4 Vehicles available (%)
Vehicles available in owner-occupied houses - 5+ Vehicles available (%)
Vehicles available in renter-occupied houses - no vehicle available (%)
Vehicles available in renter-occupied houses - 1 vehicle available (%)
Vehicles available in renter-occupied houses - 2 Vehicles available (%)
Vehicles available in renter-occupied houses - 3 Vehicles available (%)
Vehicles available in renter-occupied houses - 4 Vehicles available (%)
Vehicles available in renter-occupied houses - 5+ Vehicles available (%)
Housing units in structures - 1, detached (%)
Housing units in structures - 1, attached (%)
Housing units in structures - 2 (%)
Housing units in structures - 3 or 4 (%)
Housing units in structures - 5 to 9 (%)
Housing units in structures - 10 to 19 (%)
Housing units in structures - 20 to 49 (%)
Housing units in structures - 50 or more (%)
Housing units in structures - Mobile home (%)
Housing units in structures - Boat, RV, van, etc. (%)
Housing units in structures - Owners - 1, detached (%)
Housing units in structures - Owners - 1, attached (%)
Housing units in structures - Owners - 2 (%)
Housing units in structures - Owners - 3 or 4 (%)
Housing units in structures - Owners - 5 to 9 (%)
Housing units in structures - Owners - 10 to 19 (%)
Housing units in structures - Owners - 20 to 49 (%)
Housing units in structures - Owners - 50 or more (%)
Housing units in structures - Owners - Mobile home (%)
Housing units in structures - Owners - Boat, RV, van, etc. (%)
Housing units in structures - Renters - 1, detached (%)
Housing units in structures - Renters - 1, attached (%)
Housing units in structures - Renters - 2 (%)
Housing units in structures - Renters - 3 or 4 (%)
Housing units in structures - Renters - 5 to 9 (%)
Housing units in structures - Renters - 10 to 19 (%)
Housing units in structures - Renters - 20 to 49 (%)
Housing units in structures - Renters - 50 or more (%)
Housing units in structures - Renters - Mobile home (%)
Housing units in structures - Renters - Boat, RV, van, etc. (%)
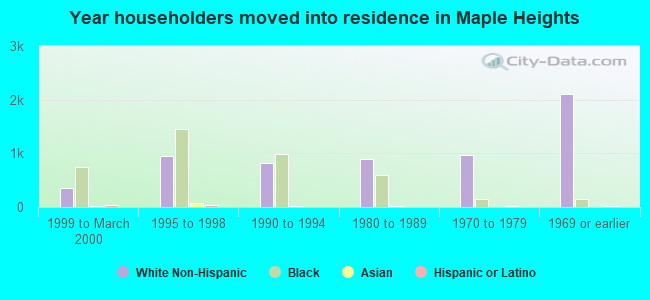
House/condo owner moved in on average (years ago)
Renter moved in on average (years ago)
Year householder moved into unit - Moved in 1999 to March 2000 (%)
Year householder moved into unit - Moved in 1999 to March 2000 (%) - White
Year householder moved into unit - Moved in 1999 to March 2000 (%) - Black or African American
Year householder moved into unit - Moved in 1999 to March 2000 (%) - Asian
Year householder moved into unit - Moved in 1999 to March 2000 (%) - Hispanic or Latino
Year householder moved into unit - Moved in 1999 to March 2000 (%) - American Indian and Alaska Native
Year householder moved into unit - Moved in 1999 to March 2000 (%) - Multirace
Year householder moved into unit - Moved in 1999 to March 2000 (%) - Other Race
Year householder moved into unit - Moved in 1995 to 1998 (%)
Year householder moved into unit - Moved in 1995 to 1998 (%) - White
Year householder moved into unit - Moved in 1995 to 1998 (%) - Black or African American
Year householder moved into unit - Moved in 1995 to 1998 (%) - Asian
Year householder moved into unit - Moved in 1995 to 1998 (%) - Hispanic or Latino
Year householder moved into unit - Moved in 1995 to 1998 (%) - American Indian and Alaska Native
Year householder moved into unit - Moved in 1995 to 1998 (%) - Multirace
Year householder moved into unit - Moved in 1995 to 1998 (%) - Other Race
Year householder moved into unit - Moved in 1990 to 1994 (%)
Year householder moved into unit - Moved in 1990 to 1994 (%) - White
Year householder moved into unit - Moved in 1990 to 1994 (%) - Black or African American
Year householder moved into unit - Moved in 1990 to 1994 (%) - Asian
Year householder moved into unit - Moved in 1990 to 1994 (%) - Hispanic or Latino
Year householder moved into unit - Moved in 1990 to 1994 (%) - American Indian and Alaska Native
Year householder moved into unit - Moved in 1990 to 1994 (%) - Multirace
Year householder moved into unit - Moved in 1990 to 1994 (%) - Other Race
Year householder moved into unit - Moved in 1980 to 1989 (%)
Year householder moved into unit - Moved in 1980 to 1989 (%) - White
Year householder moved into unit - Moved in 1980 to 1989 (%) - Black or African American
Year householder moved into unit - Moved in 1980 to 1989 (%) - Asian
Year householder moved into unit - Moved in 1980 to 1989 (%) - Hispanic or Latino
Year householder moved into unit - Moved in 1980 to 1989 (%) - American Indian and Alaska Native
Year householder moved into unit - Moved in 1980 to 1989 (%) - Multirace
Year householder moved into unit - Moved in 1980 to 1989 (%) - Other Race
Year householder moved into unit - Moved in 1970 to 1979 (%)
Year householder moved into unit - Moved in 1970 to 1979 (%) - White
Year householder moved into unit - Moved in 1970 to 1979 (%) - Black or African American
Year householder moved into unit - Moved in 1970 to 1979 (%) - Asian
Year householder moved into unit - Moved in 1970 to 1979 (%) - Hispanic or Latino
Year householder moved into unit - Moved in 1970 to 1979 (%) - American Indian and Alaska Native
Year householder moved into unit - Moved in 1970 to 1979 (%) - Multirace
Year householder moved into unit - Moved in 1970 to 1979 (%) - Other Race
Year householder moved into unit - Moved in 1969 or earlier (%)
Year householder moved into unit - Moved in 1969 or earlier (%) - White
Year householder moved into unit - Moved in 1969 or earlier (%) - Black or African American
Year householder moved into unit - Moved in 1969 or earlier (%) - Asian
Year householder moved into unit - Moved in 1969 or earlier (%) - Hispanic or Latino
Year householder moved into unit - Moved in 1969 or earlier (%) - American Indian and Alaska Native
Year householder moved into unit - Moved in 1969 or earlier (%) - Multirace
Year householder moved into unit - Moved in 1969 or earlier (%) - Other Race
Housing units lacking complete plumbing facilities (%)
Housing units lacking complete kitchen facilities (%)
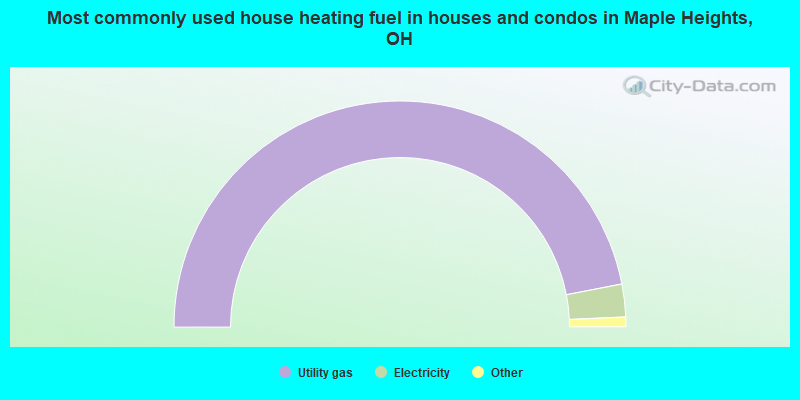
House heating fuel used in houses and condos - Utility gas (%)
House heating fuel used in houses and condos - Bottled, tank, or LP gas (%)
House heating fuel used in houses and condos - Electricity (%)
House heating fuel used in houses and condos - Fuel oil, kerosene, etc. (%)
House heating fuel used in houses and condos - Coal or coke (%)
House heating fuel used in houses and condos - Wood (%)
House heating fuel used in houses and condos - Solar energy (%)
House heating fuel used in houses and condos - Other fuel (%)
House heating fuel used in houses and condos - No fuel used (%)
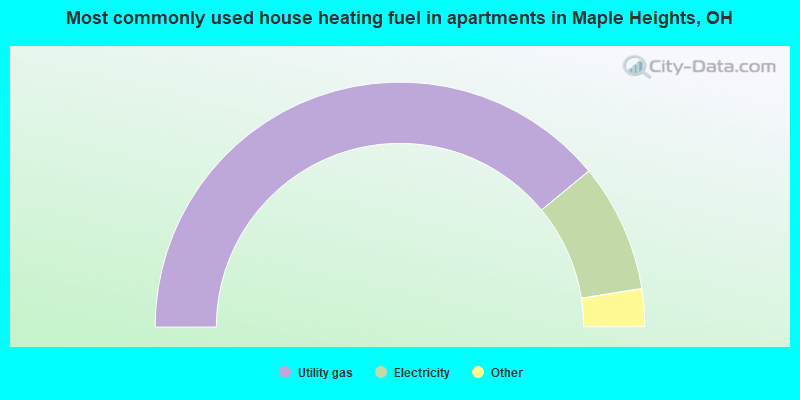
House heating fuel used in apartments - Utility gas (%)
House heating fuel used in apartments - Bottled, tank, or LP gas (%)
House heating fuel used in apartments - Electricity (%)
House heating fuel used in apartments - Fuel oil, kerosene, etc. (%)
House heating fuel used in apartments - Coal or coke (%)
House heating fuel used in apartments - Wood (%)
House heating fuel used in apartments - Solar energy (%)
House heating fuel used in apartments - Other fuel (%)
House heating fuel used in apartments - No fuel used (%)
Median year house/condo built: 1954Median year apartment built: 1954Household type by relationship:
Households: 23,088
Male householders: 3,213 (1,343 living alone ), Female householders: 6,764 (2,689 living alone )2,597 spouses (2,574 opposite-sex spouses ), 499 unmarried partners , (499 opposite-sex unmarried partners ), 7,060 children (6,723 natural , 25 adopted , 311 stepchildren ), 1,440 grandchildren , 223 brothers or sisters , 217 parents , 84 foster children , 349 other relatives , 464 non-relatives In group quarters: 174
Size of family households: 2,811 2-persons , 1,518 3-persons , 870 4-persons , 367 5-persons , 243 6-persons , 14 7-or-more-persons .
Size of nonfamily households: 4,061 1-person , 265 2-persons , 19 3-persons .
1,797 married couples with children. single-parent households (572 men , 2,179 women ).
96.6% of residents of Maple Heights speak English at home. of residents speak Spanish at home (72% speak English very well , 14% speak English well , 15% speak English not well ).of residents speak other Indo-European language at home (69% speak English very well , 29% speak English well , 2% speak English not well ).of residents speak Asian or Pacific Island language at home (100% speak English well ).of residents speak other language at home (90% speak English very well , 10% speak English well ).
Foreign born population: 413 (1.8%)of them are naturalized citizens )
Median number of rooms in houses and condos:
Median number of rooms in apartments
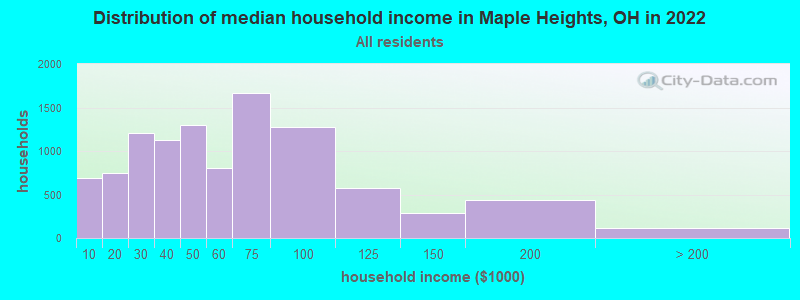
Maple Heights, OH household income distribution 684 Less than $10,000742 $10,000 to $19,9991,210 $20,000 to $29,9991,128 $30,000 to $39,9991,300 $40,000 to $49,999803 $50,000 to $59,9991,661 $60,000 to $74,9991,273 $75,000 to $99,999569 $100,000 to $124,999285 $125,000 to $149,999435 $150,000 to $199,999120 $200,000 or more
Home value of owner - occupied houses in 2022 in Maple Heights, OH 50 Less than $10,00051 $10,000 to $14,99945 $15,000 to $19,99947 $20,000 to $24,99923 $25,000 to $29,99976 $30,000 to $34,99948 $35,000 to $39,999273 $40,000 to $49,999303 $50,000 to $59,999689 $60,000 to $69,999725 $70,000 to $79,999703 $80,000 to $89,999516 $90,000 to $99,9991,363 $100,000 to $124,999392 $125,000 to $149,999101 $150,000 to $174,999131 $175,000 to $199,99920 $200,000 to $249,9993 $250,000 to $299,99970 $300,000 to $399,99915 $500,000 to $749,99914 $750,000 to $999,99910 $1,000,000 to $1,499,999Rent paid by renters in 2022 in Maple Heights, OH 63 $100 to $14913 $150 to $19978 $200 to $24999 $300 to $34969 $450 to $49940 $500 to $54998 $550 to $599156 $600 to $649153 $650 to $699129 $700 to $749209 $750 to $799242 $800 to $899535 $900 to $9991,615 $1,000 to $1,249189 $1,250 to $1,49910 $1,500 to $1,999133 No cash rent
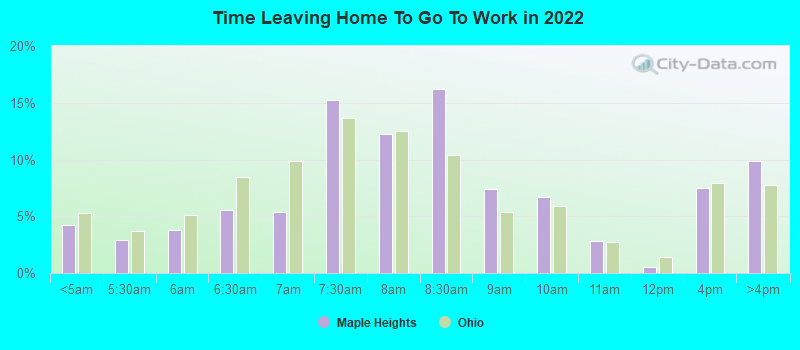
Percentage of workers working in this county: 85.3%Number of people working at home: 834 (8.2% of all workers )
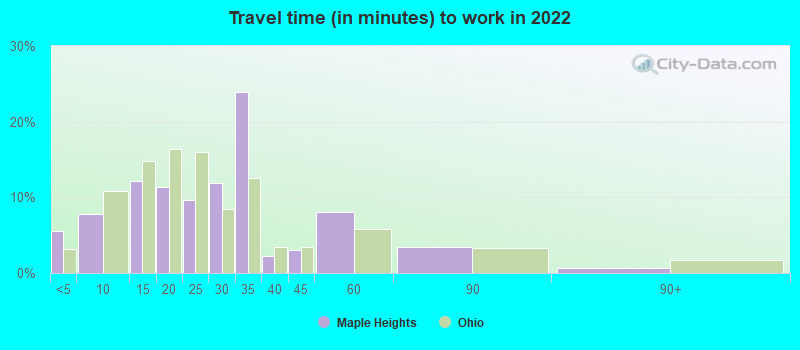
Travel time to work (commute)
Less than 5 minutes: 2425 to 9 minutes: 57610 to 14 minutes: 90215 to 19 minutes: 1,45520 to 24 minutes: 3,01325 to 29 minutes: 81930 to 34 minutes: 1,15135 to 39 minutes: 12940 to 44 minutes: 22245 to 59 minutes: 26760 to 89 minutes: 27890 or more minutes: 50
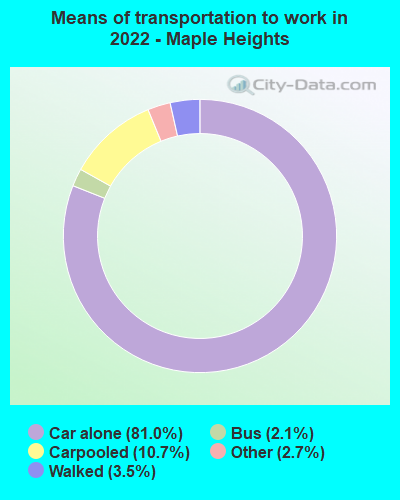
Means of transportation to work:
Drove a car alone: 3,206 (67.5%)Carpooled: 426 (9.0%)Bus : 71 (1.5%)Taxi: 112 (2.4%)Walked: 162 (3.4%)Worked at home: 834 (17.6%)
Unemployment by race in 2022
Unemployment rate for White non-Hispanic residents 3.6% Males2.3% FemalesUnemployment rate for Black residents 11.1% Males5.8% FemalesUnemployment rate for Asian residents 64.3% MalesUnemployment rate for two or more race residents 3.2% Females
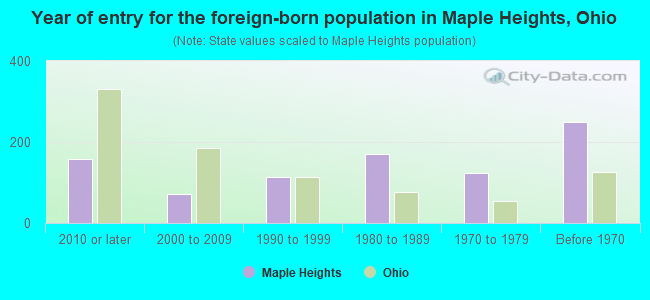
Year of entry for the foreign-born population in Maple Heights, Ohio
159 2010 or later 72 2000 to 2009 114 1990 to 1999 170 1980 to 1989 123 1970 to 1979 249 Before 1970
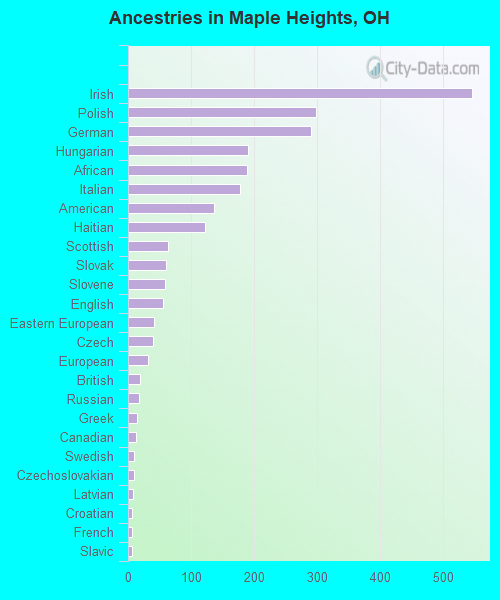
First ancestries reported:
Irish: 545 (3.8%)
Polish: 298 (2.1%)
German: 290 (2.0%)
Hungarian: 190 (1.3%)
African: 188 (1.3%)
Italian: 178 (1.2%)
American: 137 (1.0%)
Haitian: 122 (0.9%)
Scottish: 63 (0.4%)
Slovak: 60 (0.4%)
Slovene: 58 (0.4%)
English: 55 (0.4%)
Eastern European: 42 (0.3%)
Czech: 39 (0.3%)
European: 32 (0.2%)
British: 19 (0.1%)
Russian: 18 (0.1%)
Greek: 14 (0.10%)
Canadian: 12 (0.08%)
Swedish: 10 (0.07%)
Czechoslovakian: 9 (0.06%)
Latvian: 8 (0.06%)
Croatian: 7 (0.05%)
French: 7 (0.05%)
Slavic: 7 (0.05%)
Pennsylvania German: 4 (0.03%)
Arab: 1 (0.01%) Most common places of birth for foreign-born residents (%): India Maple Heights:
18.9% (81)Ohio:
11.6% (66,525)
China, excluding Hong Kong and Taiwan Maple Heights:
15.4% (66)Ohio:
6.2% (35,703)
Peru Maple Heights:
11.0% (47)Ohio:
0.6% (3,210)
Jamaica Maple Heights:
8.2% (35)Ohio:
0.7% (4,187)
Germany Maple Heights:
6.5% (28)Ohio:
2.2% (12,846)
Lebanon Maple Heights:
5.4% (23)Ohio:
0.7% (3,862)
Nigeria Maple Heights:
4.7% (20)Ohio:
1.2% (7,029)
England Maple Heights:
4.4% (19)Ohio:
1.0% (5,979)
Uganda Maple Heights:
4.2% (18)Ohio:
0.2% (875)
Democratic Republic of Congo (Zaire) Maple Heights:
4.2% (18)Ohio:
0.4% (2,154)
Senegal Maple Heights:
3.0% (13)Ohio:
0.5% (3,061)
Other Eastern Africa Maple Heights:
2.6% (11)Ohio:
0.5% (3,042)
Latvia Maple Heights:
2.1% (9)Ohio:
0.1% (493)
Colombia Maple Heights:
2.1% (9)Ohio:
0.8% (4,549)
Hungary Maple Heights:
1.6% (7)Ohio:
0.4% (2,140)
Place of birth for U.S.-born residents:
This state: 19,476Other state: 3,060Northeast: 344Midwest: 183South: 2,003West: 459 90.2% of Maple Heights residents lived in the same house 1 years ago.
Out of people who lived in different houses, 42.1% lived in this county.
Out of people who lived in different counties, 90.2% lived in Ohio.
Maple Heights:
90.2%State average:
87.8%
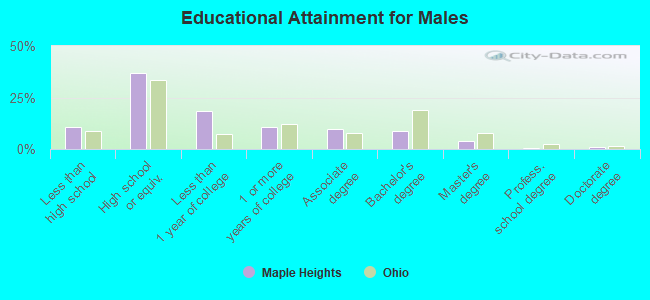
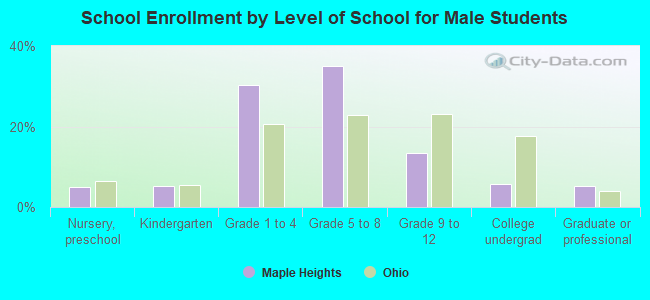
Education attainment for males 25 years and older:
No schooling: 69Nursery to 4th grade: 05th and 6th grade: 157th and 8th grade: 09th grade: 22310th grade: 10311th grade: 13912th grade, no diploma: 120High school graduate (or equivalency): 2,337Less than 1 year of college: 1,162Some college more than 1 year, no degree: 687Associate degree: 626Bachelor's degree: 548Master's degree: 261Professional school degree: 23Doctorate degree: 53
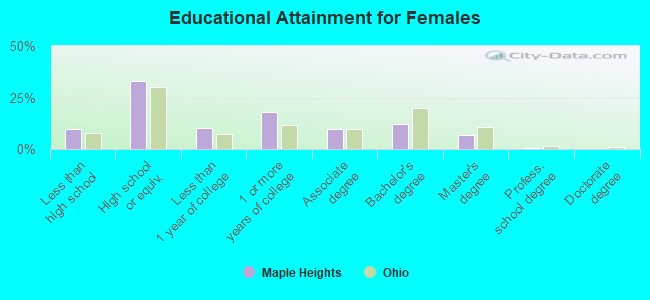
Education attainment for females 25 years and older:
No schooling: 64Nursery to 4th grade: 05th and 6th grade: 07th and 8th grade: 169th grade: 5510th grade: 28111th grade: 20412th grade, no diploma: 256High school graduate (or equivalency): 3,020Less than 1 year of college: 959Some college more than 1 year, no degree: 1,661Associate degree: 913Bachelor's degree: 1,118Master's degree: 630Professional school degree: 34Doctorate degree: 0
Housing units in structures:
One, detached: 9,408One, attached: 159Two: 723 or 4: 1335 to 9: 35210 to 19: 72820 to 49: 8850 or more: 124Mobile homes: 49Housing units lacking complete plumbing facilities in 2022: 0.5%Housing units lacking complete kitchen facilities in 2022: 2.2%House/condo owner moved in on average 18 years ago
Renter moved in on average 5 years ago
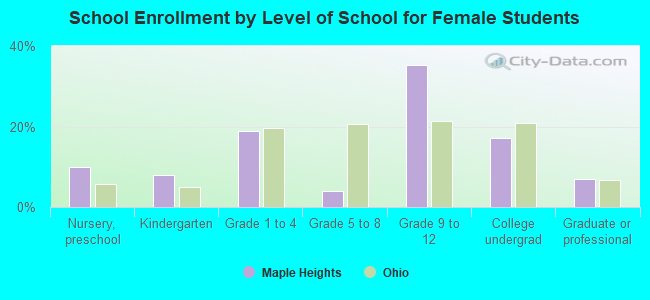
Private vs. public school enrollment:
Students in private schools in grades 1 to 8 (elementary and middle school): 458 Students in private schools in grades 9 to 12 (high school): 361 Students in private undergraduate colleges: 95