McLean, VA (Virginia) Houses and Residents
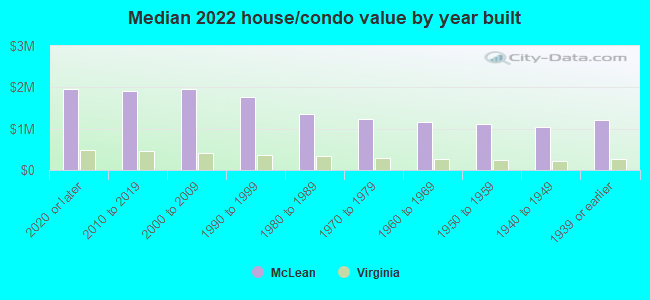
Estimated median house or condo value in 2022: $1,311,091 (it was $384,500 in 2000 )
McLean:
$1,311,091Virginia:
$365,700
Lower value quartile - upper value quartile: $1,036,833 - $1,804,649Mean price in 2022: Detached houses: $1,835,995 Here:
$1,835,995State:
$472,865
Townhouses or other attached units: $1,095,966 Here:
$1,095,966State:
$457,437
In 3-to-4-unit structures: $979,419 Here:
$979,419State:
$252,346
In 5-or-more-unit structures: $690,885 Here:
$690,885State:
$382,551
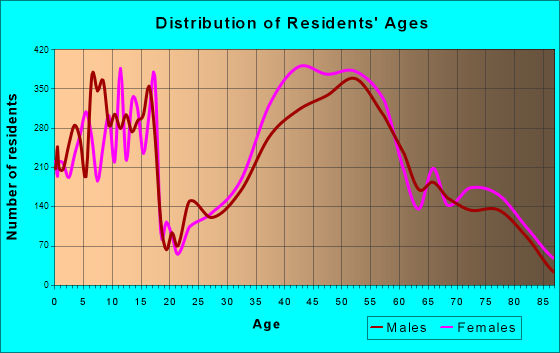
Total population: 48,115 (Urban population: 38,562, Rural population: 441 (all nonfarm) )
Houses: 17,927 (17,117 occupied: 15,084 owner occupied, 2,127 renter occupied )
% of renters here:
12%State:
33%
Housing density: 969 houses/condos per square mile
Median price asked for vacant for-sale houses and condos in 2022: $2,298,789.
Median contract rent in 2022: over $2,000
Median rent asked for vacant for-rent units in 2022: $3,593
Median gross rent in McLean, VA in 2022: over $2,000
Housing units in McLean with a mortgage: 9,821 (1,265 second mortgage, 49 home equity loan, 1,161 both second mortgage and home equity loan )Houses without a mortgage: 190
Median household income for houses/condos with a mortgage: $250,911
Median household income for apartments without a mortgage: $201,910
Median monthly housing costs: $3,599
Data:
Median house or condo value ($)
Median house or condo value ($ change since 2000)
Median house or condo value ($) - White
Median house or condo value ($) - Black or African American
Median house or condo value ($) - Asian
Median house or condo value ($) - Hispanic or Latino
Median house or condo value ($) - American Indian and Alaska Native
Median house or condo value ($) - Multirace
Median house or condo value ($) - Other Race
Median price asked for mobile homes ($)
Household density (households per square mile)
Mean house or condo value by units in structure - 1, detached ($)
Mean house or condo value by units in structure - 1, attached ($)
Mean house or condo value by units in structure - 2 ($)
Mean house or condo value by units in structure by units in structure - 3 or 4 ($)
Mean house or condo value by units in structure - 5 or more ($)
Mean house or condo value by units in structure - Boat, RV, van, etc. ($)
Mean house or condo value by units in structure - Mobile home ($)
Median contract rent ($)
Median contract rent - Lower quartile ($)
Median contract rent - Upper quartile ($)
Median gross rent ($)
Urban houses (%)
Rural houses (%)
Houses occupied (%)
Houses occupied (% change since 2000)
Houses owner occupied (%)
Houses owner occupied (% change since 2000)
Houses renter occupied (%)
Houses renter occupied (% change since 2000)
Vacant housing units - For rent (%)
Vacant housing units - For rent (% change since 2000)
Vacant housing units - For sale only (%)
Vacant housing units - For sale only (% change since 2000)
Vacant housing units - Rented or sold, not occupied (%)
Vacant housing units - Rented or sold, not occupied (% change since 2000)
Vacant housing units - For seasonal, recreational, or occasional use (%)
Vacant housing units - For seasonal, recreational, or occasional use (% change since 2000)
Vacant housing units - For migrant workers (%)
Vacant housing units - For migrant workers (% change since 2000)
Vacant housing units - Other vacant (%)
Vacant housing units - Other vacant (% change since 2000)
Median monthly housing costs ($)
Median household income for houses/condos with a mortgage ($)
Median household income for houses/condos without a mortgage ($)
Median household income ($)
Median household income ($) - White
Median household income ($) - Black or African American
Median household income ($) - Asian
Median household income ($) - Hispanic or Latino
Median household income ($) - American Indian and Alaska Native
Median household income ($) - Multirace
Median household income ($) - Other Race
Mortgage status - with mortgage (%)
Mortgage status - with second mortgage (%)
Mortgage status - with home equity loan (%)
Mortgage status - with both second mortgage and home equity loan (%)
Mortgage status - without a mortgage (%)
Median year house/condo built
Median year apartment built
Household type by relationship - Male householder living alone (%)
Household type by relationship - Male householder not living alone (%)
Household type by relationship - Female householder living alone (%)
Household type by relationship - Female householder not living alone (%)
Household type by relationship - Opposite-Sex spouse (%)
Household type by relationship - Same-Sex spouse (%)
Household type by relationship - Opposite-Sex unmarried partner (%)
Household type by relationship - Same-Sex unmarried partner (%)
Household type by relationship - In group quarters (%)
Size of family households - 2-person household (%)
Size of family households - 3-person household (%)
Size of family households - 4-person household (%)
Size of family households - 5-person household (%)
Size of family households - 6-person household (%)
Size of family households - 7-or-more-person household (%)
Size of nonfamily households - 1-person household (%)
Size of nonfamily households - 2-person household (%)
Size of nonfamily households - 3-person household (%)
Size of nonfamily households - 4-person household (%)
Size of nonfamily households - 5-person household (%)
Size of nonfamily households - 6-person household (%)
Size of nonfamily households - 7-or-moreperson household (%)
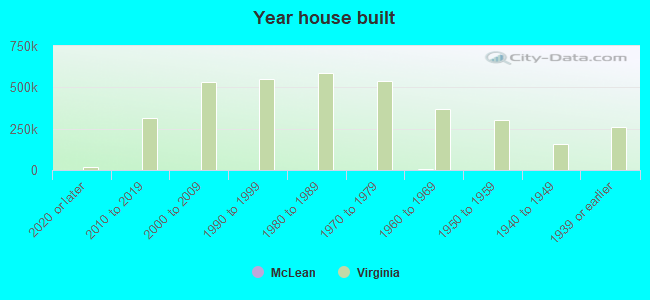
Year house built - Built 2010 or later (%)
Year house built - Built 2000 to 2009 (%)
Year house built - Built 1990 to 1999 (%)
Year house built - Built 1980 to 1989 (%)
Year house built - Built 1970 to 1979 (%)
Year house built - Built 1960 to 1969 (%)
Year house built - Built 1950 to 1959 (%)
Year house built - Built 1940 to 1949 (%)
Year house built - Built 1939 or earlier (%)
Median number of rooms in houses and condos
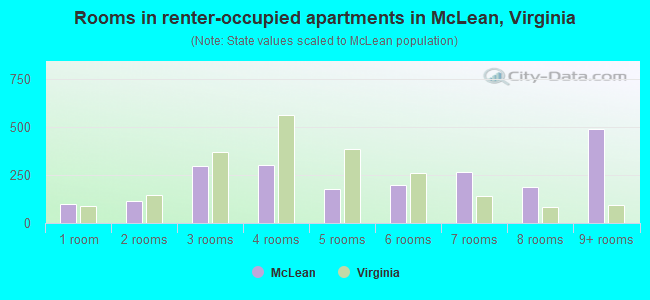
Median number of rooms in apartments
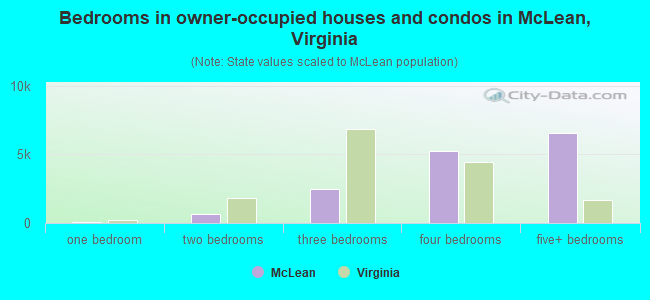
Median number of bedrooms in owner occupied houses
Mean number of bedrooms in owner occupied houses
Median number of bedrooms in renter occupied houses
Mean number of bedrooms in renter occupied houses
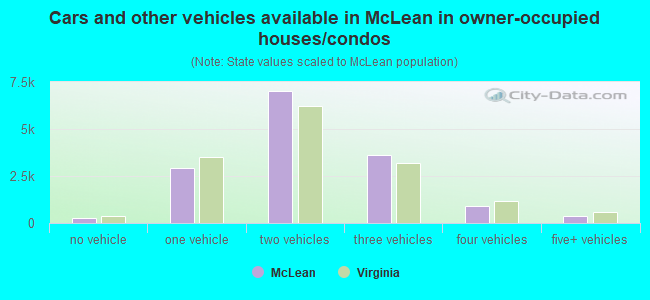
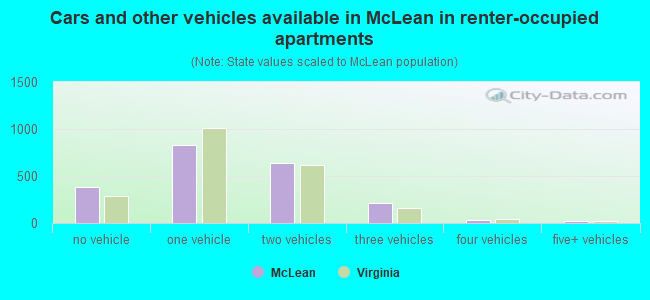
Median number of vehichles in owner occupied houses
Mean number of vehichles in owner occupied houses
Median number of vehichles in renter occupied houses
Mean number of vehichles in renter occupied houses
Rooms in owner-occupied houses - 1 room (%)
Rooms in owner-occupied houses - 2 rooms (%)
Rooms in owner-occupied houses - 3 rooms (%)
Rooms in owner-occupied houses - 4 rooms (%)
Rooms in owner-occupied houses - 5 rooms (%)
Rooms in owner-occupied houses - 6 rooms (%)
Rooms in owner-occupied houses - 7 rooms (%)
Rooms in owner-occupied houses - 8 rooms (%)
Rooms in owner-occupied houses - 9+ rooms (%)
Rooms in renter-occupied houses - 1 room (%)
Rooms in renter-occupied houses - 2 rooms (%)
Rooms in renter-occupied houses - 3 rooms (%)
Rooms in renter-occupied houses - 4 rooms (%)
Rooms in renter-occupied houses - 5 rooms (%)
Rooms in renter-occupied houses - 6 rooms (%)
Rooms in renter-occupied houses - 7 rooms (%)
Rooms in renter-occupied houses - 8 rooms (%)
Rooms in renter-occupied houses - 9+ rooms (%)
Bedrooms in owner-occupied houses - no bedrooms (%)
Bedrooms in owner-occupied houses - 1 bedroom (%)
Bedrooms in owner-occupied houses - 2 bedrooms (%)
Bedrooms in owner-occupied houses - 3 bedrooms (%)
Bedrooms in owner-occupied houses - 4 bedrooms (%)
Bedrooms in owner-occupied houses - 5+ bedrooms (%)
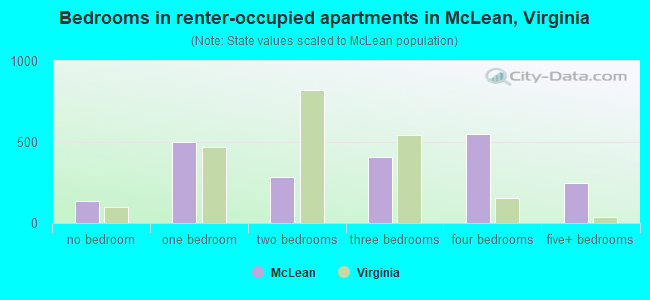
Bedrooms in renter-occupied houses - no bedrooms (%)
Bedrooms in renter-occupied houses - 1 bedroom (%)
Bedrooms in renter-occupied houses - 2 bedrooms (%)
Bedrooms in renter-occupied houses - 3 bedrooms (%)
Bedrooms in renter-occupied houses - 4 bedrooms (%)
Bedrooms in renter-occupied houses - 5+ bedrooms (%)
Vehicles available in owner-occupied houses - no vehicle available (%)
Vehicles available in owner-occupied houses - 1 vehicle available(%)
Vehicles available in owner-occupied houses - 2 Vehicles available (%)
Vehicles available in owner-occupied houses - 3 Vehicles available (%)
Vehicles available in owner-occupied houses - 4 Vehicles available (%)
Vehicles available in owner-occupied houses - 5+ Vehicles available (%)
Vehicles available in renter-occupied houses - no vehicle available (%)
Vehicles available in renter-occupied houses - 1 vehicle available (%)
Vehicles available in renter-occupied houses - 2 Vehicles available (%)
Vehicles available in renter-occupied houses - 3 Vehicles available (%)
Vehicles available in renter-occupied houses - 4 Vehicles available (%)
Vehicles available in renter-occupied houses - 5+ Vehicles available (%)
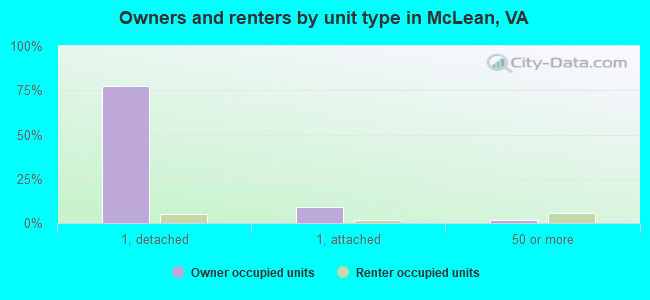
Housing units in structures - 1, detached (%)
Housing units in structures - 1, attached (%)
Housing units in structures - 2 (%)
Housing units in structures - 3 or 4 (%)
Housing units in structures - 5 to 9 (%)
Housing units in structures - 10 to 19 (%)
Housing units in structures - 20 to 49 (%)
Housing units in structures - 50 or more (%)
Housing units in structures - Mobile home (%)
Housing units in structures - Boat, RV, van, etc. (%)
Housing units in structures - Owners - 1, detached (%)
Housing units in structures - Owners - 1, attached (%)
Housing units in structures - Owners - 2 (%)
Housing units in structures - Owners - 3 or 4 (%)
Housing units in structures - Owners - 5 to 9 (%)
Housing units in structures - Owners - 10 to 19 (%)
Housing units in structures - Owners - 20 to 49 (%)
Housing units in structures - Owners - 50 or more (%)
Housing units in structures - Owners - Mobile home (%)
Housing units in structures - Owners - Boat, RV, van, etc. (%)
Housing units in structures - Renters - 1, detached (%)
Housing units in structures - Renters - 1, attached (%)
Housing units in structures - Renters - 2 (%)
Housing units in structures - Renters - 3 or 4 (%)
Housing units in structures - Renters - 5 to 9 (%)
Housing units in structures - Renters - 10 to 19 (%)
Housing units in structures - Renters - 20 to 49 (%)
Housing units in structures - Renters - 50 or more (%)
Housing units in structures - Renters - Mobile home (%)
Housing units in structures - Renters - Boat, RV, van, etc. (%)
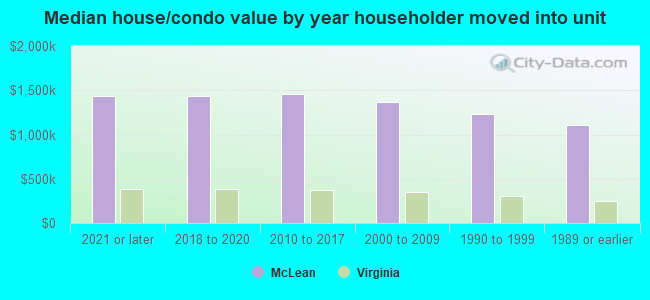
House/condo owner moved in on average (years ago)
Renter moved in on average (years ago)
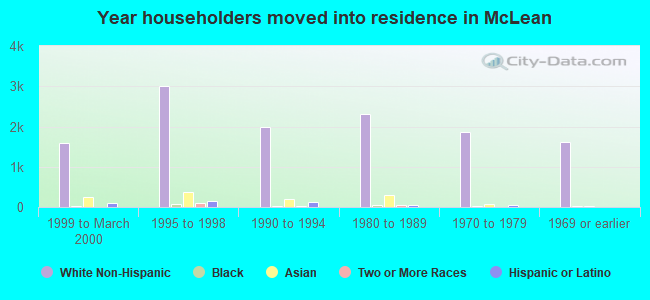
Year householder moved into unit - Moved in 1999 to March 2000 (%)
Year householder moved into unit - Moved in 1999 to March 2000 (%) - White
Year householder moved into unit - Moved in 1999 to March 2000 (%) - Black or African American
Year householder moved into unit - Moved in 1999 to March 2000 (%) - Asian
Year householder moved into unit - Moved in 1999 to March 2000 (%) - Hispanic or Latino
Year householder moved into unit - Moved in 1999 to March 2000 (%) - American Indian and Alaska Native
Year householder moved into unit - Moved in 1999 to March 2000 (%) - Multirace
Year householder moved into unit - Moved in 1999 to March 2000 (%) - Other Race
Year householder moved into unit - Moved in 1995 to 1998 (%)
Year householder moved into unit - Moved in 1995 to 1998 (%) - White
Year householder moved into unit - Moved in 1995 to 1998 (%) - Black or African American
Year householder moved into unit - Moved in 1995 to 1998 (%) - Asian
Year householder moved into unit - Moved in 1995 to 1998 (%) - Hispanic or Latino
Year householder moved into unit - Moved in 1995 to 1998 (%) - American Indian and Alaska Native
Year householder moved into unit - Moved in 1995 to 1998 (%) - Multirace
Year householder moved into unit - Moved in 1995 to 1998 (%) - Other Race
Year householder moved into unit - Moved in 1990 to 1994 (%)
Year householder moved into unit - Moved in 1990 to 1994 (%) - White
Year householder moved into unit - Moved in 1990 to 1994 (%) - Black or African American
Year householder moved into unit - Moved in 1990 to 1994 (%) - Asian
Year householder moved into unit - Moved in 1990 to 1994 (%) - Hispanic or Latino
Year householder moved into unit - Moved in 1990 to 1994 (%) - American Indian and Alaska Native
Year householder moved into unit - Moved in 1990 to 1994 (%) - Multirace
Year householder moved into unit - Moved in 1990 to 1994 (%) - Other Race
Year householder moved into unit - Moved in 1980 to 1989 (%)
Year householder moved into unit - Moved in 1980 to 1989 (%) - White
Year householder moved into unit - Moved in 1980 to 1989 (%) - Black or African American
Year householder moved into unit - Moved in 1980 to 1989 (%) - Asian
Year householder moved into unit - Moved in 1980 to 1989 (%) - Hispanic or Latino
Year householder moved into unit - Moved in 1980 to 1989 (%) - American Indian and Alaska Native
Year householder moved into unit - Moved in 1980 to 1989 (%) - Multirace
Year householder moved into unit - Moved in 1980 to 1989 (%) - Other Race
Year householder moved into unit - Moved in 1970 to 1979 (%)
Year householder moved into unit - Moved in 1970 to 1979 (%) - White
Year householder moved into unit - Moved in 1970 to 1979 (%) - Black or African American
Year householder moved into unit - Moved in 1970 to 1979 (%) - Asian
Year householder moved into unit - Moved in 1970 to 1979 (%) - Hispanic or Latino
Year householder moved into unit - Moved in 1970 to 1979 (%) - American Indian and Alaska Native
Year householder moved into unit - Moved in 1970 to 1979 (%) - Multirace
Year householder moved into unit - Moved in 1970 to 1979 (%) - Other Race
Year householder moved into unit - Moved in 1969 or earlier (%)
Year householder moved into unit - Moved in 1969 or earlier (%) - White
Year householder moved into unit - Moved in 1969 or earlier (%) - Black or African American
Year householder moved into unit - Moved in 1969 or earlier (%) - Asian
Year householder moved into unit - Moved in 1969 or earlier (%) - Hispanic or Latino
Year householder moved into unit - Moved in 1969 or earlier (%) - American Indian and Alaska Native
Year householder moved into unit - Moved in 1969 or earlier (%) - Multirace
Year householder moved into unit - Moved in 1969 or earlier (%) - Other Race
Housing units lacking complete plumbing facilities (%)
Housing units lacking complete kitchen facilities (%)
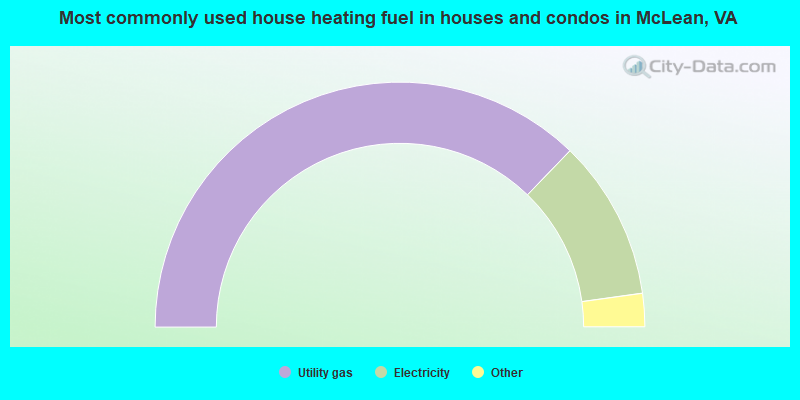
House heating fuel used in houses and condos - Utility gas (%)
House heating fuel used in houses and condos - Bottled, tank, or LP gas (%)
House heating fuel used in houses and condos - Electricity (%)
House heating fuel used in houses and condos - Fuel oil, kerosene, etc. (%)
House heating fuel used in houses and condos - Coal or coke (%)
House heating fuel used in houses and condos - Wood (%)
House heating fuel used in houses and condos - Solar energy (%)
House heating fuel used in houses and condos - Other fuel (%)
House heating fuel used in houses and condos - No fuel used (%)
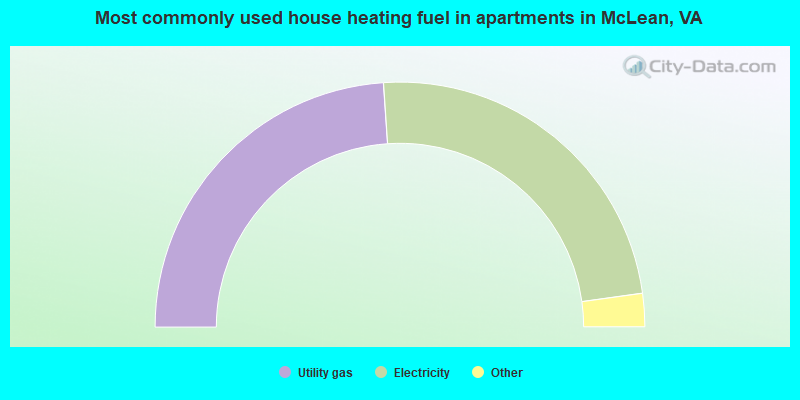
House heating fuel used in apartments - Utility gas (%)
House heating fuel used in apartments - Bottled, tank, or LP gas (%)
House heating fuel used in apartments - Electricity (%)
House heating fuel used in apartments - Fuel oil, kerosene, etc. (%)
House heating fuel used in apartments - Coal or coke (%)
House heating fuel used in apartments - Wood (%)
House heating fuel used in apartments - Solar energy (%)
House heating fuel used in apartments - Other fuel (%)
House heating fuel used in apartments - No fuel used (%)
Latest news about housing in McLean, VA collected exclusively by city-data.com from local newspapers, TV, and radio stations
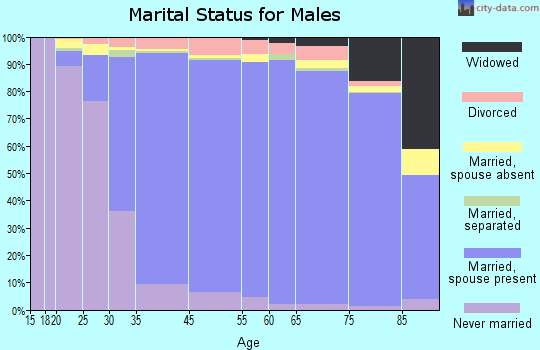
Median year house/condo built: 1976Median year apartment built: 1977Household type by relationship:
Households: 49,282
Male householders: 9,268 (1,052 living alone ), Female householders: 7,631 (1,954 living alone )12,008 spouses (11,940 opposite-sex spouses ), 412 unmarried partners , (360 opposite-sex unmarried partners ), 17,210 children (16,556 natural , 470 adopted , 183 stepchildren ), 320 grandchildren , 170 brothers or sisters , 799 parents , 0 foster children , 377 other relatives , 831 non-relatives In group quarters: 250
Size of family households: 5,209 2-persons , 3,187 3-persons , 3,309 4-persons , 1,405 5-persons , 411 6-persons , 120 7-or-more-persons .
Size of nonfamily households: 3,102 1-person , 358 2-persons , 32 3-persons .
10,690 married couples with children. single-parent households (526 men , 820 women ).
74.5% of residents of McLean speak English at home. of residents speak Spanish at home (82% speak English very well , 8% speak English well , 10% speak English not well , 1% don't speak English at all ).of residents speak other Indo-European language at home (86% speak English very well , 10% speak English well , 3% speak English not well , 1% don't speak English at all ).of residents speak Asian or Pacific Island language at home (70% speak English very well , 19% speak English well , 8% speak English not well , 3% don't speak English at all ).of residents speak other language at home (85% speak English very well , 14% speak English well , 1% speak English not well ).
Foreign born population: 11,642 (23.6%)of them are naturalized citizens )
Median number of rooms in houses and condos:
Median number of rooms in apartments
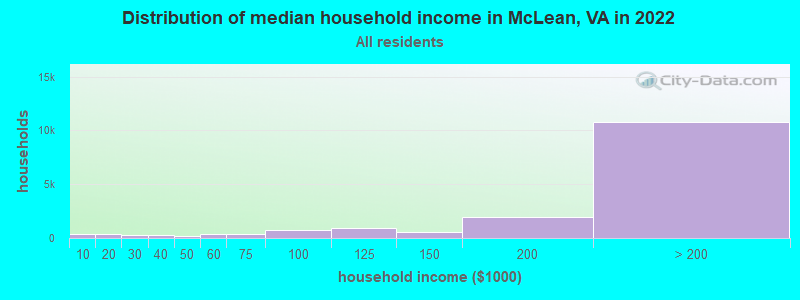
McLean, VA household income distribution 406 Less than $10,000407 $10,000 to $19,999318 $20,000 to $29,999307 $30,000 to $39,999165 $40,000 to $49,999384 $50,000 to $59,999337 $60,000 to $74,999726 $75,000 to $99,999913 $100,000 to $124,999600 $125,000 to $149,9991,931 $150,000 to $199,99910,789 $200,000 or more
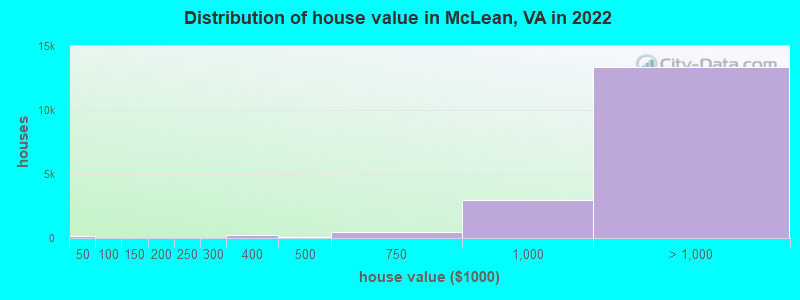
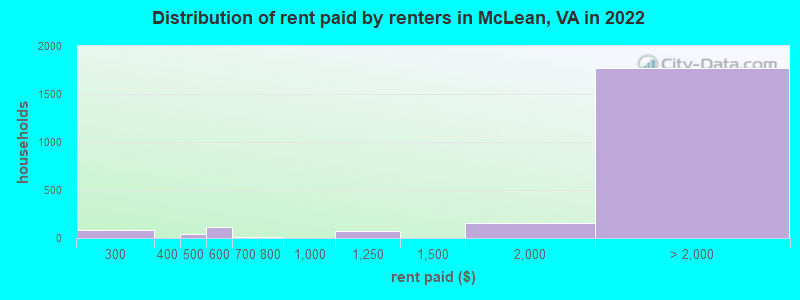
Home value of owner - occupied houses in 2022 in McLean, VA 177 Less than $10,0005 $15,000 to $19,99910 $100,000 to $124,9994 $125,000 to $149,9996 $150,000 to $174,99920 $175,000 to $199,99911 $200,000 to $249,99912 $250,000 to $299,999243 $300,000 to $399,999103 $400,000 to $499,999499 $500,000 to $749,9992,939 $750,000 to $999,9996,699 $1,000,000 to $1,499,9993,078 $1,500,000 to $1,999,9993,591 $2,000,000 or moreRent paid by renters in 2022 in McLean, VA 3 Less than $1007 $150 to $19914 $200 to $24969 $250 to $2994 $400 to $44942 $450 to $499107 $500 to $5497 $550 to $59911 $650 to $69910 $750 to $79973 $1,000 to $1,249155 $1,500 to $1,999209 $2,000 to $2,499161 $2,500 to $2,999227 $3,000 to $3,499741 $3,500 or more427 No cash rent
Percentage of workers working in this county: 68.3%Number of people working at home: 9,774 (40.7% of all workers )
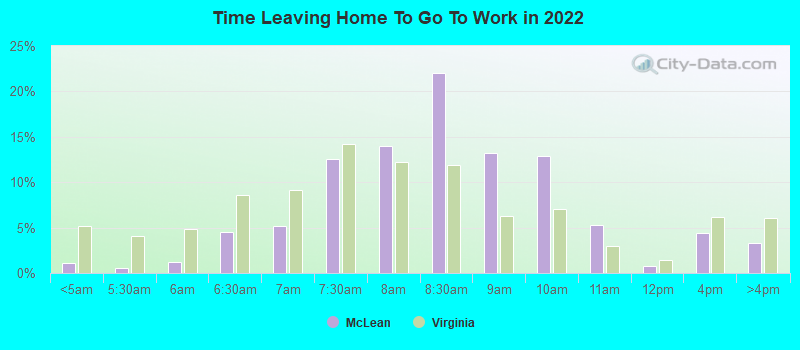
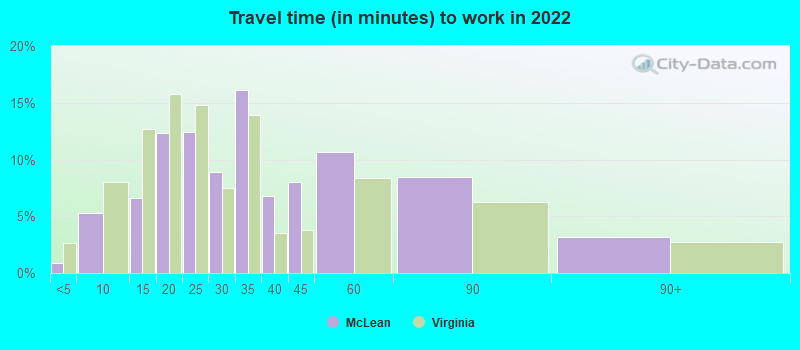
Travel time to work (commute)
Less than 5 minutes: 2585 to 9 minutes: 99010 to 14 minutes: 1,21515 to 19 minutes: 2,20920 to 24 minutes: 2,81825 to 29 minutes: 1,53430 to 34 minutes: 2,87635 to 39 minutes: 68840 to 44 minutes: 77445 to 59 minutes: 1,26560 to 89 minutes: 56890 or more minutes: 163
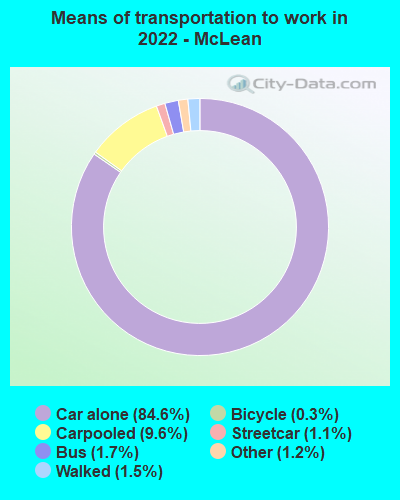
Means of transportation to work:
Drove a car alone: 17,784 (58.7%)Carpooled: 2,067 (6.8%)Bus : 246 (0.8%)Subway or elevated rail : 203 (0.7%)Taxi: 350 (1.2%)Bicycle: 40 (0.1%)Walked: 351 (1.2%)Worked at home: 9,774 (32.3%)
Unemployment by race in 2022
Unemployment rate for White non-Hispanic residents 2.4% Males1.0% FemalesUnemployment rate for Black residents 2.1% Males2.8% FemalesUnemployment rate for American Indian and Alaska Native residents 6.7% FemalesUnemployment rate for Asian residents 1.0% Males1.5% FemalesUnemployment rate for other race residents 11.9% FemalesUnemployment rate for two or more race residents 0.9% Males0.1% FemalesUnemployment rate for Hispanic or Latino residents 2.0% Males2.7% Females
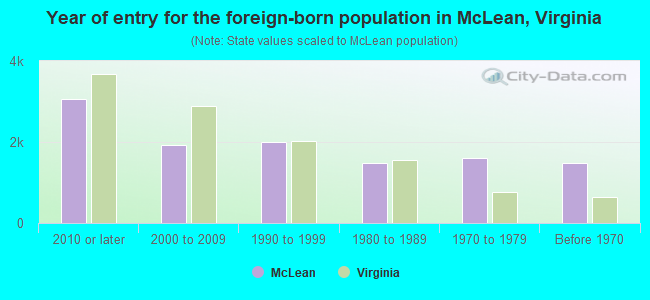
Year of entry for the foreign-born population in McLean, Virginia
3,056 2010 or later 1,934 2000 to 2009 1,993 1990 to 1999 1,470 1980 to 1989 1,611 1970 to 1979 1,492 Before 1970
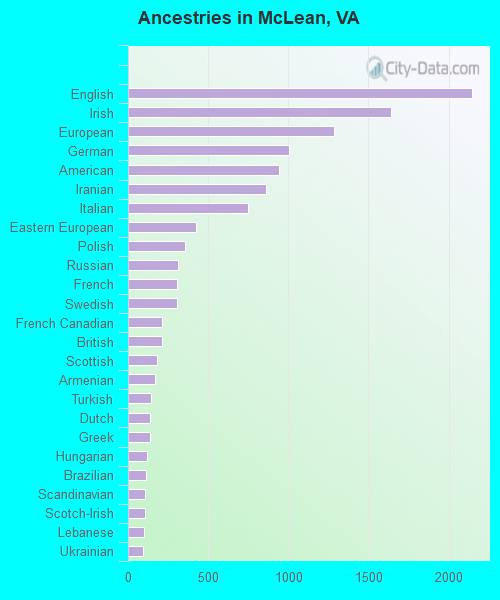
First ancestries reported:
English: 2,145 (8.5%)
Irish: 1,642 (6.5%)
European: 1,285 (5.1%)
German: 1,005 (4.0%)
American: 940 (3.7%)
Iranian: 862 (3.4%)
Italian: 748 (3.0%)
Eastern European: 427 (1.7%)
Polish: 354 (1.4%)
Russian: 315 (1.3%)
French: 308 (1.2%)
Swedish: 304 (1.2%)
French Canadian: 211 (0.8%)
British: 210 (0.8%)
Scottish: 183 (0.7%)
Armenian: 168 (0.7%)
Turkish: 143 (0.6%)
Dutch: 140 (0.6%)
Greek: 136 (0.5%)
Hungarian: 119 (0.5%)
Brazilian: 111 (0.4%)
Scandinavian: 108 (0.4%)
Scotch-Irish: 104 (0.4%)
Lebanese: 98 (0.4%)
Ukrainian: 94 (0.4%)
Syrian: 80 (0.3%)
Ethiopian: 77 (0.3%)
Danish: 75 (0.3%)
Palestinian: 73 (0.3%)
Northern European: 73 (0.3%)
Serbian: 67 (0.3%)
African: 62 (0.2%)
Iraqi: 50 (0.2%)
Romanian: 50 (0.2%)
Arab: 46 (0.2%)
Egyptian: 45 (0.2%)
Belgian: 45 (0.2%)
Kenyan: 40 (0.2%)
Austrian: 37 (0.1%)
Australian: 34 (0.1%)
Welsh: 34 (0.1%)
Slovak: 32 (0.1%)
Czech: 32 (0.1%)
Czechoslovakian: 29 (0.1%)
Canadian: 24 (0.10%)
Norwegian: 24 (0.10%)
Portuguese: 21 (0.08%)
Estonian: 19 (0.08%)
Lithuanian: 17 (0.07%)
Carpatho Rusyn: 14 (0.06%)
Moroccan: 14 (0.06%)
Jordanian: 13 (0.05%)
Guyanese: 12 (0.05%)
Croatian: 11 (0.04%)
Pennsylvania German: 9 (0.04%)
Latvian: 6 (0.02%)
Swiss: 5 (0.02%)
Israeli: 5 (0.02%)
Haitian: 2 (0.01%)
Most common places of birth for foreign-born residents (%): China, excluding Hong Kong and Taiwan McLean:
19.7% (2,295)Virginia:
3.9% (42,989)
Korea McLean:
10.6% (1,230)Virginia:
4.9% (52,857)
India McLean:
8.5% (993)Virginia:
9.0% (97,830)
Iran McLean:
4.9% (567)Virginia:
1.3% (14,417)
Taiwan McLean:
4.8% (555)Virginia:
0.6% (7,042)
United Kingdom, excluding England and Scotland McLean:
3.5% (402)Virginia:
0.8% (8,513)
Canada McLean:
3.4% (392)Virginia:
1.2% (12,984)
Russia McLean:
2.9% (335)Virginia:
0.9% (9,440)
Vietnam McLean:
2.6% (297)Virginia:
4.2% (45,750)
Philippines McLean:
2.1% (249)Virginia:
4.8% (52,629)
Germany McLean:
1.9% (226)Virginia:
1.7% (18,227)
Brazil McLean:
1.9% (223)Virginia:
0.7% (8,081)
France McLean:
1.9% (217)Virginia:
0.5% (5,058)
Japan McLean:
1.7% (195)Virginia:
0.8% (8,805)
Mexico McLean:
1.6% (185)Virginia:
5.3% (57,498)
Australia McLean:
1.5% (180)Virginia:
0.2% (2,350)
Place of birth for U.S.-born residents:
This state: 10,623Other state: 25,618Northeast: 8,494Midwest: 3,640South: 10,526West: 2,974 88.3% of McLean residents lived in the same house 1 years ago.
Out of people who lived in different houses, 29.7% lived in this county.
Out of people who lived in different counties, 37.7% lived in Virginia.
McLean:
88.3%State average:
86.6%
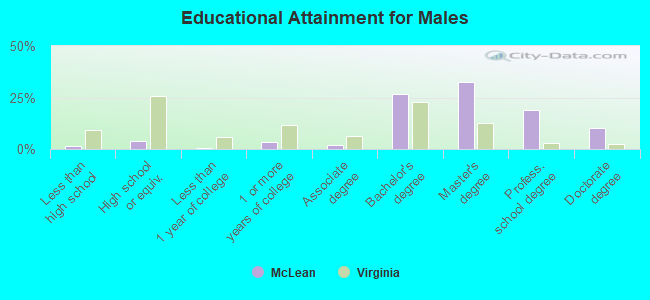
Education attainment for males 25 years and older:
No schooling: 12Nursery to 4th grade: 05th and 6th grade: 197th and 8th grade: 109th grade: 610th grade: 3511th grade: 2412th grade, no diploma: 142High school graduate (or equivalency): 637Less than 1 year of college: 89Some college more than 1 year, no degree: 565Associate degree: 324Bachelor's degree: 4,457Master's degree: 5,387Professional school degree: 3,150Doctorate degree: 1,707
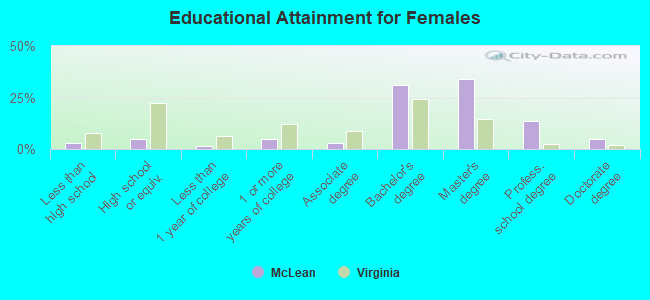
Education attainment for females 25 years and older:
No schooling: 102Nursery to 4th grade: 05th and 6th grade: 797th and 8th grade: 149th grade: 3210th grade: 8611th grade: 9712th grade, no diploma: 93High school graduate (or equivalency): 875Less than 1 year of college: 230Some college more than 1 year, no degree: 829Associate degree: 499Bachelor's degree: 5,389Master's degree: 5,913Professional school degree: 2,335Doctorate degree: 860
Housing units in structures:
One, detached: 14,364One, attached: 1,879Two: 273 or 4: 245 to 9: 7210 to 19: 9320 to 49: 4250 or more: 1,423Housing units lacking complete plumbing facilities in 2022: 0.6%Housing units lacking complete kitchen facilities in 2022: 0.6%House/condo owner moved in on average 11 years ago
Renter moved in on average 3 years ago
Private vs. public school enrollment:
Students in private schools in grades 1 to 8 (elementary and middle school): 1,187 Students in private schools in grades 9 to 12 (high school): 927 Students in private undergraduate colleges: 565