Miami Beach, FL (Florida) Houses and Residents
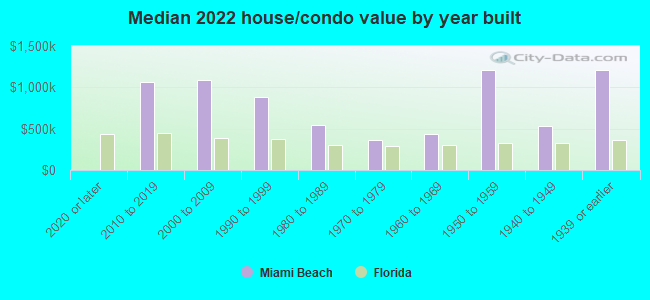
| Miami Beach: | $712,200 |
| Florida: | $354,100 |
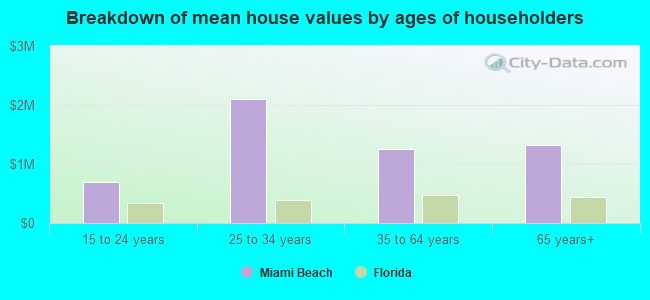
Mean price in 2022:
Detached houses: $2,812,546
Here: $2,812,546 State: $500,941 Townhouses or other attached units: $2,040,574
Here: $2,040,574 State: $370,869 In 2-unit structures: $1,486,910
Here: $1,486,910 State: $423,188 In 3-to-4-unit structures: $824,010
Here: $824,010 State: $309,944 In 5-or-more-unit structures: $924,265
Here: $924,265 State: $447,145 Mobile homes: $242,619
Here: $242,619 State: $113,202
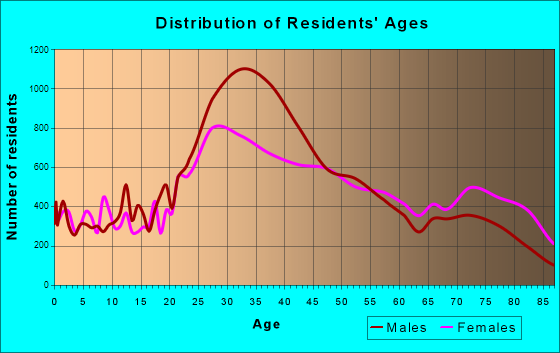
Total population: 91,732 (Urban population: 88,061, Rural population: 0)
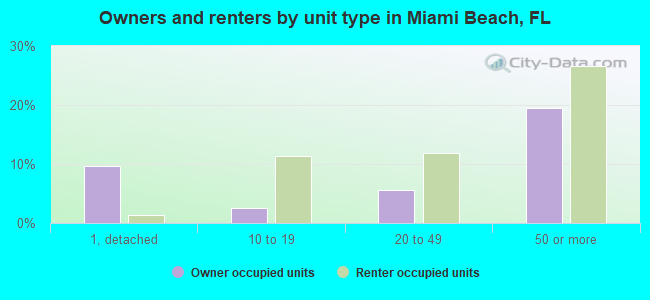
Houses: 62,596 (41,597 occupied: 16,475 owner occupied, 25,122 renter occupied)
| % of renters here: | 60% |
| State: | 33% |
Housing density: 8,900 houses/condos per square mile
Median price asked for vacant for-sale houses and condos in 2022: $609,950.
Median contract rent in 2022: $1,625 (lower quartile is $1,248, upper quartile is over $2,000)
Median rent asked for vacant for-rent units in 2022: $3,275
Median gross rent in Miami Beach, FL in 2022: $1,684
Housing units in Miami Beach with a mortgage: 7,469 (744 second mortgage, 41 home equity loan, 635 both second mortgage and home equity loan)
Houses without a mortgage: 165
Median household income for houses/condos with a mortgage: $162,034
Median household income for apartments without a mortgage: $99,222
Median monthly housing costs: $1,735
Compare current foreclosures in Miami Beach, FL:
| Photo | Address | Area | Beds / Baths | Price | Details |
|---|---|---|---|---|---|

|
#1
Lincoln Rd # 601
Miami Beach, FL 33139
|
- sq. feet
|
1 baths 1 beds |
$244,900
|
show details |

|
#2
Lenox Ave Apt 17
Miami Beach, FL 33139
|
569 sq. feet
|
1 baths 1 beds |
show details | |

|
#3
Carlyle Ave
Miami Beach, FL 33141
|
3,183 sq. feet
|
3 baths 4 beds |
show details | |

|
#4
71st St
Miami Beach, FL 33141
|
1,612 sq. feet
|
2 baths 2 beds |
show details | |

|
#5
79th Ter
Miami Beach, FL 33141
|
1,946 sq. feet
|
2 baths 4 beds |
show details | |

|
#6
N Shore Dr
Miami Beach, FL 33141
|
2,066 sq. feet
|
2 baths 3 beds |
show details | |

|
#7
Lagorce Dr
Miami Beach, FL 33140
|
2,397 sq. feet
|
4 baths 5 beds |
show details | |

|
#8
Beachview Dr
Miami Beach, FL 33141
|
2,838 sq. feet
|
2 baths 3 beds |
show details | |

|
#9
Bayside Ln
Miami Beach, FL 33141
|
2,544 sq. feet
|
3 baths 3 beds |
show details | |

|
#10
W 49th St
Miami Beach, FL 33140
|
1,517 sq. feet
|
1 baths 2 beds |
show details |
| Photo | Address | Area | Beds / Baths | Price | Details |
|---|---|---|---|---|---|

|
#11
West 810
Miami Beach, FL 33139
|
- sq. feet
|
1 baths 1 beds |
show details | |

|
#12
N Meridian Ave # Phl10
Miami Beach, FL 33140
|
3,069 sq. feet
|
2 baths 4 beds |
show details | |

|
#13
W Treasure Dr
Miami Beach, FL 33141
|
1,958 sq. feet
|
2 baths 3 beds |
show details | |

|
#14
88th St
Miami Beach, FL 33154
|
1,658 sq. feet
|
2 baths 3 beds |
show details | |

|
#15
W Bay Harbor Dr
Miami Beach, FL 33154
|
3,323 sq. feet
|
4 baths 6 beds |
show details | |

|
#16
Trouville Esplanade
Miami Beach, FL 33141
|
1,506 sq. feet
|
2 baths 3 beds |
show details | |

|
#17
S Shore D 2
Miami Beach, FL 33141
|
- sq. feet
|
1 baths 1 beds |
show details | |

|
#18
N Shore Dr
Miami Beach, FL 33141
|
1,789 sq. feet
|
2 baths 3 beds |
show details | |

|
#19
E Treasure Dr Apt 3j
Miami Beach, FL 33141
|
- sq. feet
|
2 baths 2 beds |
show details | |

|
#20
Lincoln Rd # 1201
Miami Beach, FL 33139
|
- sq. feet
|
1 baths 1 beds |
show details |
| Photo | Address | Area | Beds / Baths | Price | Details |
|---|---|---|---|---|---|

|
#21
Marseille Dr Apt 17
Miami Beach, FL 33141
|
- sq. feet
|
1 baths 1 beds |
show details | |

|
#22
Collins Ave Apt 11g
Miami Beach, FL 33140
|
- sq. feet
|
2 baths 2 beds |
show details | |

|
#23
Meridian Ave Apt 3
Miami Beach, FL 33139
|
- sq. feet
|
1 baths 1 beds |
show details | |

|
#24
93rd St Apt 103
Miami Beach, FL 33154
|
- sq. feet
|
1 baths 1 beds |
show details | |

|
#25
Flamingo Dr Apt 303
Miami Beach, FL 33140
|
- sq. feet
|
2 baths 1 beds |
show details | |

|
#26
S Shore Dr Apt 4a
Miami Beach, FL 33141
|
- sq. feet
|
2 baths 2 beds |
show details | |

|
#27
Carlyle Ave
Miami Beach, FL 33141
|
- sq. feet
|
3 baths 4 beds |
show details | |

|
#28
Lincoln Rd # 727
Miami Beach, FL 33139
|
- sq. feet
|
1 baths 1 beds |
show details | |

|
#29
S Shore Dr Apt 304
Miami Beach, FL 33141
|
- sq. feet
|
2 baths 2 beds |
show details | |

|
#30
Crespi Blvd Apt 6
Miami Beach, FL 33141
|
- sq. feet
|
1 baths 1 beds |
show details |
| Photo | Address | Area | Beds / Baths | Price | Details |
|---|---|---|---|---|---|

|
#31
Abbott Ave Apt 801
Miami Beach, FL 33141
|
- sq. feet
|
2 baths 2 beds |
show details | |

|
#32
75th St Apt 3
Miami Beach, FL 33141
|
- sq. feet
|
1 baths 1 beds |
show details | |

|
#33
Collins Ave Apt 209
Miami Beach, FL 33139
|
- sq. feet
|
1 baths 1 beds |
show details | |

|
#34
Collins Ave Apt 412
Miami Beach, FL 33154
|
- sq. feet
|
2 baths 2 beds |
show details | |

|
#35
Tatum Waterway Dr Apt 4c
Miami Beach, FL 33141
|
- sq. feet
|
1 baths 1 beds |
show details | |

|
#36
Collins Ave Apt 1510
Miami Beach, FL 33141
|
- sq. feet
|
1 baths 1 beds |
show details | |

|
#37
E Bay Harbor Dr # 70a
Miami Beach, FL 33154
|
- sq. feet
|
1 baths 2 beds |
show details | |

|
#38
Euclid Ave Apt 112
Miami Beach, FL 33139
|
- sq. feet
|
2 baths 2 beds |
show details | |

|
#39
79th Street Cswy Apt 15g
Miami Beach, FL 33141
|
- sq. feet
|
1 baths 1 beds |
show details | |

|
#40
Meridian Ave Apt 102
Miami Beach, FL 33139
|
- sq. feet
|
1 baths 1 beds |
show details |
| Photo | Address | Area | Beds / Baths | Price | Details |
|---|---|---|---|---|---|

|
#41
84th St
Miami Beach, FL 33141
|
3,890 sq. feet
|
8 baths - beds |
show details | |

|
#42
W Bay Harbor Dr Apt 5d
Miami Beach, FL 33154
|
- sq. feet
|
1 baths 1 beds |
show details | |

|
#43
Collins Ave Apt 800
Miami Beach, FL 33140
|
- sq. feet
|
5 baths 4 beds |
show details | |

|
#44
Sheridan Ave Apt 6
Miami Beach, FL 33140
|
- sq. feet
|
1 baths 2 beds |
show details | |

|
#45
N Hibiscus Dr
Miami Beach, FL 33139
|
- sq. feet
|
2 baths 3 beds |
show details | |

|
#46
11th St Apt 6
Miami Beach, FL 33139
|
- sq. feet
|
1 baths 1 beds |
show details | |

|
#47
Royal Palm Ave
Miami Beach, FL 33140
|
- sq. feet
|
3 baths 4 beds |
show details | |

|
#48
Bay Dr Apt 30
Miami Beach, FL 33141
|
- sq. feet
|
1 baths 2 beds |
show details | |

|
#49
Collins Ave Apt 4408
Miami Beach, FL 33141
|
- sq. feet
|
2 baths 2 beds |
show details | |

|
Check over 1 million property listings on Foreclosure.com!
|
browse all offers | |||


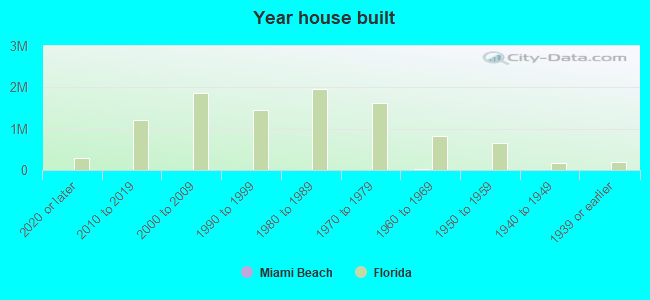
Median year apartment built: 1968
Household type by relationship:
Households: 80,027- Male householders: 24,743 (12,528 living alone), Female householders: 16,854 (8,227 living alone)
11,932 spouses (11,362 opposite-sex spouses), 3,319 unmarried partners, (2,934 opposite-sex unmarried partners), 14,211 children (13,796 natural, 23 adopted, 392 stepchildren), 462 grandchildren, 1,193 brothers or sisters, 1,212 parents, 339 foster children, 2,184 other relatives, 2,951 non-relatives
- In group quarters: 627
Size of family households: 9,848 2-persons, 4,500 3-persons, 2,766 4-persons, 880 5-persons, 107 6-persons, 105 7-or-more-persons.
Size of nonfamily households: 20,783 1-person, 4,211 2-persons, 294 3-persons, 121 4-persons.
6,701 married couples with children.
4,007 single-parent households (1,709 men, 2,298 women).
31.2% of residents of Miami Beach speak English at home.
55.4% of residents speak Spanish at home (53% speak English very well, 19% speak English well, 17% speak English not well, 11% don't speak English at all).
10.9% of residents speak other Indo-European language at home (74% speak English very well, 21% speak English well, 4% speak English not well, 1% don't speak English at all).
1.7% of residents speak Asian or Pacific Island language at home (79% speak English very well, 13% speak English well, 7% speak English not well, 1% don't speak English at all).
1.1% of residents speak other language at home (86% speak English very well, 12% speak English well, 1% speak English not well, 1% don't speak English at all).
Foreign born population: 38,558 (48.2%)
(51.9% of them are naturalized citizens)
| Here: | 4.2 |
| State: | 5.9 |
| Here: | 2.4 |
| State: | 4.2 |
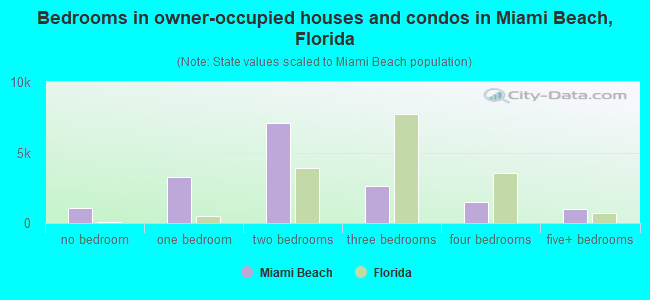
- Bedrooms in owner-occupied houses and condos in Miami Beach, Florida
- 1,041no bedroom
- 3,2421 bedroom
- 7,1232 bedrooms
- 2,6273 bedrooms
- 1,4824 bedrooms
- 9605+ bedrooms
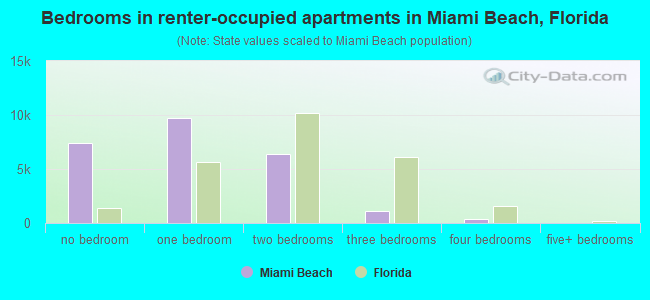
- Bedrooms in renter-occupied apartments in Miami Beach, Florida
- 7,433no bedroom
- 9,7611 bedroom
- 6,3492 bedrooms
- 1,1473 bedrooms
- 4054 bedrooms
- 275+ bedrooms
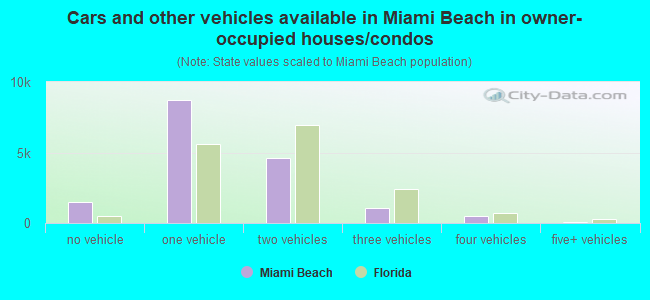
- Cars and other vehicles available in Miami Beach in owner-occupied houses/condos
- 1,517no vehicle
- 8,6901 vehicle
- 4,6312 vehicles
- 1,0553 vehicles
- 5264 vehicles
- 565+ vehicles
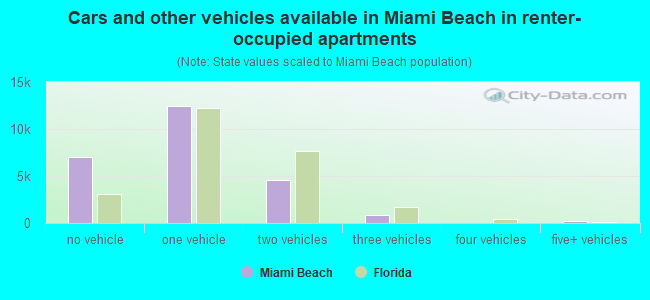
- Cars and other vehicles available in Miami Beach in renter-occupied apartments
- 7,061no vehicle
- 12,4401 vehicle
- 4,6062 vehicles
- 8363 vehicles
- 04 vehicles
- 1795+ vehicles
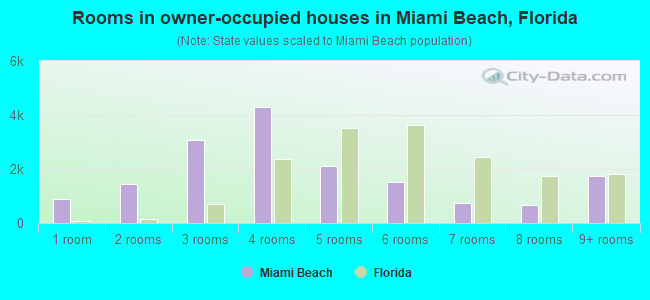
- Rooms in owner-occupied houses in Miami Beach, Florida
- 8941 room
- 1,4372 rooms
- 3,0713 rooms
- 4,3044 rooms
- 2,0965 rooms
- 1,5346 rooms
- 7477 rooms
- 6628 rooms
- 1,7309+ rooms
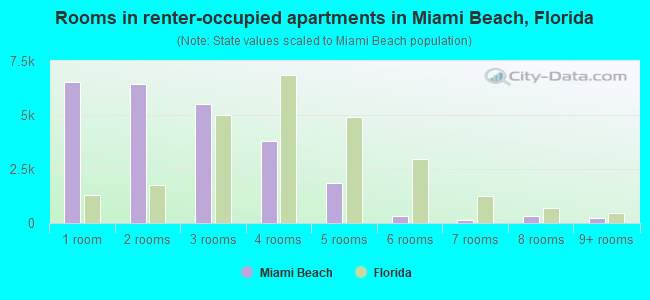
- Rooms in renter-occupied apartments in Miami Beach, Florida
- 6,5471 room
- 6,4352 rooms
- 5,5273 rooms
- 3,7954 rooms
- 1,8345 rooms
- 3056 rooms
- 1447 rooms
- 3098 rooms
- 2269+ rooms
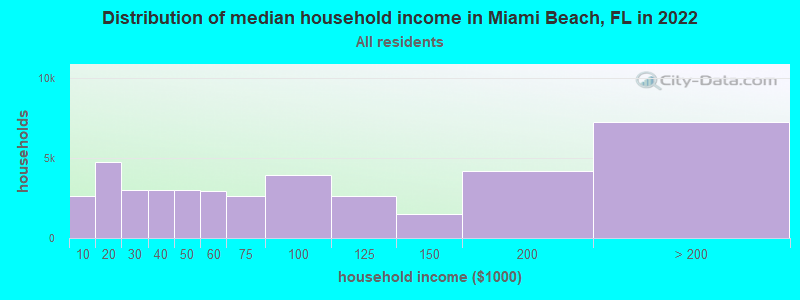
Miami Beach, FL household income distribution

- 2,644Less than $10,000
- 4,789$10,000 to $19,999
- 2,980$20,000 to $29,999
- 3,006$30,000 to $39,999
- 3,011$40,000 to $49,999
- 2,959$50,000 to $59,999
- 2,606$60,000 to $74,999
- 3,973$75,000 to $99,999
- 2,661$100,000 to $124,999
- 1,503$125,000 to $149,999
- 4,197$150,000 to $199,999
- 7,268$200,000 or more
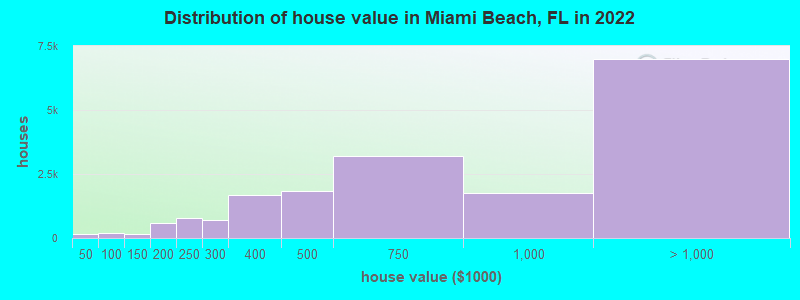
Home value of owner - occupied houses in 2022 in Miami Beach, FL
-
- 61Less than $10,000
- 20$20,000 to $24,999
- 76$40,000 to $49,999
- 8$50,000 to $59,999
- 18$70,000 to $79,999
- 59$80,000 to $89,999
- 15$90,000 to $99,999
- 75$100,000 to $124,999
- 83$125,000 to $149,999
- 211$150,000 to $174,999
- 385$175,000 to $199,999
- 794$200,000 to $249,999
- 697$250,000 to $299,999
- 1,690$300,000 to $399,999
- 1,833$400,000 to $499,999
- 3,191$500,000 to $749,999
- 1,754$750,000 to $999,999
- 2,131$1,000,000 to $1,499,999
- 1,029$1,500,000 to $1,999,999
- 3,823$2,000,000 or more
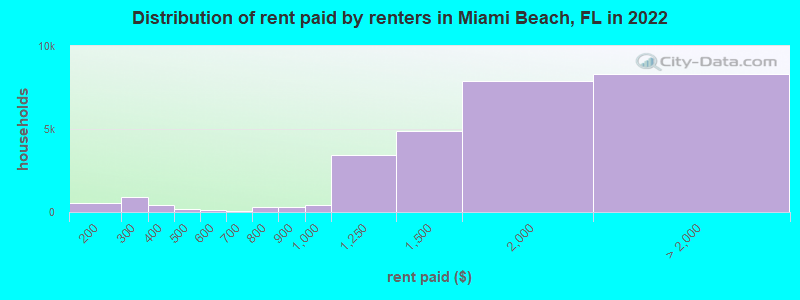
Rent paid by renters in 2022 in Miami Beach, FL
-
- 44Less than $100
- 149$100 to $149
- 407$150 to $199
- 613$200 to $249
- 262$250 to $299
- 228$300 to $349
- 201$350 to $399
- 117$400 to $449
- 39$450 to $499
- 70$500 to $549
- 60$550 to $599
- 12$600 to $649
- 59$650 to $699
- 157$700 to $749
- 135$750 to $799
- 277$800 to $899
- 444$900 to $999
- 3,409$1,000 to $1,249
- 4,886$1,250 to $1,499
- 7,882$1,500 to $1,999
- 3,443$2,000 to $2,499
- 1,863$2,500 to $2,999
- 828$3,000 to $3,499
- 1,537$3,500 or more
- 653No cash rent
Percentage of workers working in this county: 96.2%
Number of people working at home: 12,378 (26.4% of all workers)
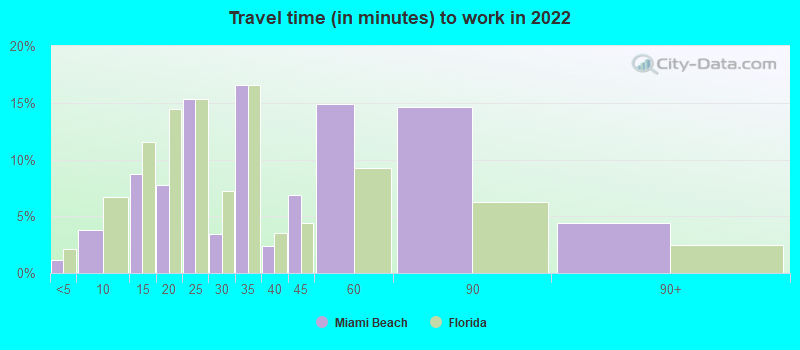
Travel time to work (commute)
- Less than 5 minutes: 365
- 5 to 9 minutes: 1,673
- 10 to 14 minutes: 4,222
- 15 to 19 minutes: 3,417
- 20 to 24 minutes: 7,390
- 25 to 29 minutes: 1,736
- 30 to 34 minutes: 6,353
- 35 to 39 minutes: 1,465
- 40 to 44 minutes: 2,026
- 45 to 59 minutes: 3,208
- 60 to 89 minutes: 1,992
- 90 or more minutes: 697
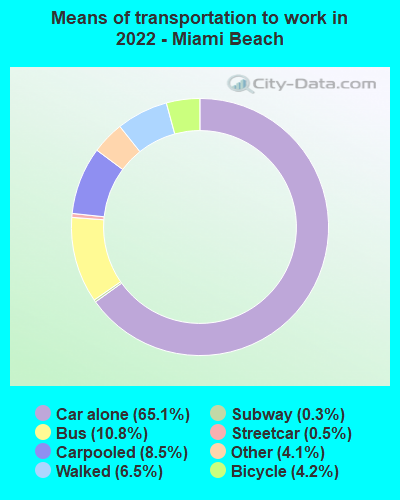
Means of transportation to work:
- Drove a car alone: 35,926 (53.2%)
- Carpooled: 4,666 (6.9%)
- Bus: 5,966 (8.8%)
- Subway or elevated rail: 288 (0.4%)
- Long-distance train or commuter rail: 151 (0.2%)
- Taxi: 2,266 (3.4%)
- Bicycle: 2,341 (3.5%)
- Walked: 3,604 (5.3%)
- Worked at home: 12,378 (18.3%)
- Unemployment by race in 2022
- Unemployment rate for White non-Hispanic residents
- 1.3%Males
- 0.8%Females
- Unemployment rate for Black residents
- 5.4%Males
- Unemployment rate for Asian residents
- 2.5%Males
- 14.5%Females
- Unemployment rate for other race residents
- 1.2%Males
- 3.4%Females
- Unemployment rate for two or more race residents
- 0.9%Males
- 3.5%Females
- Unemployment rate for Hispanic or Latino residents
- 2.7%Males
- 1.8%Females
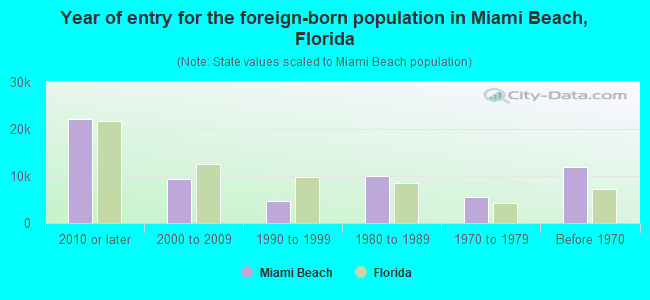
- Year of entry for the foreign-born population in Miami Beach, Florida
- 22,0632010 or later
- 9,4472000 to 2009
- 4,7841990 to 1999
- 10,0861980 to 1989
- 5,5521970 to 1979
- 12,013Before 1970
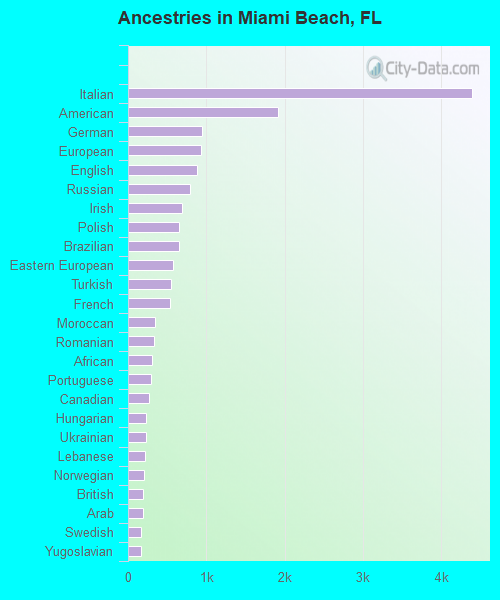
First ancestries reported:
- Italian: 4,390 (9.3%)
- American: 1,912 (4.1%)
- German: 944 (2.0%)
- European: 935 (2.0%)
- English: 881 (1.9%)
- Russian: 786 (1.7%)
- Irish: 684 (1.5%)
- Polish: 649 (1.4%)
- Brazilian: 647 (1.4%)
- Eastern European: 575 (1.2%)
- Turkish: 545 (1.2%)
- French: 537 (1.1%)
- Moroccan: 349 (0.7%)
- Romanian: 333 (0.7%)
- African: 307 (0.7%)
- Portuguese: 290 (0.6%)
- Canadian: 262 (0.6%)
- Hungarian: 235 (0.5%)
- Ukrainian: 224 (0.5%)
- Lebanese: 211 (0.4%)
- Norwegian: 202 (0.4%)
- British: 189 (0.4%)
- Arab: 189 (0.4%)
- Swedish: 169 (0.4%)
- Yugoslavian: 168 (0.4%)
- Egyptian: 160 (0.3%)
- Danish: 156 (0.3%)
- Croatian: 154 (0.3%)
- Haitian: 141 (0.3%)
- Iranian: 138 (0.3%)
- Bulgarian: 131 (0.3%)
- Scottish: 130 (0.3%)
- Austrian: 129 (0.3%)
- Czech: 120 (0.3%)
- Israeli: 117 (0.2%)
- Jamaican: 117 (0.2%)
- French Canadian: 116 (0.2%)
- Kenyan: 112 (0.2%)
- Greek: 78 (0.2%)
- Finnish: 72 (0.2%)
- Swiss: 67 (0.1%)
- Slovak: 56 (0.1%)
- Serbian: 49 (0.1%)
- West Indian: 46 (0.10%)
- Scotch-Irish: 45 (0.10%)
- Basque: 42 (0.09%)
- Albanian: 41 (0.09%)
- Lithuanian: 41 (0.09%)
- Dutch: 40 (0.09%)
- Northern European: 33 (0.07%)
- Estonian: 28 (0.06%)
- Trinidadian and Tobagonian: 25 (0.05%)
- Welsh: 22 (0.05%)
- Ghanaian: 20 (0.04%)
- Syrian: 13 (0.03%)
- Czechoslovakian: 13 (0.03%)
- Macedonian: 12 (0.03%)
- Maltese: 12 (0.03%)
- Armenian: 12 (0.03%)
- Assyrian: 9 (0.02%)
- Australian: 7 (0.01%)
- Luxembourger: 5 (0.01%)
- U.S. Virgin Islander: 4 (0.01%)
- Belgian: 3 (0.01%)
Most common places of birth for foreign-born residents (%):
| Miami Beach: | 26.7% (12,121) |
| Florida: | 22.0% (1,006,576) |
| Miami Beach: | 8.7% (3,945) |
| Florida: | 1.3% (57,263) |
| Miami Beach: | 8.7% (3,943) |
| Florida: | 6.5% (298,669) |
| Miami Beach: | 7.4% (3,365) |
| Florida: | 5.7% (262,042) |
| Miami Beach: | 4.6% (2,105) |
| Florida: | 2.7% (122,906) |
| Miami Beach: | 3.4% (1,561) |
| Florida: | 2.3% (107,160) |
| Miami Beach: | 3.4% (1,551) |
| Florida: | 2.1% (96,693) |
| Miami Beach: | 3.3% (1,485) |
| Florida: | 0.7% (30,755) |
| Miami Beach: | 2.5% (1,142) |
| Florida: | 2.1% (97,632) |
| Miami Beach: | 2.0% (928) |
| Florida: | 0.4% (20,008) |
| Miami Beach: | 1.8% (805) |
| Florida: | 0.5% (21,571) |
| Miami Beach: | 1.6% (739) |
| Florida: | 2.4% (109,132) |
| Miami Beach: | 1.6% (728) |
| Florida: | 0.5% (22,715) |
| Miami Beach: | 1.6% (727) |
| Florida: | 1.2% (54,585) |
| Miami Beach: | 1.6% (709) |
| Florida: | 0.3% (14,809) |
Place of birth for U.S.-born residents:
- This state: 18,336
- Other state: 20,806
- Northeast: 9,906
- Midwest: 5,362
- South: 2,395
- West: 3,143
81.0% of Miami Beach residents lived in the same house 1 years ago.
Out of people who lived in different houses, 38.0% lived in this county.
Out of people who lived in different counties, 16.7% lived in Florida.
| Miami Beach: | 81.0% |
| State average: | 86.3% |
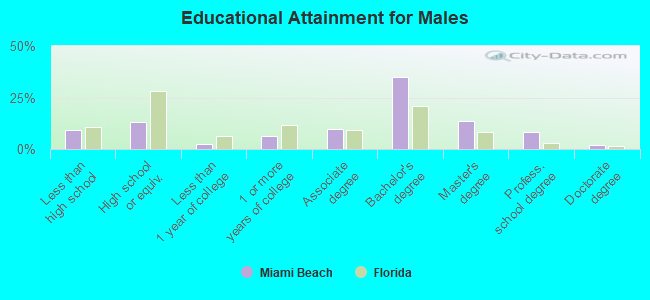
Education attainment for males 25 years and older:
- No schooling: 851
- Nursery to 4th grade: 114
- 5th and 6th grade: 365
- 7th and 8th grade: 645
- 9th grade: 281
- 10th grade: 207
- 11th grade: 145
- 12th grade, no diploma: 540
- High school graduate (or equivalency): 4,558
- Less than 1 year of college: 896
- Some college more than 1 year, no degree: 2,214
- Associate degree: 3,357
- Bachelor's degree: 12,066
- Master's degree: 4,742
- Professional school degree: 2,911
- Doctorate degree: 625
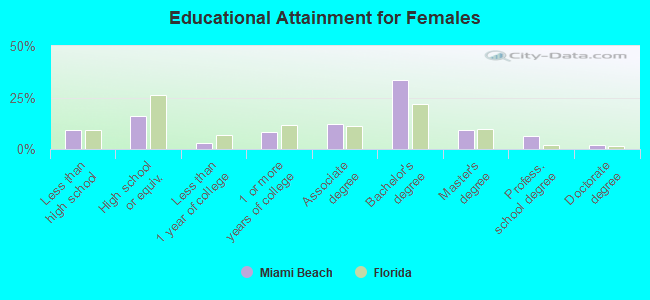
Education attainment for females 25 years and older:
- No schooling: 377
- Nursery to 4th grade: 8
- 5th and 6th grade: 328
- 7th and 8th grade: 135
- 9th grade: 237
- 10th grade: 7
- 11th grade: 499
- 12th grade, no diploma: 1,069
- High school graduate (or equivalency): 4,558
- Less than 1 year of college: 880
- Some college more than 1 year, no degree: 2,298
- Associate degree: 3,493
- Bachelor's degree: 9,511
- Master's degree: 2,614
- Professional school degree: 1,761
- Doctorate degree: 528
Housing units in structures:
- One, detached: 6,047
- One, attached: 1,089
- Two: 271
- 3 or 4: 2,805
- 5 to 9: 4,594
- 10 to 19: 8,945
- 20 to 49: 9,481
- 50 or more: 29,031
- Mobile homes: 211
- Boats, RVs, vans, etc.: 122
Housing units lacking complete kitchen facilities in 2022: 1.5%
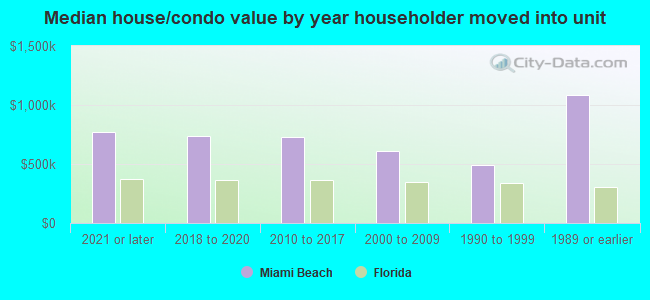
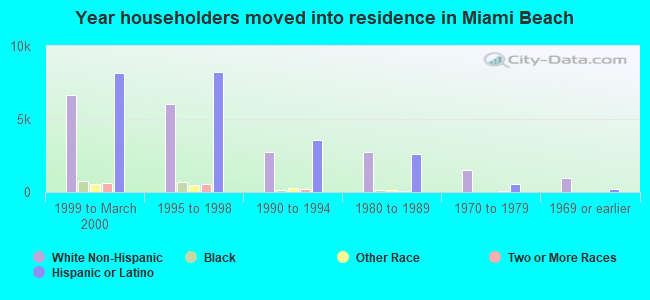
House/condo owner moved in on average 9 years ago
Renter moved in on average 2 years ago

- 86.7%Electricity
- 8.4%No fuel used
- 4.4%Utility gas
- 0.2%Fuel oil, kerosene, etc.
- 0.2%Solar energy
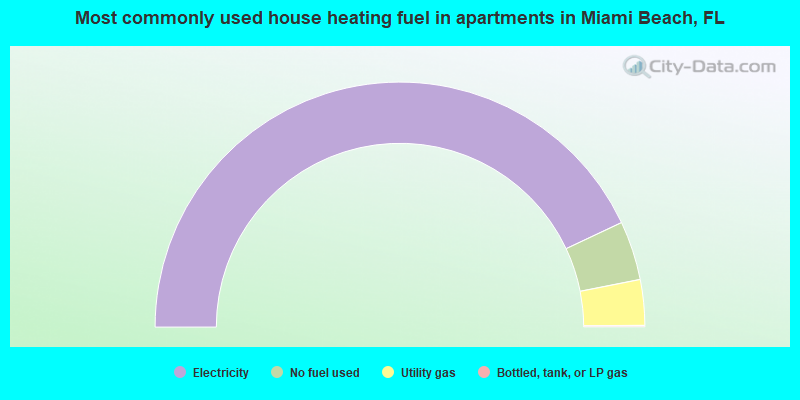
- 85.9%Electricity
- 7.8%No fuel used
- 6.0%Utility gas
- 0.2%Bottled, tank, or LP gas
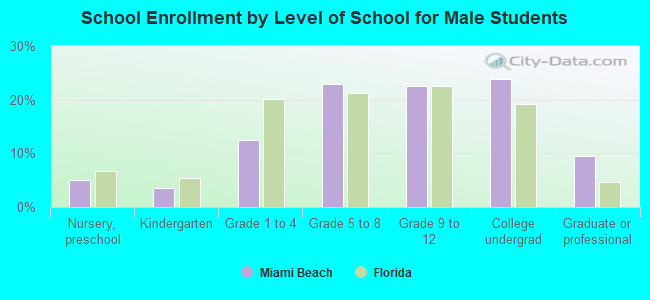
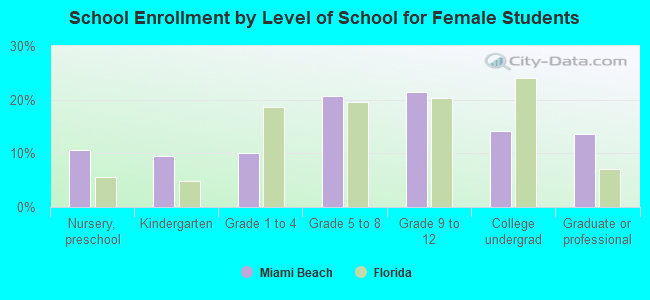
Private vs. public school enrollment:
| Here: | 44.2% |
| Florida: | 15.8% |
| Here: | 35.4% |
| Florida: | 12.9% |
| Here: | 23.8% |
| Florida: | 23.6% |