Monsey, NY (New York) Houses and Residents
Estimated median house or condo value in 2022: $868,602 (it was $249,600 in 2000 )
Monsey:
$868,602New York:
$400,400
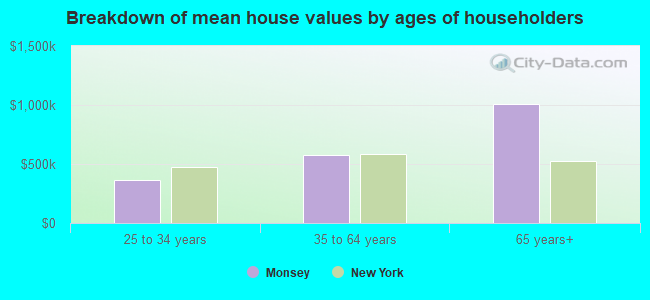
Lower value quartile - upper value quartile: $613,206 - $1,066,234Mean price in 2022: Detached houses: $932,811 Here:
$932,811State:
$476,719
Townhouses or other attached units: $1,024,809 Here:
$1,024,809State:
$699,270
In 2-unit structures: $1,456,733 Here:
$1,456,733State:
$713,077
In 3-to-4-unit structures: $704,128 Here:
$704,128State:
$764,568
In 5-or-more-unit structures: $850,473 Here:
$850,473State:
$912,009
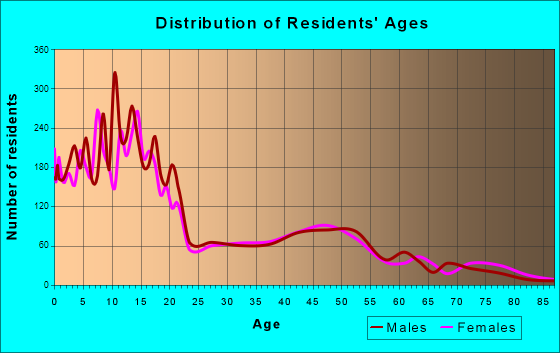
Total population: 18,412 (Urban population: 14,691, Rural population: 0)
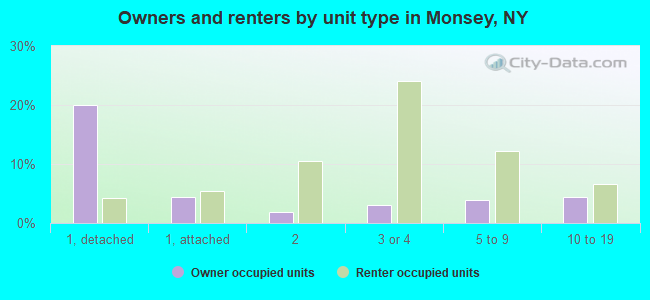
Houses: 5,274 (4,878 occupied: 1,780 owner occupied, 3,130 renter occupied )
% of renters here:
64%State:
46%
Housing density: 2,383 houses/condos per square mile
Median price asked for vacant for-sale houses and condos in 2022 in this county: $364,915.
Median contract rent in 2022: $1,380 (lower quartile is $694, upper quartile is $1,884)
Median rent asked for vacant for-rent units in 2022: $4,767
Median gross rent in Monsey, NY in 2022: $1,659
Housing units in Monsey with a mortgage: 1,131 (85 second mortgage, 0 home equity loan, 88 both second mortgage and home equity loan )Houses without a mortgage: 31
Median household income for houses/condos with a mortgage: $106,909
Median household income for apartments without a mortgage: $87,643
Median monthly housing costs: $1,828
Data:
Median house or condo value ($)
Median house or condo value ($ change since 2000)
Median house or condo value ($) - White
Median house or condo value ($) - Black or African American
Median house or condo value ($) - Asian
Median house or condo value ($) - Hispanic or Latino
Median house or condo value ($) - American Indian and Alaska Native
Median house or condo value ($) - Multirace
Median house or condo value ($) - Other Race
Median price asked for mobile homes ($)
Household density (households per square mile)
Mean house or condo value by units in structure - 1, detached ($)
Mean house or condo value by units in structure - 1, attached ($)
Mean house or condo value by units in structure - 2 ($)
Mean house or condo value by units in structure by units in structure - 3 or 4 ($)
Mean house or condo value by units in structure - 5 or more ($)
Mean house or condo value by units in structure - Boat, RV, van, etc. ($)
Mean house or condo value by units in structure - Mobile home ($)
Median contract rent ($)
Median contract rent - Lower quartile ($)
Median contract rent - Upper quartile ($)
Median gross rent ($)
Urban houses (%)
Rural houses (%)
Houses occupied (%)
Houses occupied (% change since 2000)
Houses owner occupied (%)
Houses owner occupied (% change since 2000)
Houses renter occupied (%)
Houses renter occupied (% change since 2000)
Vacant housing units - For rent (%)
Vacant housing units - For rent (% change since 2000)
Vacant housing units - For sale only (%)
Vacant housing units - For sale only (% change since 2000)
Vacant housing units - Rented or sold, not occupied (%)
Vacant housing units - Rented or sold, not occupied (% change since 2000)
Vacant housing units - For seasonal, recreational, or occasional use (%)
Vacant housing units - For seasonal, recreational, or occasional use (% change since 2000)
Vacant housing units - For migrant workers (%)
Vacant housing units - For migrant workers (% change since 2000)
Vacant housing units - Other vacant (%)
Vacant housing units - Other vacant (% change since 2000)
Median monthly housing costs ($)
Median household income for houses/condos with a mortgage ($)
Median household income for houses/condos without a mortgage ($)
Median household income ($)
Median household income ($) - White
Median household income ($) - Black or African American
Median household income ($) - Asian
Median household income ($) - Hispanic or Latino
Median household income ($) - American Indian and Alaska Native
Median household income ($) - Multirace
Median household income ($) - Other Race
Mortgage status - with mortgage (%)
Mortgage status - with second mortgage (%)
Mortgage status - with home equity loan (%)
Mortgage status - with both second mortgage and home equity loan (%)
Mortgage status - without a mortgage (%)
Median year house/condo built
Median year apartment built
Household type by relationship - Male householder living alone (%)
Household type by relationship - Male householder not living alone (%)
Household type by relationship - Female householder living alone (%)
Household type by relationship - Female householder not living alone (%)
Household type by relationship - Opposite-Sex spouse (%)
Household type by relationship - Same-Sex spouse (%)
Household type by relationship - Opposite-Sex unmarried partner (%)
Household type by relationship - Same-Sex unmarried partner (%)
Household type by relationship - In group quarters (%)
Size of family households - 2-person household (%)
Size of family households - 3-person household (%)
Size of family households - 4-person household (%)
Size of family households - 5-person household (%)
Size of family households - 6-person household (%)
Size of family households - 7-or-more-person household (%)
Size of nonfamily households - 1-person household (%)
Size of nonfamily households - 2-person household (%)
Size of nonfamily households - 3-person household (%)
Size of nonfamily households - 4-person household (%)
Size of nonfamily households - 5-person household (%)
Size of nonfamily households - 6-person household (%)
Size of nonfamily households - 7-or-moreperson household (%)
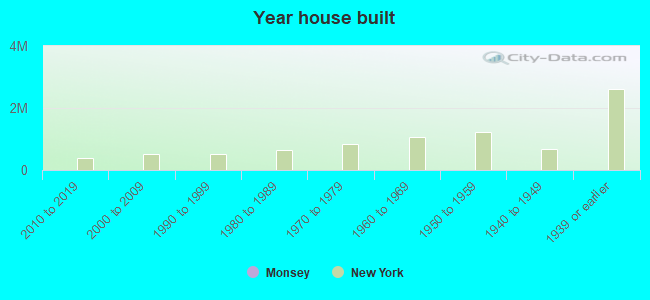
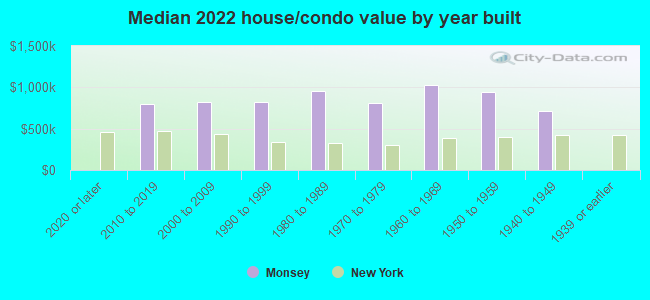
Year house built - Built 2010 or later (%)
Year house built - Built 2000 to 2009 (%)
Year house built - Built 1990 to 1999 (%)
Year house built - Built 1980 to 1989 (%)
Year house built - Built 1970 to 1979 (%)
Year house built - Built 1960 to 1969 (%)
Year house built - Built 1950 to 1959 (%)
Year house built - Built 1940 to 1949 (%)
Year house built - Built 1939 or earlier (%)
Median number of rooms in houses and condos
Median number of rooms in apartments
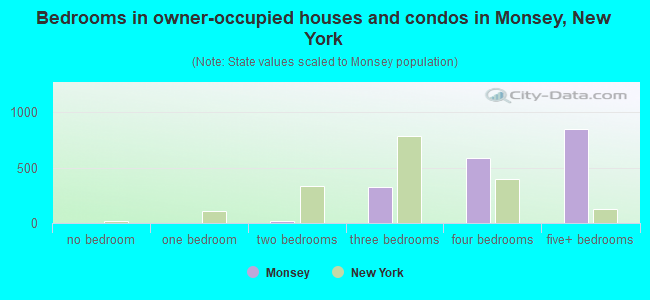
Median number of bedrooms in owner occupied houses
Mean number of bedrooms in owner occupied houses
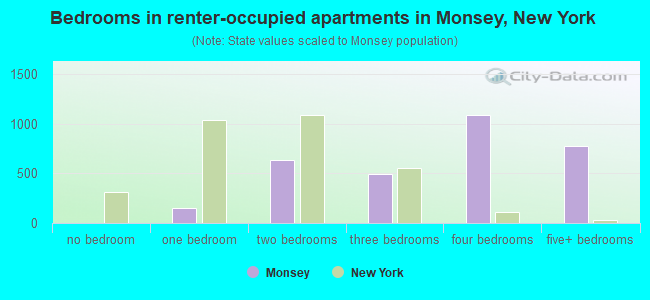
Median number of bedrooms in renter occupied houses
Mean number of bedrooms in renter occupied houses
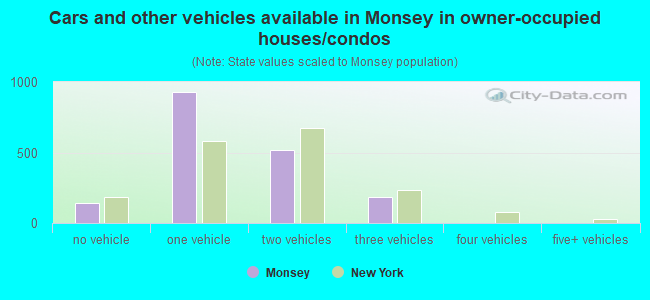
Median number of vehichles in owner occupied houses
Mean number of vehichles in owner occupied houses
Median number of vehichles in renter occupied houses
Mean number of vehichles in renter occupied houses
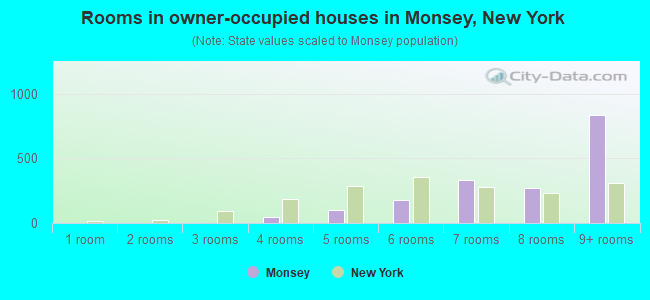
Rooms in owner-occupied houses - 1 room (%)
Rooms in owner-occupied houses - 2 rooms (%)
Rooms in owner-occupied houses - 3 rooms (%)
Rooms in owner-occupied houses - 4 rooms (%)
Rooms in owner-occupied houses - 5 rooms (%)
Rooms in owner-occupied houses - 6 rooms (%)
Rooms in owner-occupied houses - 7 rooms (%)
Rooms in owner-occupied houses - 8 rooms (%)
Rooms in owner-occupied houses - 9+ rooms (%)
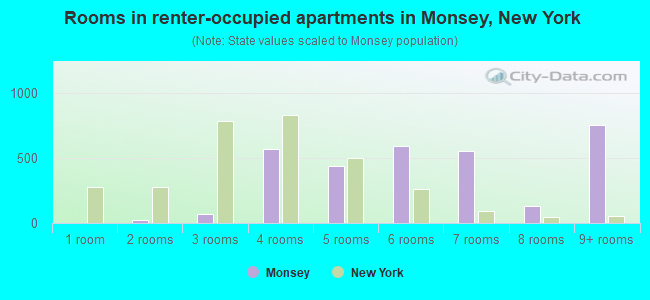
Rooms in renter-occupied houses - 1 room (%)
Rooms in renter-occupied houses - 2 rooms (%)
Rooms in renter-occupied houses - 3 rooms (%)
Rooms in renter-occupied houses - 4 rooms (%)
Rooms in renter-occupied houses - 5 rooms (%)
Rooms in renter-occupied houses - 6 rooms (%)
Rooms in renter-occupied houses - 7 rooms (%)
Rooms in renter-occupied houses - 8 rooms (%)
Rooms in renter-occupied houses - 9+ rooms (%)
Bedrooms in owner-occupied houses - no bedrooms (%)
Bedrooms in owner-occupied houses - 1 bedroom (%)
Bedrooms in owner-occupied houses - 2 bedrooms (%)
Bedrooms in owner-occupied houses - 3 bedrooms (%)
Bedrooms in owner-occupied houses - 4 bedrooms (%)
Bedrooms in owner-occupied houses - 5+ bedrooms (%)
Bedrooms in renter-occupied houses - no bedrooms (%)
Bedrooms in renter-occupied houses - 1 bedroom (%)
Bedrooms in renter-occupied houses - 2 bedrooms (%)
Bedrooms in renter-occupied houses - 3 bedrooms (%)
Bedrooms in renter-occupied houses - 4 bedrooms (%)
Bedrooms in renter-occupied houses - 5+ bedrooms (%)
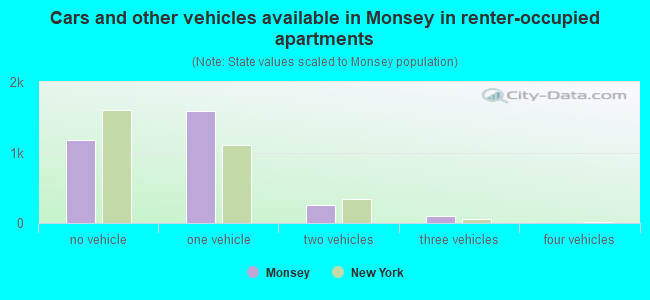
Vehicles available in owner-occupied houses - no vehicle available (%)
Vehicles available in owner-occupied houses - 1 vehicle available(%)
Vehicles available in owner-occupied houses - 2 Vehicles available (%)
Vehicles available in owner-occupied houses - 3 Vehicles available (%)
Vehicles available in owner-occupied houses - 4 Vehicles available (%)
Vehicles available in owner-occupied houses - 5+ Vehicles available (%)
Vehicles available in renter-occupied houses - no vehicle available (%)
Vehicles available in renter-occupied houses - 1 vehicle available (%)
Vehicles available in renter-occupied houses - 2 Vehicles available (%)
Vehicles available in renter-occupied houses - 3 Vehicles available (%)
Vehicles available in renter-occupied houses - 4 Vehicles available (%)
Vehicles available in renter-occupied houses - 5+ Vehicles available (%)
Housing units in structures - 1, detached (%)
Housing units in structures - 1, attached (%)
Housing units in structures - 2 (%)
Housing units in structures - 3 or 4 (%)
Housing units in structures - 5 to 9 (%)
Housing units in structures - 10 to 19 (%)
Housing units in structures - 20 to 49 (%)
Housing units in structures - 50 or more (%)
Housing units in structures - Mobile home (%)
Housing units in structures - Boat, RV, van, etc. (%)
Housing units in structures - Owners - 1, detached (%)
Housing units in structures - Owners - 1, attached (%)
Housing units in structures - Owners - 2 (%)
Housing units in structures - Owners - 3 or 4 (%)
Housing units in structures - Owners - 5 to 9 (%)
Housing units in structures - Owners - 10 to 19 (%)
Housing units in structures - Owners - 20 to 49 (%)
Housing units in structures - Owners - 50 or more (%)
Housing units in structures - Owners - Mobile home (%)
Housing units in structures - Owners - Boat, RV, van, etc. (%)
Housing units in structures - Renters - 1, detached (%)
Housing units in structures - Renters - 1, attached (%)
Housing units in structures - Renters - 2 (%)
Housing units in structures - Renters - 3 or 4 (%)
Housing units in structures - Renters - 5 to 9 (%)
Housing units in structures - Renters - 10 to 19 (%)
Housing units in structures - Renters - 20 to 49 (%)
Housing units in structures - Renters - 50 or more (%)
Housing units in structures - Renters - Mobile home (%)
Housing units in structures - Renters - Boat, RV, van, etc. (%)
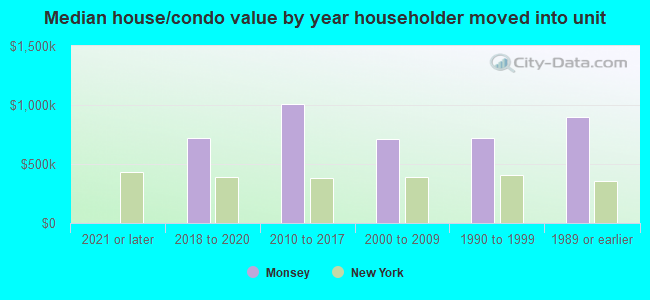
House/condo owner moved in on average (years ago)
Renter moved in on average (years ago)
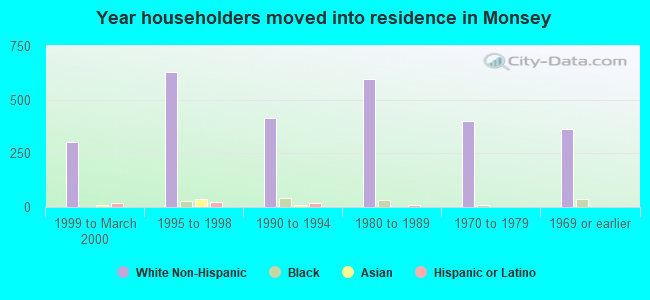
Year householder moved into unit - Moved in 1999 to March 2000 (%)
Year householder moved into unit - Moved in 1999 to March 2000 (%) - White
Year householder moved into unit - Moved in 1999 to March 2000 (%) - Black or African American
Year householder moved into unit - Moved in 1999 to March 2000 (%) - Asian
Year householder moved into unit - Moved in 1999 to March 2000 (%) - Hispanic or Latino
Year householder moved into unit - Moved in 1999 to March 2000 (%) - American Indian and Alaska Native
Year householder moved into unit - Moved in 1999 to March 2000 (%) - Multirace
Year householder moved into unit - Moved in 1999 to March 2000 (%) - Other Race
Year householder moved into unit - Moved in 1995 to 1998 (%)
Year householder moved into unit - Moved in 1995 to 1998 (%) - White
Year householder moved into unit - Moved in 1995 to 1998 (%) - Black or African American
Year householder moved into unit - Moved in 1995 to 1998 (%) - Asian
Year householder moved into unit - Moved in 1995 to 1998 (%) - Hispanic or Latino
Year householder moved into unit - Moved in 1995 to 1998 (%) - American Indian and Alaska Native
Year householder moved into unit - Moved in 1995 to 1998 (%) - Multirace
Year householder moved into unit - Moved in 1995 to 1998 (%) - Other Race
Year householder moved into unit - Moved in 1990 to 1994 (%)
Year householder moved into unit - Moved in 1990 to 1994 (%) - White
Year householder moved into unit - Moved in 1990 to 1994 (%) - Black or African American
Year householder moved into unit - Moved in 1990 to 1994 (%) - Asian
Year householder moved into unit - Moved in 1990 to 1994 (%) - Hispanic or Latino
Year householder moved into unit - Moved in 1990 to 1994 (%) - American Indian and Alaska Native
Year householder moved into unit - Moved in 1990 to 1994 (%) - Multirace
Year householder moved into unit - Moved in 1990 to 1994 (%) - Other Race
Year householder moved into unit - Moved in 1980 to 1989 (%)
Year householder moved into unit - Moved in 1980 to 1989 (%) - White
Year householder moved into unit - Moved in 1980 to 1989 (%) - Black or African American
Year householder moved into unit - Moved in 1980 to 1989 (%) - Asian
Year householder moved into unit - Moved in 1980 to 1989 (%) - Hispanic or Latino
Year householder moved into unit - Moved in 1980 to 1989 (%) - American Indian and Alaska Native
Year householder moved into unit - Moved in 1980 to 1989 (%) - Multirace
Year householder moved into unit - Moved in 1980 to 1989 (%) - Other Race
Year householder moved into unit - Moved in 1970 to 1979 (%)
Year householder moved into unit - Moved in 1970 to 1979 (%) - White
Year householder moved into unit - Moved in 1970 to 1979 (%) - Black or African American
Year householder moved into unit - Moved in 1970 to 1979 (%) - Asian
Year householder moved into unit - Moved in 1970 to 1979 (%) - Hispanic or Latino
Year householder moved into unit - Moved in 1970 to 1979 (%) - American Indian and Alaska Native
Year householder moved into unit - Moved in 1970 to 1979 (%) - Multirace
Year householder moved into unit - Moved in 1970 to 1979 (%) - Other Race
Year householder moved into unit - Moved in 1969 or earlier (%)
Year householder moved into unit - Moved in 1969 or earlier (%) - White
Year householder moved into unit - Moved in 1969 or earlier (%) - Black or African American
Year householder moved into unit - Moved in 1969 or earlier (%) - Asian
Year householder moved into unit - Moved in 1969 or earlier (%) - Hispanic or Latino
Year householder moved into unit - Moved in 1969 or earlier (%) - American Indian and Alaska Native
Year householder moved into unit - Moved in 1969 or earlier (%) - Multirace
Year householder moved into unit - Moved in 1969 or earlier (%) - Other Race
Housing units lacking complete plumbing facilities (%)
Housing units lacking complete kitchen facilities (%)
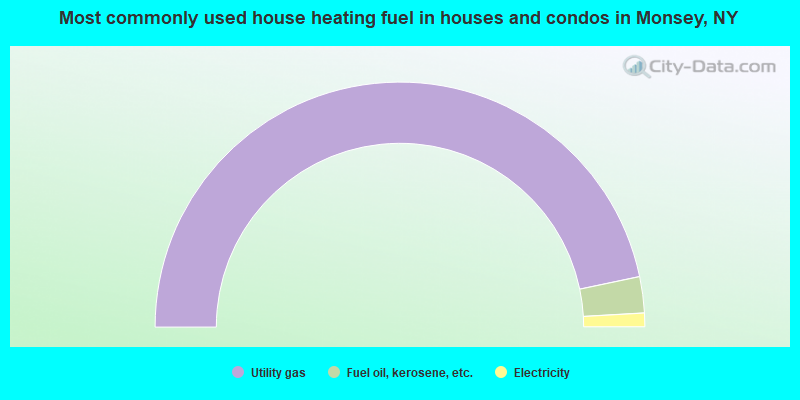
House heating fuel used in houses and condos - Utility gas (%)
House heating fuel used in houses and condos - Bottled, tank, or LP gas (%)
House heating fuel used in houses and condos - Electricity (%)
House heating fuel used in houses and condos - Fuel oil, kerosene, etc. (%)
House heating fuel used in houses and condos - Coal or coke (%)
House heating fuel used in houses and condos - Wood (%)
House heating fuel used in houses and condos - Solar energy (%)
House heating fuel used in houses and condos - Other fuel (%)
House heating fuel used in houses and condos - No fuel used (%)
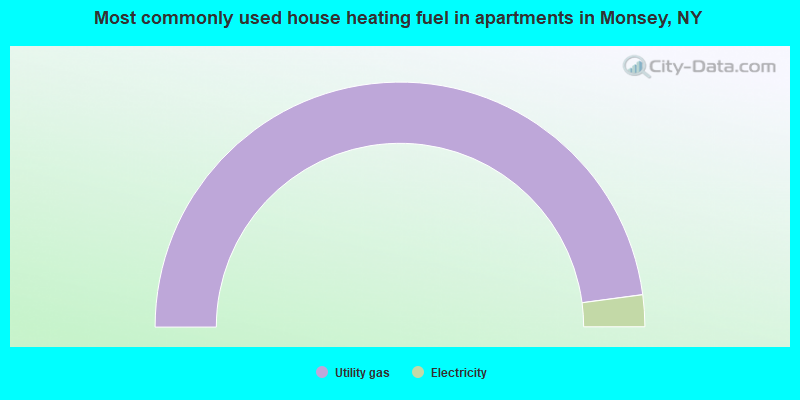
House heating fuel used in apartments - Utility gas (%)
House heating fuel used in apartments - Bottled, tank, or LP gas (%)
House heating fuel used in apartments - Electricity (%)
House heating fuel used in apartments - Fuel oil, kerosene, etc. (%)
House heating fuel used in apartments - Coal or coke (%)
House heating fuel used in apartments - Wood (%)
House heating fuel used in apartments - Solar energy (%)
House heating fuel used in apartments - Other fuel (%)
House heating fuel used in apartments - No fuel used (%)
Latest news about housing in Monsey, NY collected exclusively by city-data.com from local newspapers, TV, and radio stations
Median year house/condo built: 1979Median year apartment built: 2006Household type by relationship:
Households: 28,429
Male householders: 3,738 (49 living alone ), Female householders: 1,129 (73 living alone )4,460 spouses (4,460 opposite-sex spouses ), 18 unmarried partners , (18 opposite-sex unmarried partners ), 18,014 children (17,955 natural , 18 adopted , 40 stepchildren ), 119 grandchildren , 33 brothers or sisters , 196 parents , 0 foster children , 86 other relatives , 160 non-relatives In group quarters: 471
Size of family households: 676 2-persons , 581 3-persons , 312 4-persons , 515 5-persons , 461 6-persons , 2,001 7-or-more-persons .
Size of nonfamily households: 142 1-person , 16 2-persons , 32 3-persons , 11 4-persons .
16,757 married couples with children. single-parent households (18 men , 130 women ).
19.8% of residents of Monsey speak English at home. of residents speak Spanish at home (42% speak English very well , 15% speak English well , 18% speak English not well , 25% don't speak English at all ).of residents speak other Indo-European language at home (40% speak English very well , 33% speak English well , 20% speak English not well , 7% don't speak English at all ).of residents speak other language at home (73% speak English very well , 7% speak English well , 18% speak English not well , 1% don't speak English at all ).
Foreign born population: 1,948 (6.9%)of them are naturalized citizens )
Median number of rooms in houses and condos:
Median number of rooms in apartments
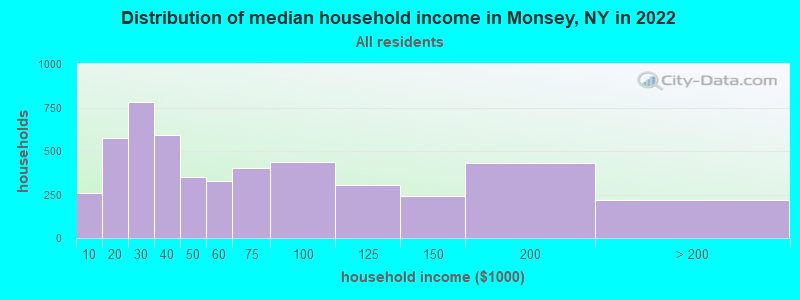
Monsey, NY household income distribution 258 Less than $10,000573 $10,000 to $19,999780 $20,000 to $29,999591 $30,000 to $39,999348 $40,000 to $49,999326 $50,000 to $59,999403 $60,000 to $74,999434 $75,000 to $99,999302 $100,000 to $124,999244 $125,000 to $149,999430 $150,000 to $199,999217 $200,000 or more
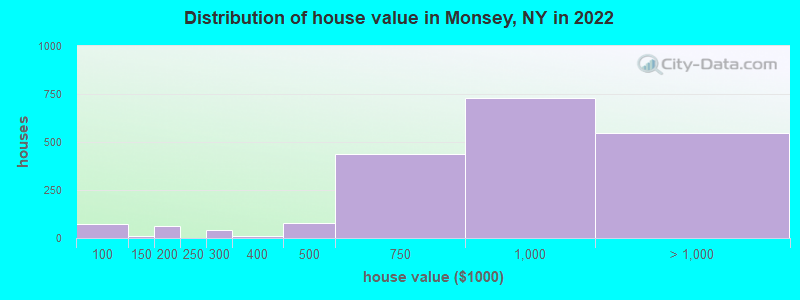
Home value of owner - occupied houses in 2022 in Monsey, NY 47 $50,000 to $59,99923 $60,000 to $69,9990 $90,000 to $99,9999 $125,000 to $149,99960 $150,000 to $174,9994 $175,000 to $199,99942 $250,000 to $299,99911 $300,000 to $399,99976 $400,000 to $499,999436 $500,000 to $749,999726 $750,000 to $999,999295 $1,000,000 to $1,499,999155 $1,500,000 to $1,999,99996 $2,000,000 or moreRent paid by renters in 2022 in Monsey, NY 198 $100 to $14924 $150 to $19916 $300 to $34948 $450 to $49983 $550 to $599143 $600 to $64993 $650 to $699151 $700 to $74926 $750 to $79951 $800 to $899190 $900 to $999330 $1,000 to $1,249327 $1,250 to $1,499657 $1,500 to $1,999377 $2,000 to $2,49962 $2,500 to $2,99992 $3,000 to $3,499219 No cash rent
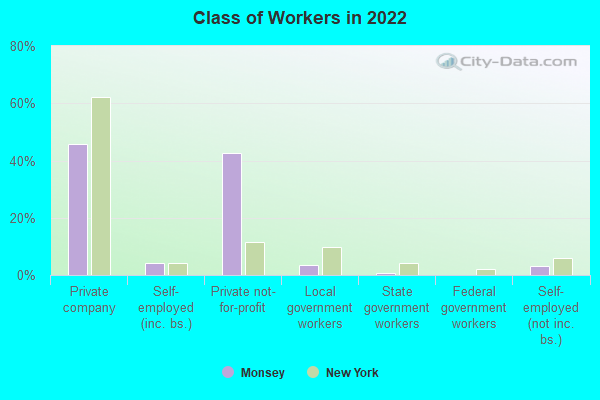
Percentage of workers working in this county: 82.2%Number of people working at home: 1,114 (16.9% of all workers )
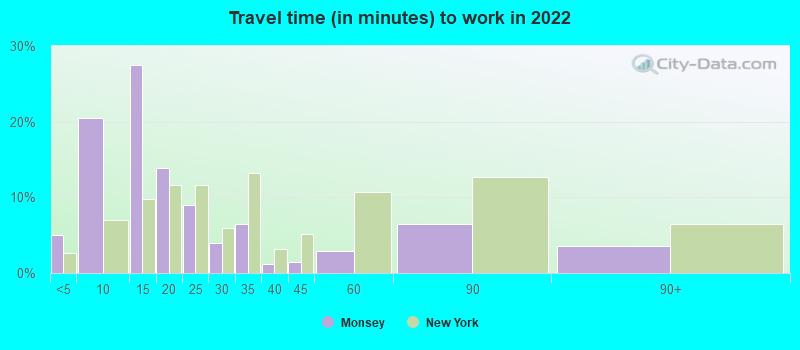
Travel time to work (commute)
Less than 5 minutes: 3905 to 9 minutes: 1,42810 to 14 minutes: 1,42215 to 19 minutes: 71120 to 24 minutes: 24825 to 29 minutes: 6130 to 34 minutes: 17335 to 39 minutes: 13540 to 44 minutes: 6845 to 59 minutes: 39260 to 89 minutes: 41690 or more minutes: 202
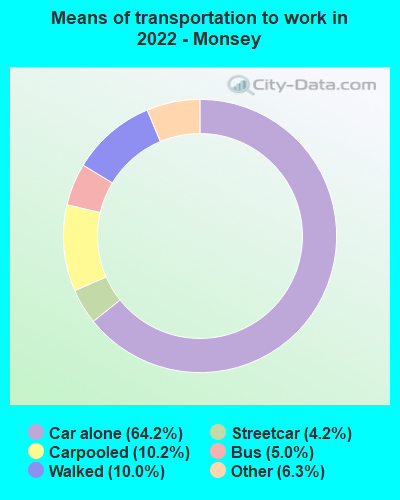
Means of transportation to work:
Drove a car alone: 3,495 (50.7%)Carpooled: 708 (10.3%)Bus : 284 (4.1%)Subway or elevated rail : 161 (2.3%)Taxi: 468 (6.8%)Walked: 701 (10.2%)Worked at home: 1,114 (16.1%)
Unemployment by race in 2022
Unemployment rate for White non-Hispanic residents 4.2% Males8.5% FemalesUnemployment rate for Black residents 21.0% FemalesUnemployment rate for two or more race residents 22.9% Females
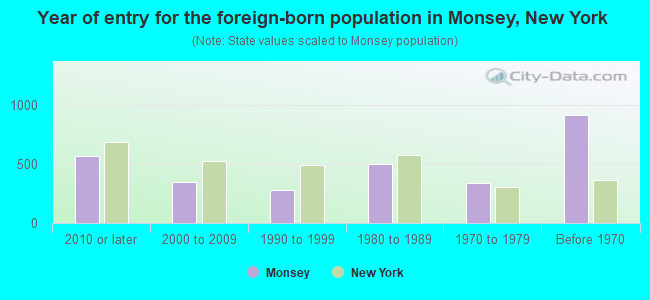
Year of entry for the foreign-born population in Monsey, New York
571 2010 or later 349 2000 to 2009 277 1990 to 1999 501 1980 to 1989 340 1970 to 1979 918 Before 1970
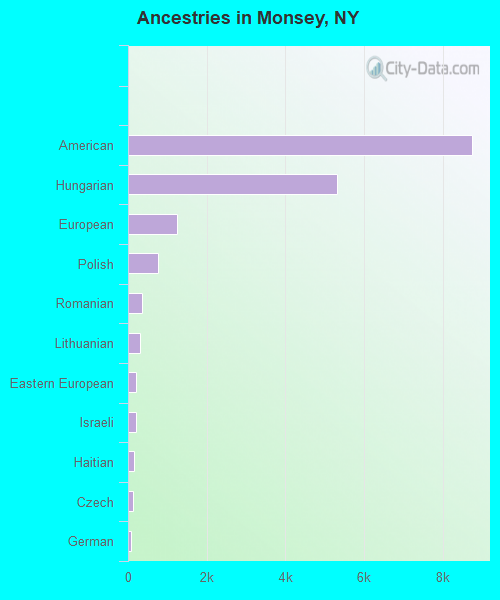
First ancestries reported:
American: 8,745 (43.5%)
Hungarian: 5,317 (26.5%)
European: 1,242 (6.2%)
Polish: 763 (3.8%)
Romanian: 350 (1.7%)
Lithuanian: 298 (1.5%)
Eastern European: 212 (1.1%)
Israeli: 198 (1.0%)
Haitian: 144 (0.7%)
Czech: 124 (0.6%)
German: 81 (0.4%)
Swiss: 71 (0.4%)
Irish: 54 (0.3%)
Dutch: 39 (0.2%)
English: 39 (0.2%)
Russian: 37 (0.2%)
Ukrainian: 35 (0.2%)
British: 33 (0.2%)
Austrian: 28 (0.1%)
French: 26 (0.1%)
South African: 23 (0.1%)
Belgian: 22 (0.1%)
Lebanese: 19 (0.09%)
Canadian: 18 (0.09%)
British West Indian: 14 (0.07%)
Czechoslovakian: 13 (0.06%)
Ethiopian: 10 (0.05%)
West Indian: 7 (0.03%)
Slovak: 5 (0.02%)
Turkish: 5 (0.02%)
Italian: 4 (0.02%) Most common places of birth for foreign-born residents (%): Israel Monsey:
19.5% (386)New York:
0.7% (29,743)
Haiti Monsey:
13.2% (262)New York:
2.8% (126,936)
Canada Monsey:
8.5% (168)New York:
1.3% (59,107)
United Kingdom, excluding England and Scotland Monsey:
7.2% (142)New York:
0.8% (33,869)
Hungary Monsey:
5.8% (115)New York:
0.2% (8,808)
Germany Monsey:
4.5% (89)New York:
0.9% (38,713)
Belgium Monsey:
4.4% (87)New York:
0.1% (4,960)
England Monsey:
4.0% (80)New York:
0.5% (23,058)
Guatemala Monsey:
3.2% (64)New York:
1.4% (61,245)
South Africa Monsey:
2.6% (51)New York:
0.2% (8,010)
Romania Monsey:
2.4% (48)New York:
0.4% (19,252)
France Monsey:
2.2% (43)New York:
0.6% (25,782)
Ukraine Monsey:
2.2% (43)New York:
1.7% (78,421)
Dominican Republic Monsey:
2.1% (41)New York:
11.1% (501,040)
Sierra Leone Monsey:
2.0% (40)New York:
0.1% (3,296)
Austria Monsey:
1.8% (36)New York:
0.1% (4,732)
Lithuania Monsey:
1.6% (31)New York:
0.1% (2,564)
Place of birth for U.S.-born residents:
This state: 24,689Other state: 1,156Northeast: 810Midwest: 184South: 86West: 50 93.9% of Monsey residents lived in the same house 1 years ago.
Out of people who lived in different houses, 35.9% lived in this county.
Out of people who lived in different counties, 98.7% lived in New York.
Monsey:
93.9%State average:
89.6%
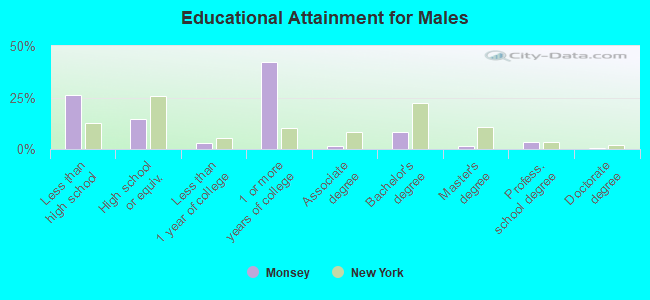
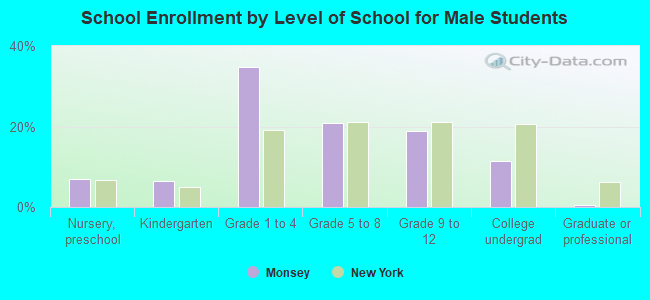
Education attainment for males 25 years and older:
No schooling: 231Nursery to 4th grade: 365th and 6th grade: 457th and 8th grade: 439th grade: 5910th grade: 2311th grade: 11612th grade, no diploma: 642High school graduate (or equivalency): 671Less than 1 year of college: 127Some college more than 1 year, no degree: 1,935Associate degree: 74Bachelor's degree: 369Master's degree: 63Professional school degree: 147Doctorate degree: 16
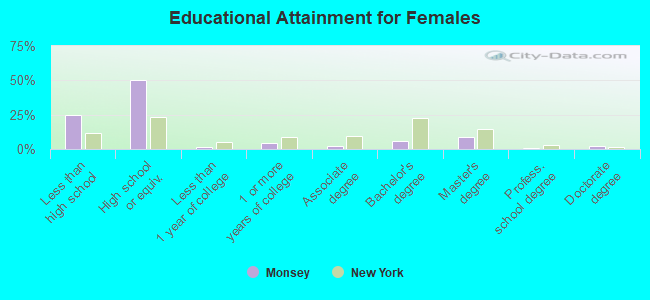
Education attainment for females 25 years and older:
No schooling: 282Nursery to 4th grade: 85th and 6th grade: 137th and 8th grade: 249th grade: 1310th grade: 4011th grade: 3512th grade, no diploma: 748High school graduate (or equivalency): 2,406Less than 1 year of college: 78Some college more than 1 year, no degree: 196Associate degree: 96Bachelor's degree: 290Master's degree: 416Professional school degree: 22Doctorate degree: 88
Housing units in structures:
One, detached: 1,370One, attached: 456Two: 7013 or 4: 1,1295 to 9: 95310 to 19: 54020 to 49: 120Housing units lacking complete plumbing facilities in 2022: 4.3%Housing units lacking complete kitchen facilities in 2022: 4.4%House/condo owner moved in on average 16 years ago
Renter moved in on average 6 years ago
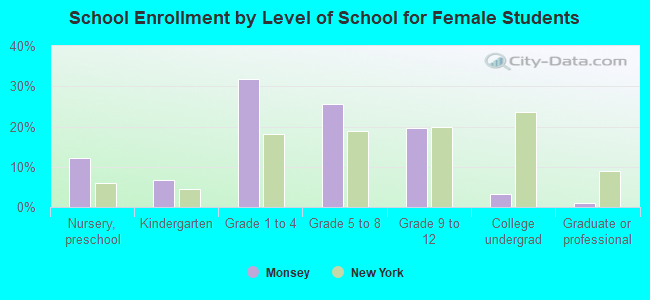
Private vs. public school enrollment:
Students in private schools in grades 1 to 8 (elementary and middle school): 7,528 Students in private schools in grades 9 to 12 (high school): 2,770 Students in private undergraduate colleges: 951