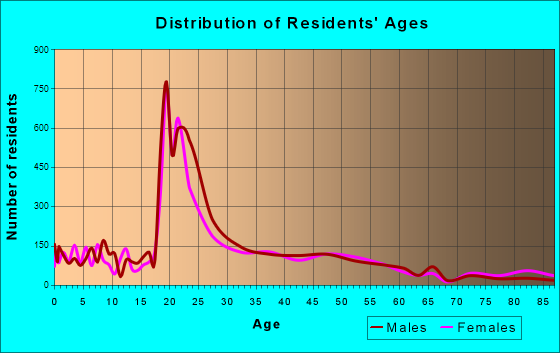
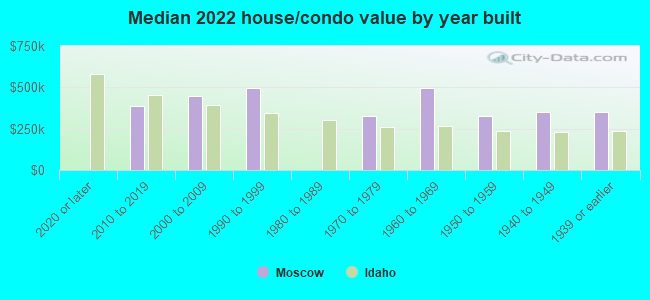
Moscow, ID (Idaho) Houses and Residents
| Moscow: | $405,893 |
| Idaho: | $432,500 |
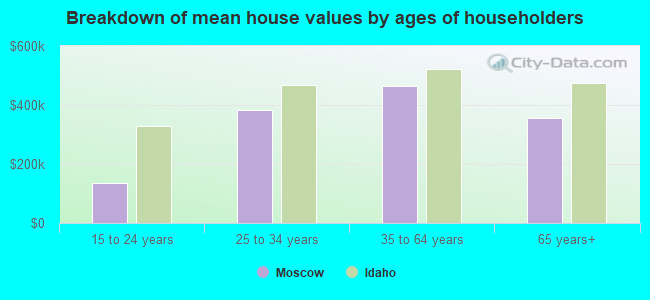
Mean price in 2022:
Detached houses: $486,364
Here: $486,364 State: $527,539 Townhouses or other attached units: $378,630
Here: $378,630 State: $416,749 In 2-unit structures: $421,355
Here: $421,355 State: $523,641 In 3-to-4-unit structures: $372,321
Here: $372,321 State: $384,926 In 5-or-more-unit structures: $328,083
Here: $328,083 State: $590,418 Mobile homes: $33,994
Here: $33,994 State: $150,232
Total population: 24,767 (Urban population: 21,190 (all inside urban clusters), Rural population: 17 (all nonfarm))
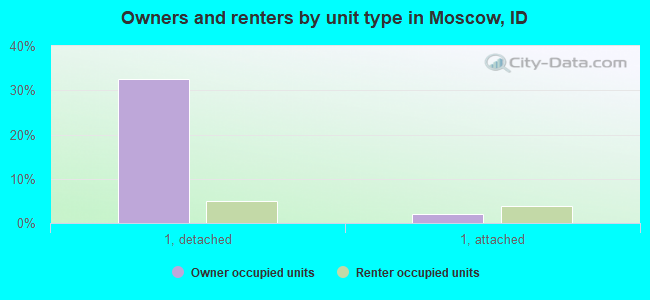
Houses: 10,863 (10,240 occupied: 4,285 owner occupied, 6,068 renter occupied)
| % of renters here: | 59% |
| State: | 28% |
Housing density: 1,766 houses/condos per square mile
Median price asked for vacant for-sale houses and condos in 2022: $669,593.
Median contract rent in 2022: $839 (lower quartile is $683, upper quartile is $1,243)
Median rent asked for vacant for-rent units in 2022: $1,292
Median gross rent in Moscow, ID in 2022: $930
Housing units in Moscow with a mortgage: 2,802 (397 second mortgage, 0 home equity loan, 393 both second mortgage and home equity loan)
Houses without a mortgage: 33
Median household income for houses/condos with a mortgage: $99,428
Median household income for apartments without a mortgage: $64,681
Median monthly housing costs: $959
Compare current foreclosures near Moscow, ID:
| Photo | Address | Area | Beds / Baths | Price | Details |
|---|---|---|---|---|---|

|
#1
W Pullman Rd # 307
Moscow, ID 83843
|
- sq. feet
|
- baths - beds |
show details | |

|
#2
S Asbury St Apt 4
Moscow, ID 83843
|
- sq. feet
|
- baths - beds |
show details | |

|
#3
E 3rd St
Moscow, ID 83843
|
- sq. feet
|
- baths - beds |
show details | |

|
#4
1/2 N Hayes St
Moscow, ID 83843
|
- sq. feet
|
- baths - beds |
show details | |

|
#5
N Polk Ext Apt 4
Moscow, ID 83843
|
- sq. feet
|
- baths - beds |
show details | |

|
#6
N Main St Apt 2
Moscow, ID 83843
|
- sq. feet
|
- baths - beds |
show details | |

|
#7
S Polk St
Moscow, ID 83843
|
- sq. feet
|
- baths - beds |
show details | |

|
#8
N Grant St
Moscow, ID 83843
|
- sq. feet
|
- baths - beds |
show details | |

|
#9
S Blaine St
Moscow, ID 83843
|
- sq. feet
|
- baths - beds |
show details | |

|
#10
NE Terre View Dr Apt B03
Pullman, WA 99163
|
- sq. feet
|
- baths - beds |
show details |
| Photo | Address | Area | Beds / Baths | Price | Details |
|---|---|---|---|---|---|

|
#11
NW Deane St
Pullman, WA 99163
|
- sq. feet
|
- baths - beds |
show details | |

|
#12
Palouse Cove Rd Unit 3
Palouse, WA 99161
|
- sq. feet
|
- baths - beds |
show details | |

|
#13
Larch St
Potlatch, ID 83855
|
- sq. feet
|
- baths - beds |
show details | |

|
#14
Pine St
Potlatch, ID 83855
|
- sq. feet
|
- baths - beds |
show details | |

|
#15
SE Carolstar Dr
Pullman, WA 99163
|
- sq. feet
|
- baths - beds |
show details | |

|
Check over 1 million property listings on Foreclosure.com!
|
browse all offers | |||

Latest news about housing in Moscow, ID collected exclusively by city-data.com from local newspapers, TV, and radio stations

 | Student Apartments in Moscow—for non student? (6 replies) |
| Nov 2022 Moscow UofI student stabbings (228 replies) |
| Moscow apartments (0 replies) |
| Homes near Moscow, Boise, or maybe elsewhere? (16 replies) |
| Lewiston or Moscow? (42 replies) |
| Moscow - water quality and mold? (12 replies) |
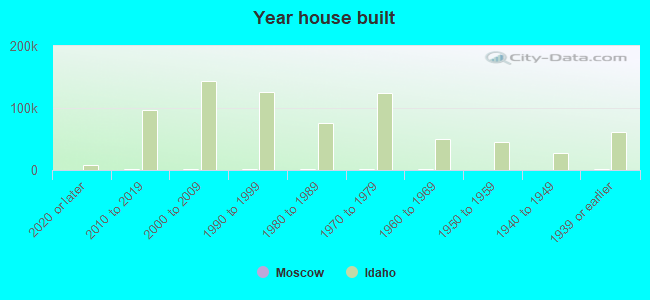
Median year apartment built: 1989
Household type by relationship:
Households: 26,789- Male householders: 5,444 (1,714 living alone), Female householders: 4,753 (1,499 living alone)
3,791 spouses (3,791 opposite-sex spouses), 980 unmarried partners, (960 opposite-sex unmarried partners), 4,245 children (4,007 natural, 54 adopted, 184 stepchildren), 42 grandchildren, 69 brothers or sisters, 37 parents, 0 foster children, 65 other relatives, 1,305 non-relatives
- In group quarters: 6,053
Size of family households: 2,068 2-persons, 1,393 3-persons, 777 4-persons, 549 5-persons, 46 6-persons, 52 7-or-more-persons.
Size of nonfamily households: 3,201 1-person, 1,630 2-persons, 497 3-persons, 87 4-persons, 84 5-persons, 25 7-or-more-persons.
2,785 married couples with children.
1,072 single-parent households (236 men, 836 women).
91.3% of residents of Moscow speak English at home.
1.9% of residents speak Spanish at home (72% speak English very well, 28% speak English well, 1% speak English not well).
2.5% of residents speak other Indo-European language at home (67% speak English very well, 33% speak English well).
2.4% of residents speak Asian or Pacific Island language at home (70% speak English very well, 20% speak English well, 10% speak English not well).
1.5% of residents speak other language at home (65% speak English very well, 35% speak English well, 1% don't speak English at all).
Foreign born population: 1,730 (6.5%)
(38.7% of them are naturalized citizens)
| Here: | 6.4 |
| State: | 6.5 |
| Here: | 4.1 |
| State: | 4.4 |
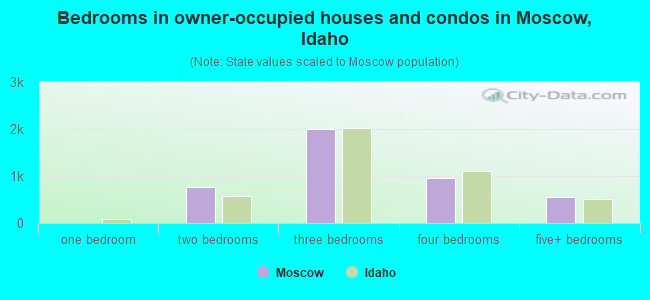
- Bedrooms in owner-occupied houses and condos in Moscow, Idaho
- 0no bedroom
- 01 bedroom
- 7672 bedrooms
- 1,9943 bedrooms
- 9624 bedrooms
- 5635+ bedrooms
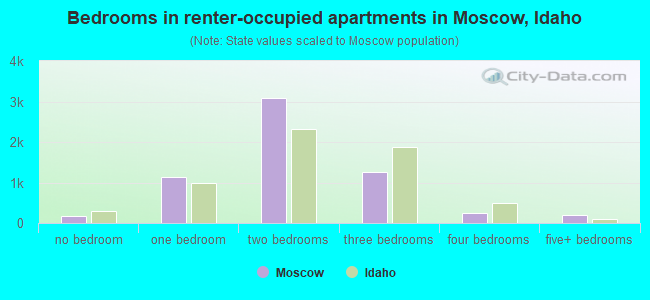
- Bedrooms in renter-occupied apartments in Moscow, Idaho
- 162no bedroom
- 1,1461 bedroom
- 3,0772 bedrooms
- 1,2503 bedrooms
- 2464 bedrooms
- 1875+ bedrooms
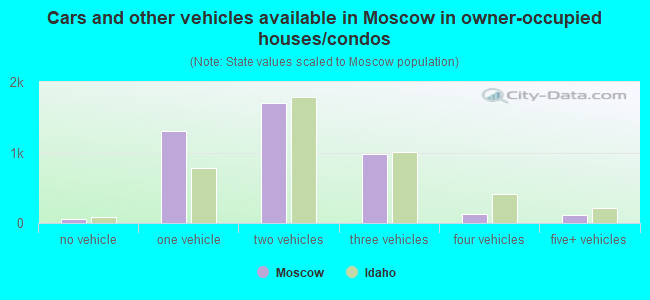
- Cars and other vehicles available in Moscow in owner-occupied houses/condos
- 57no vehicle
- 1,2991 vehicle
- 1,7022 vehicles
- 9853 vehicles
- 1254 vehicles
- 1175+ vehicles
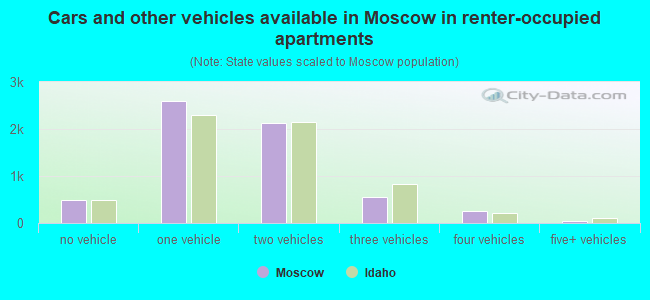
- Cars and other vehicles available in Moscow in renter-occupied apartments
- 485no vehicle
- 2,6051 vehicle
- 2,1292 vehicles
- 5493 vehicles
- 2524 vehicles
- 495+ vehicles
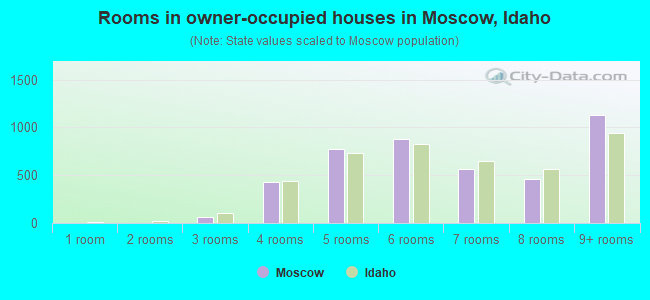
- Rooms in owner-occupied houses in Moscow, Idaho
- 01 room
- 02 rooms
- 593 rooms
- 4244 rooms
- 7705 rooms
- 8776 rooms
- 5637 rooms
- 4628 rooms
- 1,1319+ rooms
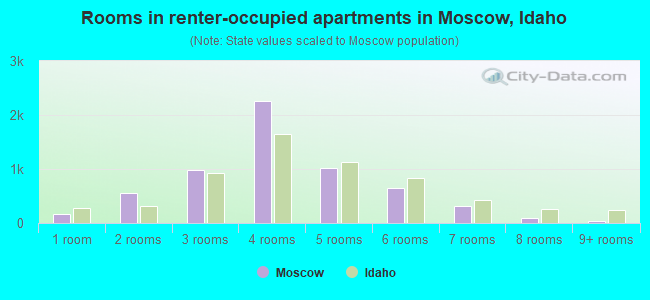
- Rooms in renter-occupied apartments in Moscow, Idaho
- 1621 room
- 5622 rooms
- 9903 rooms
- 2,2534 rooms
- 1,0215 rooms
- 6446 rooms
- 3147 rooms
- 898 rooms
- 349+ rooms
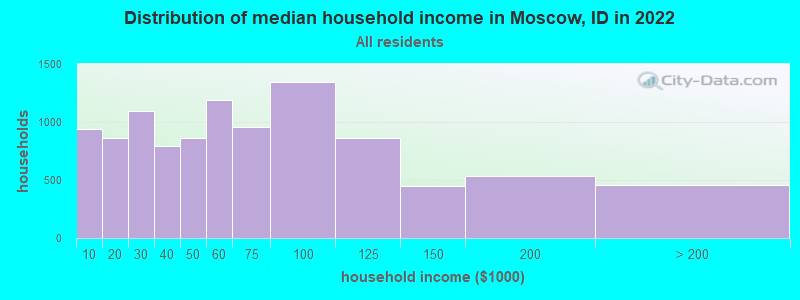
Moscow, ID household income distribution

- 938Less than $10,000
- 858$10,000 to $19,999
- 1,092$20,000 to $29,999
- 791$30,000 to $39,999
- 859$40,000 to $49,999
- 1,191$50,000 to $59,999
- 955$60,000 to $74,999
- 1,347$75,000 to $99,999
- 859$100,000 to $124,999
- 448$125,000 to $149,999
- 533$150,000 to $199,999
- 454$200,000 or more
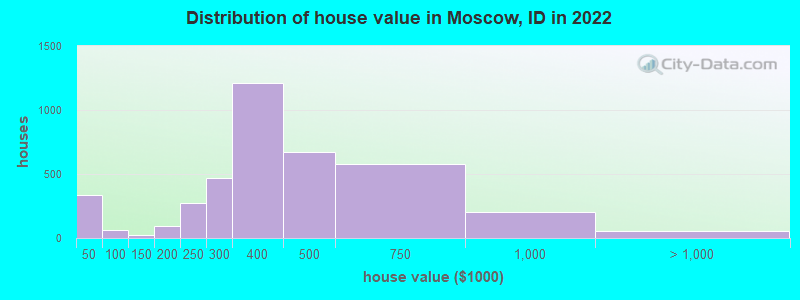
Home value of owner - occupied houses in 2022 in Moscow, ID
-
- 185Less than $10,000
- 69$10,000 to $14,999
- 57$15,000 to $19,999
- 19$20,000 to $24,999
- 2$35,000 to $39,999
- 12$50,000 to $59,999
- 21$60,000 to $69,999
- 19$80,000 to $89,999
- 11$90,000 to $99,999
- 15$100,000 to $124,999
- 11$125,000 to $149,999
- 26$150,000 to $174,999
- 67$175,000 to $199,999
- 274$200,000 to $249,999
- 469$250,000 to $299,999
- 1,207$300,000 to $399,999
- 675$400,000 to $499,999
- 579$500,000 to $749,999
- 201$750,000 to $999,999
- 36$1,000,000 to $1,499,999
- 10$1,500,000 to $1,999,999
- 7$2,000,000 or more
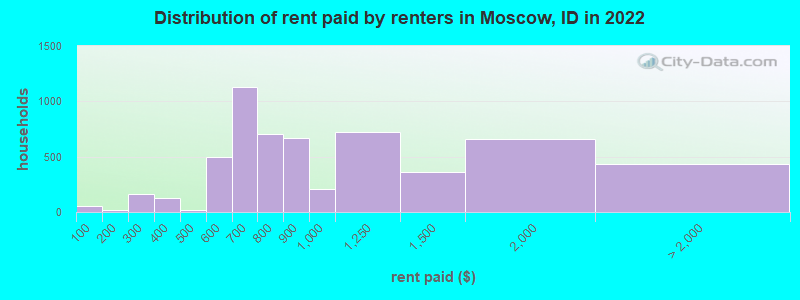
Rent paid by renters in 2022 in Moscow, ID
-
- 51Less than $100
- 7$100 to $149
- 9$150 to $199
- 138$200 to $249
- 23$250 to $299
- 12$300 to $349
- 117$350 to $399
- 20$450 to $499
- 308$500 to $549
- 184$550 to $599
- 489$600 to $649
- 645$650 to $699
- 382$700 to $749
- 323$750 to $799
- 668$800 to $899
- 210$900 to $999
- 720$1,000 to $1,249
- 364$1,250 to $1,499
- 662$1,500 to $1,999
- 295$2,000 to $2,499
- 20$3,500 or more
- 116No cash rent
Percentage of workers working in this county: 80.0%
Number of people working at home: 1,511 (11.2% of all workers)
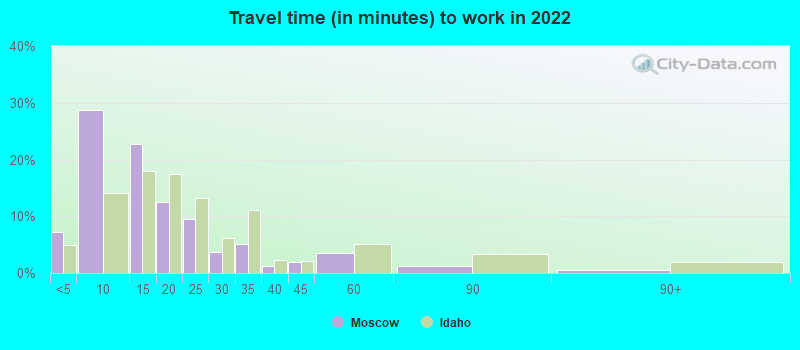
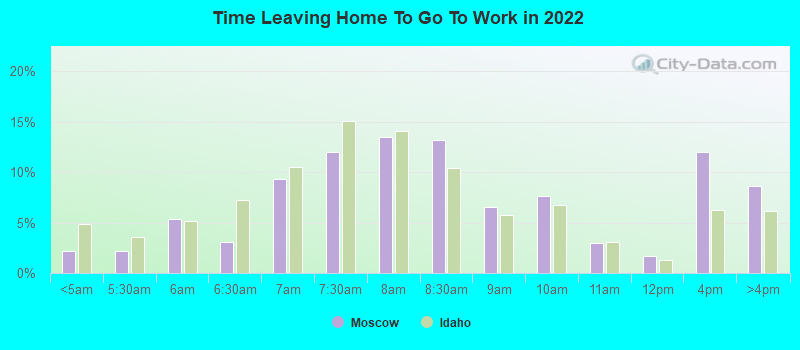
Travel time to work (commute)
- Less than 5 minutes: 815
- 5 to 9 minutes: 3,738
- 10 to 14 minutes: 2,449
- 15 to 19 minutes: 1,391
- 20 to 24 minutes: 1,246
- 25 to 29 minutes: 448
- 30 to 34 minutes: 717
- 35 to 39 minutes: 192
- 40 to 44 minutes: 169
- 45 to 59 minutes: 235
- 60 to 89 minutes: 241
- 90 or more minutes: 33
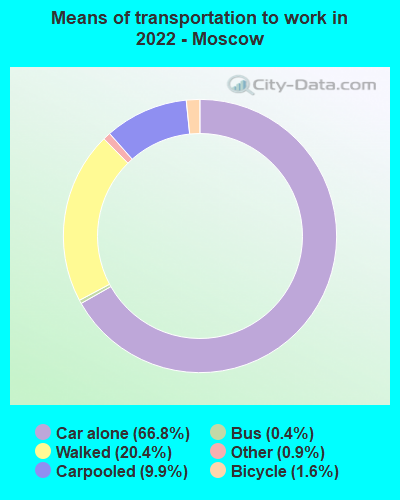
Means of transportation to work:
- Drove a car alone: 8,142 (58.3%)
- Carpooled: 1,289 (9.2%)
- Bus: 51 (0.4%)
- Taxi: 146 (1.0%)
- Bicycle: 196 (1.4%)
- Walked: 2,788 (20.0%)
- Worked at home: 1,511 (10.8%)
- Unemployment by race in 2022
- Unemployment rate for White non-Hispanic residents
- 6.3%Males
- 3.7%Females
- Unemployment rate for Black residents
- 4.0%Males
- Unemployment rate for American Indian and Alaska Native residents
- 26.8%Males
- Unemployment rate for Asian residents
- 3.8%Females
- Unemployment rate for two or more race residents
- 22.3%Males
- Unemployment rate for Hispanic or Latino residents
- 2.8%Males
- 0.6%Females
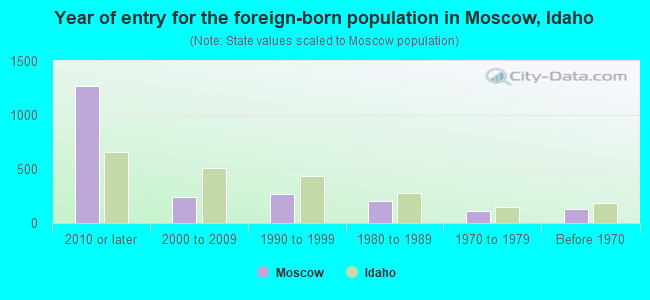
- Year of entry for the foreign-born population in Moscow, Idaho
- 1,2692010 or later
- 2372000 to 2009
- 2731990 to 1999
- 2021980 to 1989
- 1091970 to 1979
- 127Before 1970
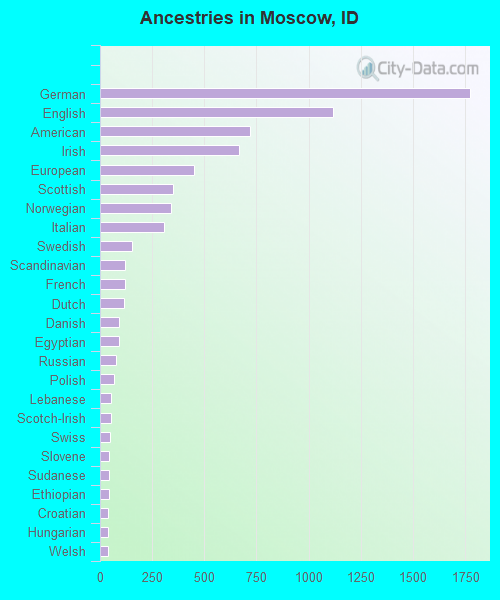
First ancestries reported:
- German: 1,776 (16.9%)
- English: 1,119 (10.7%)
- American: 721 (6.9%)
- Irish: 668 (6.4%)
- European: 453 (4.3%)
- Scottish: 349 (3.3%)
- Norwegian: 342 (3.3%)
- Italian: 308 (2.9%)
- Swedish: 153 (1.5%)
- Scandinavian: 121 (1.2%)
- French: 118 (1.1%)
- Dutch: 116 (1.1%)
- Danish: 92 (0.9%)
- Egyptian: 90 (0.9%)
- Russian: 79 (0.8%)
- Polish: 69 (0.7%)
- Lebanese: 53 (0.5%)
- Scotch-Irish: 53 (0.5%)
- Swiss: 49 (0.5%)
- Slovene: 45 (0.4%)
- Sudanese: 45 (0.4%)
- Ethiopian: 42 (0.4%)
- Croatian: 37 (0.4%)
- Hungarian: 36 (0.3%)
- Welsh: 36 (0.3%)
- Northern European: 34 (0.3%)
- African: 33 (0.3%)
- British: 30 (0.3%)
- French Canadian: 30 (0.3%)
- Portuguese: 24 (0.2%)
- Iranian: 20 (0.2%)
- Czech: 16 (0.2%)
- Canadian: 16 (0.2%)
- Haitian: 15 (0.1%)
- Czechoslovakian: 14 (0.1%)
- Ukrainian: 13 (0.1%)
- Basque: 12 (0.1%)
- Yugoslavian: 12 (0.1%)
- Eastern European: 11 (0.1%)
- Austrian: 10 (0.10%)
- Finnish: 8 (0.08%)
- Jordanian: 7 (0.07%)
- Romanian: 6 (0.06%)
Most common places of birth for foreign-born residents (%):
| Moscow: | 14.1% (229) |
| Idaho: | 2.0% (2,143) |
| Moscow: | 9.9% (161) |
| Idaho: | 0.3% (318) |
| Moscow: | 9.5% (154) |
| Idaho: | 1.7% (1,802) |
| Moscow: | 6.8% (110) |
| Idaho: | 2.1% (2,219) |
| Moscow: | 6.5% (106) |
| Idaho: | 5.2% (5,503) |
| Moscow: | 5.6% (90) |
| Idaho: | 0.6% (679) |
| Moscow: | 5.0% (81) |
| Idaho: | 2.4% (2,535) |
| Moscow: | 4.4% (71) |
| Idaho: | 1.5% (1,595) |
| Moscow: | 4.3% (69) |
| Idaho: | 0.2% (166) |
| Moscow: | 3.5% (56) |
| Idaho: | 1.0% (1,091) |
| Moscow: | 3.5% (56) |
| Idaho: | 1.2% (1,257) |
| Moscow: | 3.3% (53) |
| Idaho: | 1.0% (1,012) |
| Moscow: | 3.2% (51) |
| Idaho: | 0.3% (274) |
| Moscow: | 3.0% (48) |
| Idaho: | 0.2% (235) |
| Moscow: | 2.8% (45) |
| Idaho: | 0.1% (134) |
| Moscow: | 2.5% (41) |
| Idaho: | 0.8% (816) |
| Moscow: | 2.1% (34) |
| Idaho: | 49.9% (53,107) |
| Moscow: | 1.6% (26) |
| Idaho: | 2.1% (2,230) |
Place of birth for U.S.-born residents:
- This state: 9,396
- Other state: 15,359
- Northeast: 954
- Midwest: 2,013
- South: 1,850
- West: 10,534
66.9% of Moscow residents lived in the same house 1 years ago.
Out of people who lived in different houses, 28.1% lived in this county.
Out of people who lived in different counties, 52.9% lived in Idaho.
| Moscow: | 66.9% |
| State average: | 85.1% |
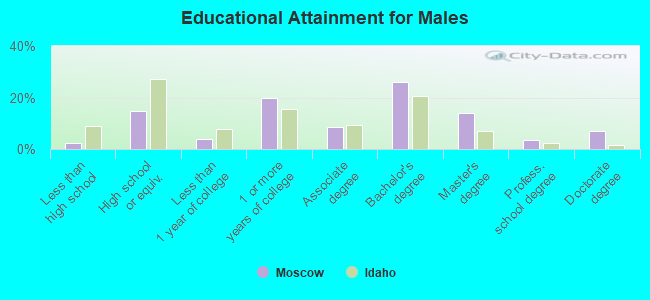
Education attainment for males 25 years and older:
- No schooling: 89
- Nursery to 4th grade: 0
- 5th and 6th grade: 19
- 7th and 8th grade: 0
- 9th grade: 10
- 10th grade: 0
- 11th grade: 29
- 12th grade, no diploma: 14
- High school graduate (or equivalency): 1,037
- Less than 1 year of college: 278
- Some college more than 1 year, no degree: 1,392
- Associate degree: 599
- Bachelor's degree: 1,846
- Master's degree: 992
- Professional school degree: 234
- Doctorate degree: 504
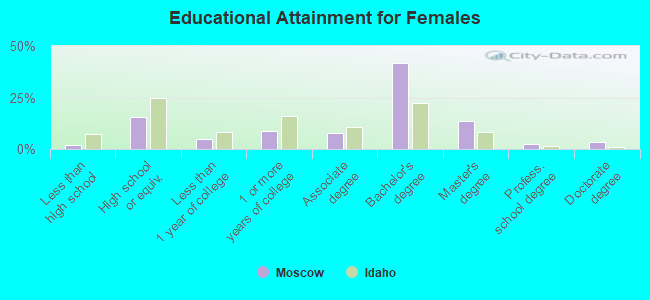
Education attainment for females 25 years and older:
- No schooling: 25
- Nursery to 4th grade: 0
- 5th and 6th grade: 0
- 7th and 8th grade: 4
- 9th grade: 0
- 10th grade: 25
- 11th grade: 23
- 12th grade, no diploma: 50
- High school graduate (or equivalency): 1,025
- Less than 1 year of college: 336
- Some college more than 1 year, no degree: 580
- Associate degree: 508
- Bachelor's degree: 2,740
- Master's degree: 913
- Professional school degree: 145
- Doctorate degree: 227
Housing units in structures:
- One, detached: 4,468
- One, attached: 745
- Two: 608
- 3 or 4: 778
- 5 to 9: 1,208
- 10 to 19: 1,681
- 20 to 49: 571
- 50 or more: 241
- Mobile homes: 549
- Boats, RVs, vans, etc.: 10
Median worth of mobile homes: $19,165
Housing units lacking complete kitchen facilities in 2022: 2.2%
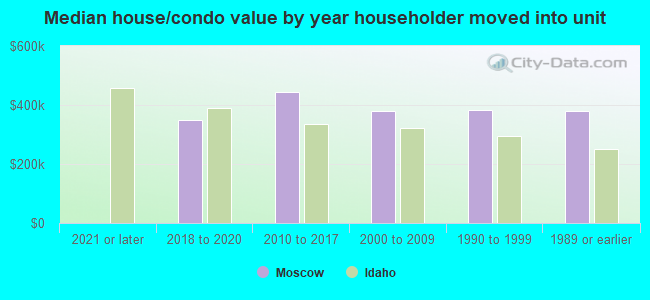
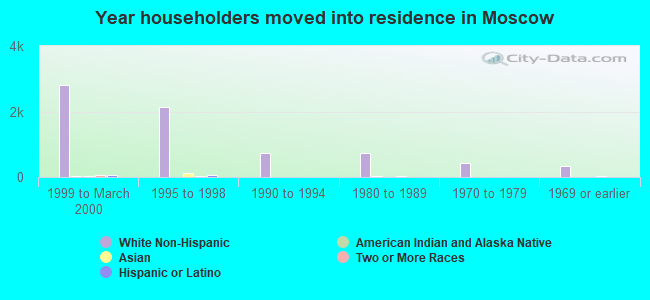
House/condo owner moved in on average 8 years ago
Renter moved in on average 1 years ago
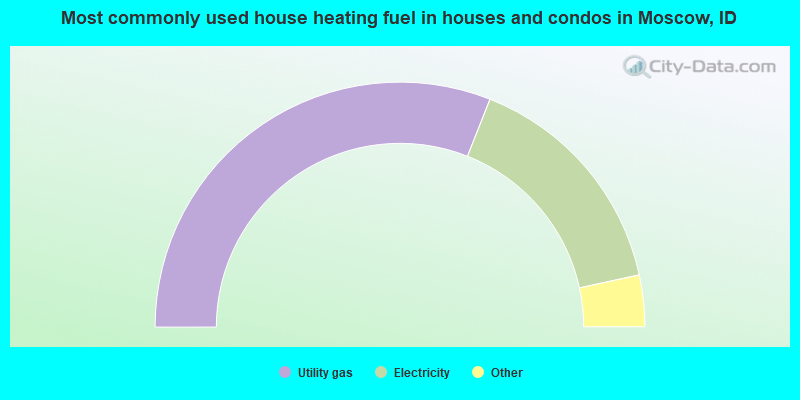
- 62.0%Utility gas
- 31.2%Electricity
- 3.5%Wood
- 2.3%Fuel oil, kerosene, etc.
- 0.7%Bottled, tank, or LP gas
- 0.3%Other fuel
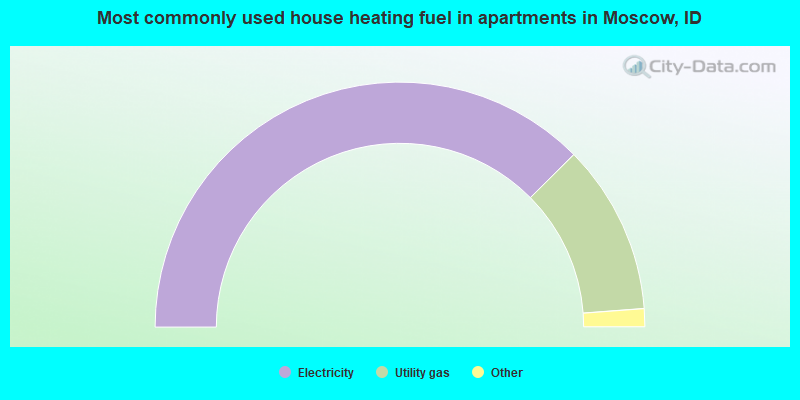
- 75.2%Electricity
- 22.5%Utility gas
- 0.9%Wood
- 0.9%No fuel used
- 0.6%Bottled, tank, or LP gas
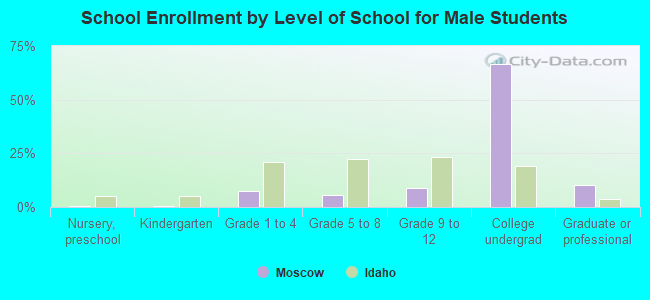
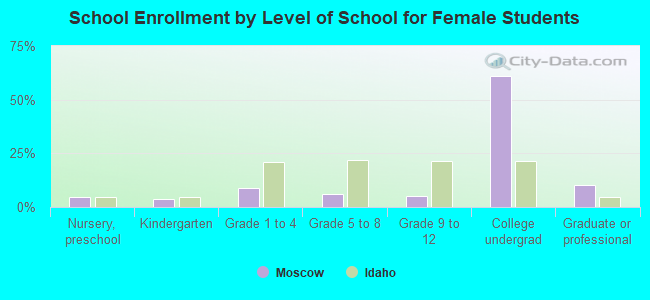
Private vs. public school enrollment:
| Here: | 12.3% |
| Idaho: | 13.5% |
| Here: | 5.7% |
| Idaho: | 8.5% |
| Here: | 1.7% |
| Idaho: | 30.0% |