Needham, MA (Massachusetts) Houses and Residents
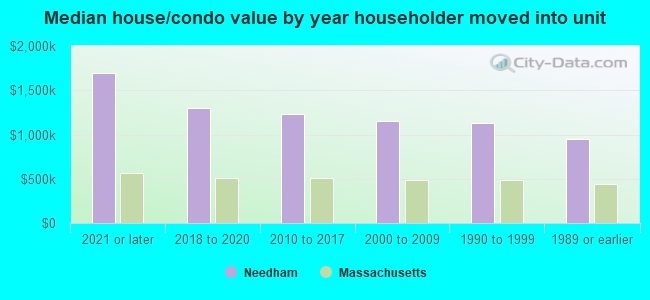
| Needham: | $1,145,339 |
| Massachusetts: | $534,700 |
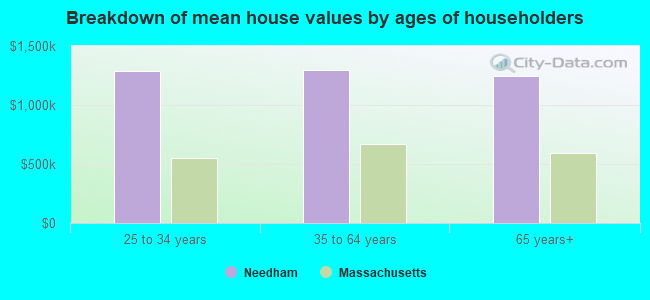
Mean price in 2022:
Detached houses: $1,400,913
Here: $1,400,913 State: $651,570 Townhouses or other attached units: $1,160,605
Here: $1,160,605 State: $617,749 In 2-unit structures: $808,656
Here: $808,656 State: $594,808 In 3-to-4-unit structures: $7,413,080
Here: $7,413,080 State: $601,912 In 5-or-more-unit structures: $582,718
Here: $582,718 State: $555,768
Total population: 28,886 (Urban population: 28,188, Rural population: 723 (all nonfarm))
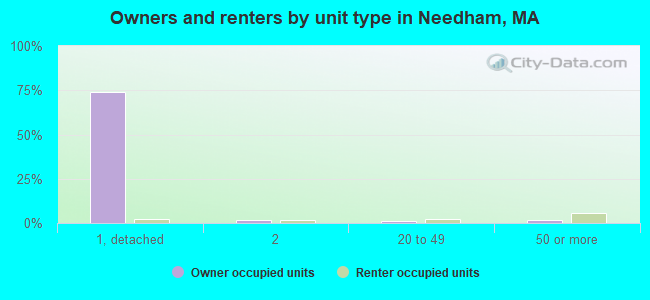
Houses: 11,887 (11,483 occupied: 9,802 owner occupied, 1,620 renter occupied)
| % of renters here: | 14% |
| State: | 38% |
Housing density: 943 houses/condos per square mile
Median price asked for vacant for-sale houses and condos in 2022: $894,731.
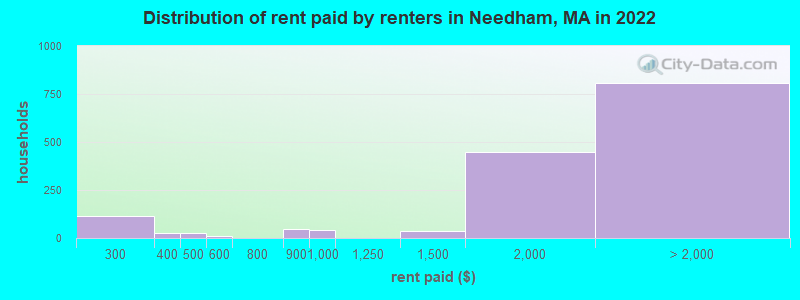
Median contract rent in 2022: $1,959 (lower quartile is $1,561, upper quartile is over $2,000)
Median rent asked for vacant for-rent units in 2022: $1,386
Median gross rent in Needham, MA in 2022: over $2,000
Housing units in Needham with a mortgage: 6,487 (1,383 second mortgage, 26 home equity loan, 1,292 both second mortgage and home equity loan)
Houses without a mortgage: 225
Median household income for houses/condos with a mortgage: $249,907
Median household income for apartments without a mortgage: $133,981
Median monthly housing costs: $3,187
Compare current foreclosures near Needham, MA:
| Photo | Address | Area | Beds / Baths | Price | Details |
|---|---|---|---|---|---|

|
#1
Grv St
Needham, MA 02492
|
6,542 sq. feet
|
4 baths 6 beds |
show details | |

|
#2
Gilbert Rd
Needham, MA 02492
|
1,778 sq. feet
|
2 baths 3 beds |
show details | |

|
#3
Maple St
Needham, MA 02492
|
1,092 sq. feet
|
1 baths 1 beds |
show details | |

|
#4
Charles River St
Needham, MA 02492
|
3,081 sq. feet
|
2 baths 4 beds |
show details | |

|
#5
Grove St
Needham, MA 02492
|
6,542 sq. feet
|
5 baths 7 beds |
show details | |

|
#6
Birds Hill Ave
Needham, MA 02492
|
2,096 sq. feet
|
2 baths 4 beds |
show details | |

|
#7
Canavan Cir
Needham, MA 02492
|
3,180 sq. feet
|
3 baths 4 beds |
show details | |

|
#8
Fairview Rd
Needham, MA 02492
|
- sq. feet
|
- baths - beds |
show details | |

|
#9
South St
Needham, MA 02492
|
- sq. feet
|
- baths - beds |
show details | |

|
#10
Tall Oaks Dr Unit 508
South Weymouth, MA 02190
|
1,300 sq. feet
|
2 baths 2 beds |
$285,000
|
show details |
| Photo | Address | Area | Beds / Baths | Price | Details |
|---|---|---|---|---|---|

|
#11
Boyd St
Boston, MA 02124
|
3,970 sq. feet
|
3 baths 9 beds |
$650,000
|
show details |

|
#12
Johnson Rd
North Weymouth, MA 02191
|
748 sq. feet
|
1 baths 2 beds |
$365,000
|
show details |

|
#13
Stillman St
Framingham, MA 01702
|
1,122 sq. feet
|
1 baths 2 beds |
$418,000
|
show details |

|
#14
Church St
Boston, MA 02122
|
3,663 sq. feet
|
3 baths 6 beds |
show details | |

|
#15
Kendrick Ave Apt 307
Quincy, MA 02169
|
1,234 sq. feet
|
2 baths 2 beds |
show details | |

|
#16
Victoria Cir
Norwood, MA 02062
|
2,980 sq. feet
|
3 baths 5 beds |
show details | |

|
#17
Cora St
Winthrop, MA 02152
|
1,452 sq. feet
|
1 baths 2 beds |
show details | |

|
#18
Deer Path Apt 5
Maynard, MA 01754
|
1,540 sq. feet
|
1 baths 2 beds |
show details | |

|
#19
Eastern Ave
Malden, MA 02148
|
2,288 sq. feet
|
3 baths 4 beds |
show details | |

|
#20
Forest Park Rd
Woburn, MA 01801
|
1,132 sq. feet
|
1 baths 3 beds |
show details |
| Photo | Address | Area | Beds / Baths | Price | Details |
|---|---|---|---|---|---|

|
#21
Cedar St
Ashland, MA 01721
|
2,756 sq. feet
|
3 baths 4 beds |
show details | |

|
#22
S Franklin St
Holbrook, MA 02343
|
940 sq. feet
|
2 baths 2 beds |
show details | |

|
#23
Crestway Rd
Boston, MA 02128
|
1,370 sq. feet
|
2 baths 4 beds |
show details | |

|
#24
Everett Cir
Hopkinton, MA 01748
|
5,180 sq. feet
|
3 baths 4 beds |
show details | |

|
#25
Greendale Ave
Marlborough, MA 01752
|
2,200 sq. feet
|
3 baths 5 beds |
show details | |

|
#26
Brahms St
Roslindale, MA 02131
|
1,604 sq. feet
|
1 baths 4 beds |
show details | |

|
#27
Vinal St
Revere, MA 02151
|
2,715 sq. feet
|
2 baths 4 beds |
show details | |

|
#28
Laarhoven Ter
Stoughton, MA 02072
|
1,034 sq. feet
|
1 baths 3 beds |
show details | |

|
#29
Bainbridge St
Malden, MA 02148
|
1,600 sq. feet
|
1 baths 3 beds |
show details | |

|
#30
Goodnow Ln
Framingham, MA 01702
|
2,342 sq. feet
|
2 baths 4 beds |
show details |
| Photo | Address | Area | Beds / Baths | Price | Details |
|---|---|---|---|---|---|

|
#31
Vernal St
Everett, MA 02149
|
2,601 sq. feet
|
2 baths 5 beds |
show details | |

|
#32
Gallivan Blvd
Boston, MA 02124
|
1,620 sq. feet
|
1 baths 4 beds |
show details | |

|
#33
Gay St
Quincy, MA 02169
|
1,330 sq. feet
|
1 baths 4 beds |
show details | |

|
#34
Lincoln Ave
Saugus, MA 01906
|
1,080 sq. feet
|
1 baths 3 beds |
show details | |

|
#35
Emily Jeffers Rd # L
Randolph, MA 02368
|
1,350 sq. feet
|
1 baths 3 beds |
show details | |

|
#36
Webster St
Randolph, MA 02368
|
1,080 sq. feet
|
1 baths 3 beds |
show details | |

|
#37
Forest St
Boston, MA 02119
|
1,540 sq. feet
|
1 baths 3 beds |
show details | |

|
#38
Magnolia St
Boston, MA 02125
|
3,654 sq. feet
|
3 baths 6 beds |
show details | |

|
#39
Bower St
Medford, MA 02155
|
2,323 sq. feet
|
2 baths 4 beds |
show details | |

|
#40
Ballou St
Quincy, MA 02169
|
1,758 sq. feet
|
1 baths 3 beds |
show details |
| Photo | Address | Area | Beds / Baths | Price | Details |
|---|---|---|---|---|---|

|
#41
Ridgehill Rd
Canton, MA 02021
|
1,196 sq. feet
|
1 baths 3 beds |
show details | |

|
#42
Garden St
Milton, MA 02186
|
1,878 sq. feet
|
1 baths 3 beds |
show details | |

|
#43
Congress Pl
Dedham, MA 02026
|
1,966 sq. feet
|
2 baths 4 beds |
show details | |

|
#44
Savin Hill Avenue, Unit 2 190 Savin Hill Avenue Condominium
Boston, MA 02125
|
1,022 sq. feet
|
1 baths 2 beds |
show details | |

|
#45
Lena Lane Unit 1, 25-27 Lena Lane Condominium
Milford, MA 01757
|
990 sq. feet
|
1 baths 2 beds |
show details | |

|
#46
Thompson Ave
Brockton, MA 02301
|
1,775 sq. feet
|
2 baths 3 beds |
show details | |

|
#47
Baker St
West Roxbury, MA 02132
|
2,614 sq. feet
|
3 baths 4 beds |
show details | |

|
#48
Mill St
Foxboro, MA 02035
|
1,584 sq. feet
|
2 baths 3 beds |
show details | |

|
#49
Colonel Bell Dr # 7
Brockton, MA 02301
|
886 sq. feet
|
1 baths 2 beds |
show details | |

|
Check over 1 million property listings on Foreclosure.com!
|
browse all offers | |||

Latest news about housing in Needham, MA collected exclusively by city-data.com from local newspapers, TV, and radio stations

 | How Much Massachusetts Households Make Per Year: Census Data (37 replies) |
| household income map of Boston area (75 replies) |
| 2024 Real Estate Observations (861 replies) |
| 2023 Real Estate Observations (5278 replies) |
| Housing inventory in Needham/Dover (3 replies) |
| Needham vs. West Rox, Housing Markets (5 replies) |
Median year apartment built: 1972
Household type by relationship:
Households: 32,108- Male householders: 6,593 (697 living alone), Female householders: 4,772 (1,250 living alone)
8,017 spouses (7,961 opposite-sex spouses), 274 unmarried partners, (218 opposite-sex unmarried partners), 10,763 children (10,421 natural, 312 adopted, 30 stepchildren), 246 grandchildren, 24 brothers or sisters, 255 parents, 0 foster children, 108 other relatives, 331 non-relatives
- In group quarters: 721
Size of family households: 3,458 2-persons, 1,672 3-persons, 2,706 4-persons, 799 5-persons, 177 6-persons, 71 7-or-more-persons.
Size of nonfamily households: 2,033 1-person, 300 2-persons, 34 3-persons, 13 4-persons.
7,792 married couples with children.
718 single-parent households (144 men, 574 women).
80.0% of residents of Needham speak English at home.
2.9% of residents speak Spanish at home (87% speak English very well, 10% speak English well, 4% speak English not well).
9.7% of residents speak other Indo-European language at home (74% speak English very well, 19% speak English well, 4% speak English not well, 3% don't speak English at all).
4.4% of residents speak Asian or Pacific Island language at home (68% speak English very well, 25% speak English well, 5% speak English not well, 2% don't speak English at all).
3.0% of residents speak other language at home (72% speak English very well, 9% speak English well, 1% speak English not well, 18% don't speak English at all).
Foreign born population: 5,201 (16.2%)
(71.4% of them are naturalized citizens)
| Here: | 8.0 |
| State: | 6.5 |
| Here: | 3.6 |
| State: | 4.0 |
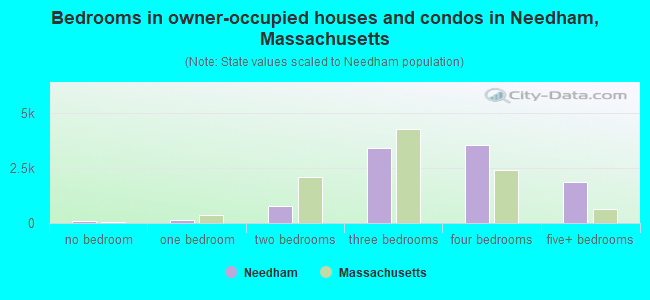
- Bedrooms in owner-occupied houses and condos in Needham, Massachusetts
- 78no bedroom
- 1231 bedroom
- 7922 bedrooms
- 3,4173 bedrooms
- 3,5454 bedrooms
- 1,8475+ bedrooms
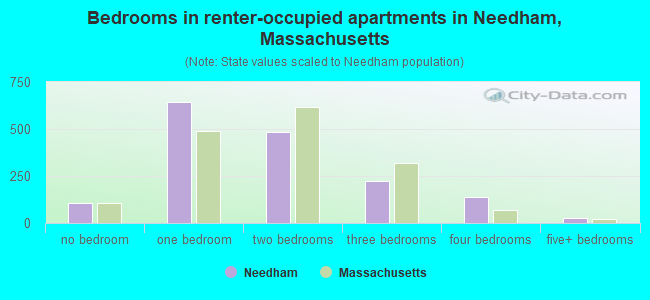
- Bedrooms in renter-occupied apartments in Needham, Massachusetts
- 109no bedroom
- 6411 bedroom
- 4822 bedrooms
- 2263 bedrooms
- 1384 bedrooms
- 245+ bedrooms
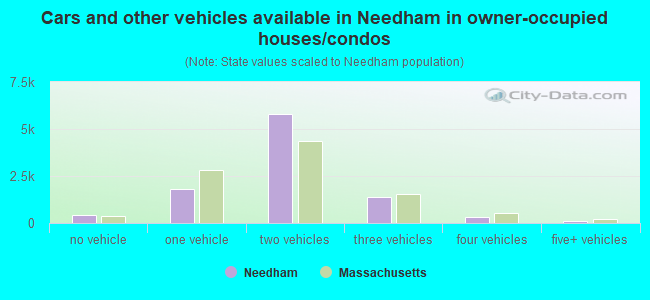
- Cars and other vehicles available in Needham in owner-occupied houses/condos
- 420no vehicle
- 1,8041 vehicle
- 5,8212 vehicles
- 1,3633 vehicles
- 3104 vehicles
- 845+ vehicles
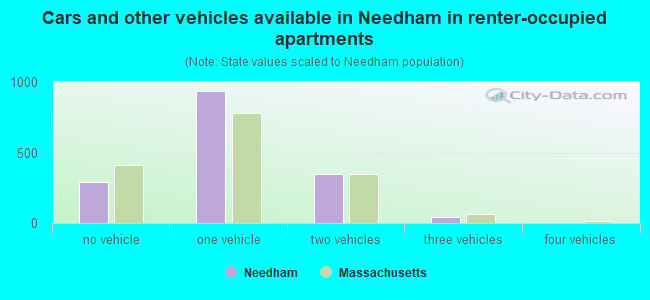
- Cars and other vehicles available in Needham in renter-occupied apartments
- 291no vehicle
- 9371 vehicle
- 3482 vehicles
- 443 vehicles
- 04 vehicles
- 05+ vehicles
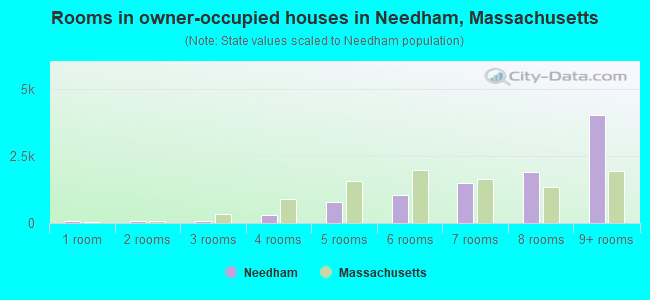
- Rooms in owner-occupied houses in Needham, Massachusetts
- 781 room
- 672 rooms
- 793 rooms
- 3164 rooms
- 7805 rooms
- 1,0466 rooms
- 1,4987 rooms
- 1,9028 rooms
- 4,0379+ rooms
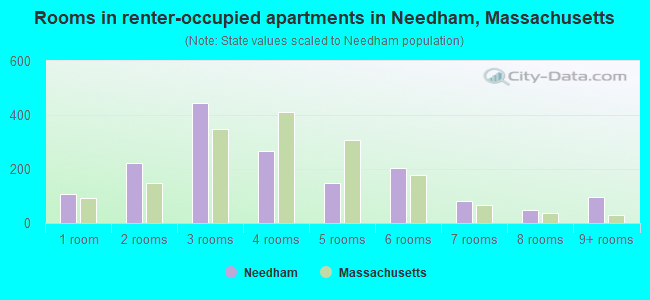
- Rooms in renter-occupied apartments in Needham, Massachusetts
- 1091 room
- 2232 rooms
- 4433 rooms
- 2674 rooms
- 1485 rooms
- 2036 rooms
- 837 rooms
- 498 rooms
- 959+ rooms
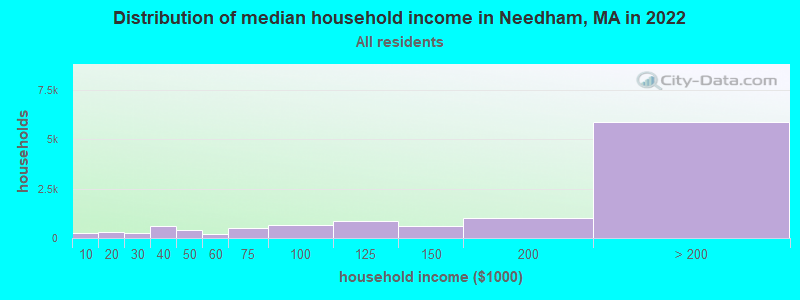
Needham, MA household income distribution

- 238Less than $10,000
- 296$10,000 to $19,999
- 236$20,000 to $29,999
- 618$30,000 to $39,999
- 382$40,000 to $49,999
- 201$50,000 to $59,999
- 502$60,000 to $74,999
- 648$75,000 to $99,999
- 854$100,000 to $124,999
- 604$125,000 to $149,999
- 1,017$150,000 to $199,999
- 5,864$200,000 or more
Home value of owner - occupied houses in 2022 in Needham, MA
-
- 19Less than $10,000
- 24$60,000 to $69,999
- 25$70,000 to $79,999
- 38$100,000 to $124,999
- 25$175,000 to $199,999
- 38$200,000 to $249,999
- 101$250,000 to $299,999
- 89$300,000 to $399,999
- 119$400,000 to $499,999
- 1,098$500,000 to $749,999
- 2,795$750,000 to $999,999
- 4,052$1,000,000 to $1,499,999
- 1,939$1,500,000 to $1,999,999
- 681$2,000,000 or more

Rent paid by renters in 2022 in Needham, MA
-
- 115$250 to $299
- 24$300 to $349
- 25$400 to $449
- 8$550 to $599
- 48$800 to $899
- 40$900 to $999
- 34$1,250 to $1,499
- 446$1,500 to $1,999
- 198$2,000 to $2,499
- 72$2,500 to $2,999
- 140$3,000 to $3,499
- 242$3,500 or more
- 154No cash rent
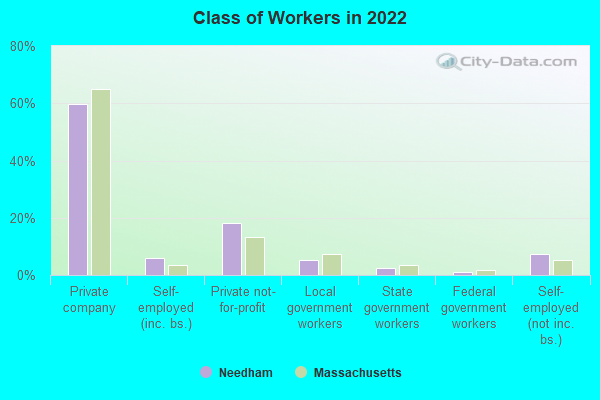
Percentage of workers working in this county: 55.6%
Number of people working at home: 4,980 (31.7% of all workers)
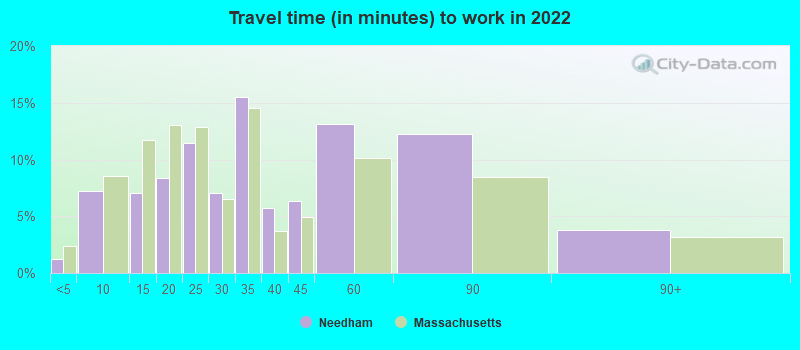
Travel time to work (commute)
- Less than 5 minutes: 210
- 5 to 9 minutes: 1,329
- 10 to 14 minutes: 1,176
- 15 to 19 minutes: 1,418
- 20 to 24 minutes: 929
- 25 to 29 minutes: 536
- 30 to 34 minutes: 1,378
- 35 to 39 minutes: 607
- 40 to 44 minutes: 753
- 45 to 59 minutes: 1,820
- 60 to 89 minutes: 857
- 90 or more minutes: 146
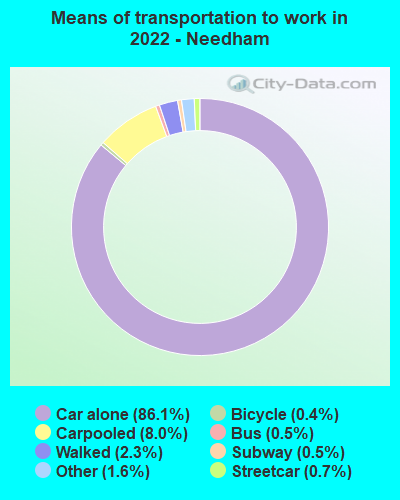
Means of transportation to work:
- Drove a car alone: 14,901 (67.1%)
- Carpooled: 1,357 (6.1%)
- Bus: 60 (0.3%)
- Subway or elevated rail: 116 (0.5%)
- Long-distance train or commuter rail: 95 (0.4%)
- Taxi: 297 (1.3%)
- Bicycle: 43 (0.2%)
- Walked: 383 (1.7%)
- Worked at home: 4,980 (22.4%)
- Unemployment by race in 2022
- Unemployment rate for White non-Hispanic residents
- 4.0%Males
- 5.9%Females
- Unemployment rate for Black residents
- 22.2%Females
- Unemployment rate for Asian residents
- 0.5%Males
- 4.1%Females
- Unemployment rate for two or more race residents
- 3.7%Males
- 4.2%Females
- Unemployment rate for Hispanic or Latino residents
- 6.3%Females
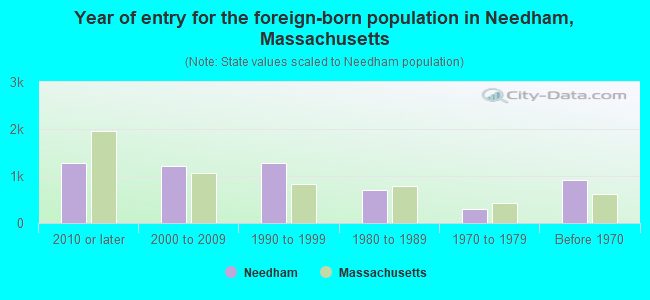
- Year of entry for the foreign-born population in Needham, Massachusetts
- 1,2732010 or later
- 1,2172000 to 2009
- 1,2741990 to 1999
- 6931980 to 1989
- 2971970 to 1979
- 923Before 1970
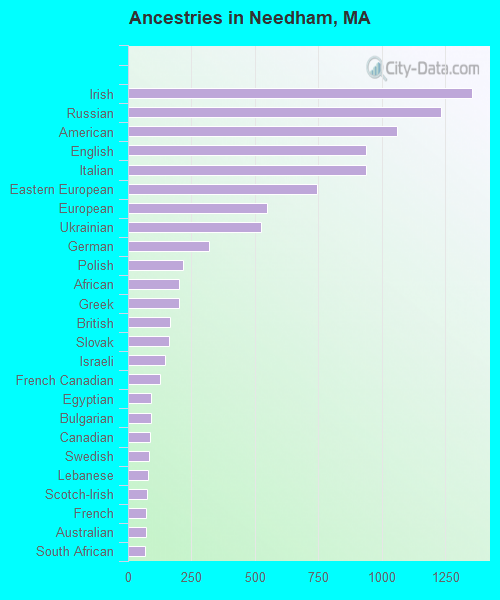
First ancestries reported:
- Irish: 1,354 (9.0%)
- Russian: 1,233 (8.2%)
- American: 1,060 (7.1%)
- English: 938 (6.3%)
- Italian: 936 (6.2%)
- Eastern European: 743 (5.0%)
- European: 546 (3.6%)
- Ukrainian: 523 (3.5%)
- German: 320 (2.1%)
- Polish: 217 (1.4%)
- African: 199 (1.3%)
- Greek: 199 (1.3%)
- British: 167 (1.1%)
- Slovak: 161 (1.1%)
- Israeli: 144 (1.0%)
- French Canadian: 126 (0.8%)
- Egyptian: 90 (0.6%)
- Bulgarian: 89 (0.6%)
- Canadian: 88 (0.6%)
- Swedish: 82 (0.5%)
- Lebanese: 80 (0.5%)
- Scotch-Irish: 75 (0.5%)
- French: 70 (0.5%)
- Australian: 69 (0.5%)
- South African: 68 (0.5%)
- Brazilian: 67 (0.4%)
- Norwegian: 60 (0.4%)
- Scottish: 59 (0.4%)
- Portuguese: 55 (0.4%)
- Northern European: 52 (0.3%)
- Cape Verdean: 49 (0.3%)
- Nigerian: 49 (0.3%)
- Austrian: 40 (0.3%)
- Cypriot: 39 (0.3%)
- Lithuanian: 32 (0.2%)
- Latvian: 31 (0.2%)
- Syrian: 28 (0.2%)
- Armenian: 25 (0.2%)
- Haitian: 25 (0.2%)
- Jamaican: 24 (0.2%)
- Hungarian: 23 (0.2%)
- Finnish: 18 (0.1%)
- Welsh: 17 (0.1%)
- Czech: 15 (0.10%)
- Basque: 15 (0.10%)
- Dutch: 10 (0.07%)
- Romanian: 9 (0.06%)
- U.S. Virgin Islander: 1 (0.01%)
Most common places of birth for foreign-born residents (%):
| Needham: | 11.7% (607) |
| Massachusetts: | 8.4% (103,233) |
| Needham: | 10.9% (563) |
| Massachusetts: | 1.5% (18,278) |
| Needham: | 6.9% (358) |
| Massachusetts: | 6.8% (82,934) |
| Needham: | 6.7% (346) |
| Massachusetts: | 0.9% (10,808) |
| Needham: | 6.4% (329) |
| Massachusetts: | 0.5% (6,073) |
| Needham: | 4.1% (211) |
| Massachusetts: | 1.0% (12,709) |
| Needham: | 3.6% (184) |
| Massachusetts: | 0.5% (5,553) |
| Needham: | 3.5% (182) |
| Massachusetts: | 1.4% (17,613) |
| Needham: | 3.4% (177) |
| Massachusetts: | 0.7% (8,746) |
| Needham: | 3.0% (155) |
| Massachusetts: | 0.3% (4,128) |
| Needham: | 2.9% (151) |
| Massachusetts: | 0.7% (8,536) |
| Needham: | 2.7% (140) |
| Massachusetts: | 2.3% (28,158) |
| Needham: | 2.1% (110) |
| Massachusetts: | 0.8% (10,043) |
| Needham: | 2.1% (109) |
| Massachusetts: | 1.1% (13,065) |
| Needham: | 2.0% (106) |
| Massachusetts: | 0.7% (8,270) |
| Needham: | 1.9% (100) |
| Massachusetts: | 1.0% (12,529) |
| Needham: | 1.8% (95) |
| Massachusetts: | 1.4% (16,886) |
| Needham: | 1.7% (87) |
| Massachusetts: | 1.7% (21,468) |
| Needham: | 1.6% (81) |
| Massachusetts: | 0.5% (6,109) |
Place of birth for U.S.-born residents:
- This state: 17,456
- Other state: 9,074
- Northeast: 5,020
- Midwest: 1,750
- South: 1,421
- West: 841
91.0% of Needham residents lived in the same house 1 years ago.
Out of people who lived in different houses, 26.6% lived in this county.
Out of people who lived in different counties, 55.4% lived in Massachusetts.
| Needham: | 91.0% |
| State average: | 87.7% |
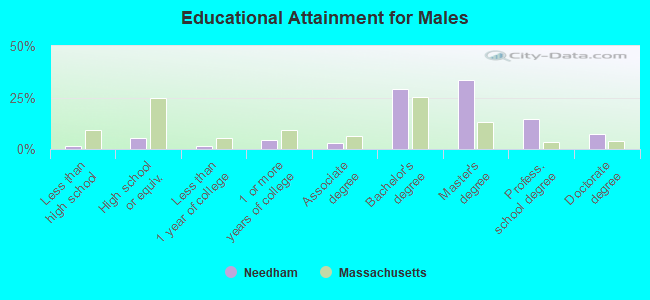
Education attainment for males 25 years and older:
- No schooling: 54
- Nursery to 4th grade: 0
- 5th and 6th grade: 1
- 7th and 8th grade: 15
- 9th grade: 1
- 10th grade: 1
- 11th grade: 23
- 12th grade, no diploma: 31
- High school graduate (or equivalency): 551
- Less than 1 year of college: 153
- Some college more than 1 year, no degree: 462
- Associate degree: 291
- Bachelor's degree: 3,021
- Master's degree: 3,475
- Professional school degree: 1,484
- Doctorate degree: 755
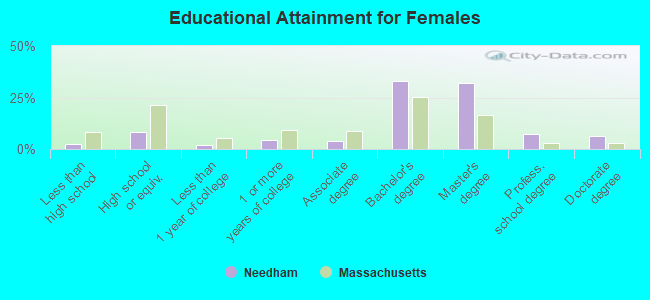
Education attainment for females 25 years and older:
- No schooling: 133
- Nursery to 4th grade: 0
- 5th and 6th grade: 0
- 7th and 8th grade: 0
- 9th grade: 9
- 10th grade: 42
- 11th grade: 10
- 12th grade, no diploma: 96
- High school graduate (or equivalency): 919
- Less than 1 year of college: 211
- Some college more than 1 year, no degree: 471
- Associate degree: 452
- Bachelor's degree: 3,695
- Master's degree: 3,610
- Professional school degree: 843
- Doctorate degree: 733
Housing units in structures:
- One, detached: 9,193
- One, attached: 706
- Two: 377
- 3 or 4: 79
- 5 to 9: 195
- 10 to 19: 156
- 20 to 49: 232
- 50 or more: 933
- Mobile homes: 12
Housing units lacking complete kitchen facilities in 2022: 1.5%
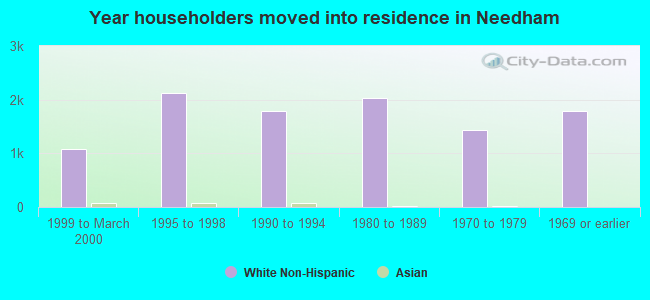
House/condo owner moved in on average 12 years ago
Renter moved in on average 3 years ago
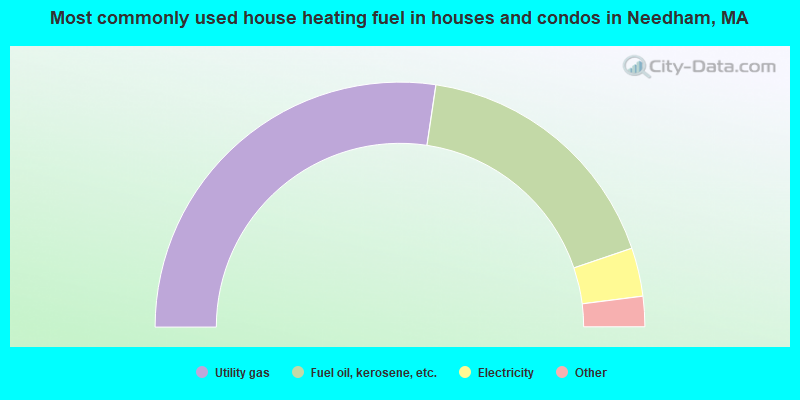
- 54.7%Utility gas
- 34.9%Fuel oil, kerosene, etc.
- 6.4%Electricity
- 2.6%Bottled, tank, or LP gas
- 0.6%Other fuel
- 0.5%No fuel used
- 0.2%Wood
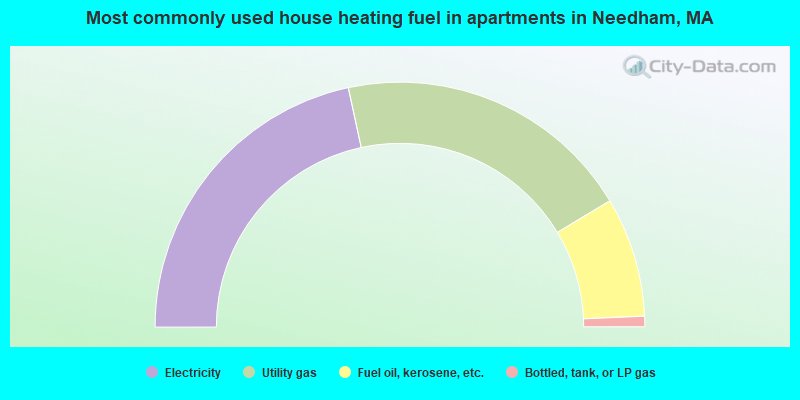
- 43.2%Electricity
- 39.5%Utility gas
- 15.8%Fuel oil, kerosene, etc.
- 1.4%Bottled, tank, or LP gas
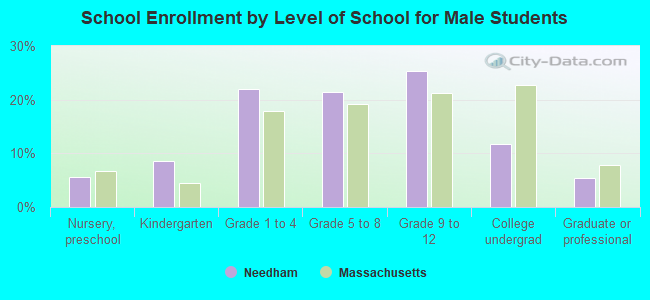
Private vs. public school enrollment:
| Here: | 9.3% |
| Massachusetts: | 10.3% |
| Here: | 18.6% |
| Massachusetts: | 12.3% |
| Here: | 72.5% |
| Massachusetts: | 51.2% |