New Concord, KY (Kentucky) Houses and Residents
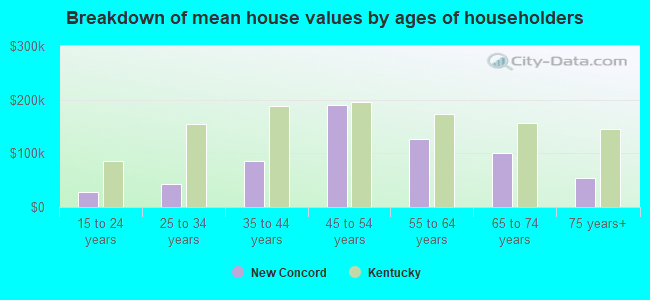
| New Concord: | $153,617 |
| Kentucky: | $196,300 |
Total population: 3,644 (Urban population: 0, Rural population: 3,444 (332 farm, 3,112 nonfarm))
Houses: 2,145 (1,459 occupied: 1,243 owner occupied, 216 renter occupied)
| % of renters here: | 15% |
| State: | 31% |
Housing density: 22 houses/condos per square mile
Median price asked for vacant for-sale houses and condos in 2022 in this county: $142,327.
Median contract rent in 2022: $503 (lower quartile is $428, upper quartile is $716)
Median rent asked for vacant for-rent units in 2022: $374
Median gross rent in New Concord, KY in 2022: $764
Housing units in New Concord with a mortgage: 330 (10 second mortgage, 72 home equity loan, 0 both second mortgage and home equity loan)
Houses without a mortgage: 277


Household type by relationship:
Households: 34,239- In family households: 25,916 (6,718 male householders, 2,300 female householders)
7,146 spouses, 7,930 children (7,193 natural, 212 adopted, 525 stepchildren), 526 grandchildren, 184 brothers or sisters, 175 parents, foster children, 237 other relatives, 586 non-relatives
- In nonfamily households: 8,323 (3,083 male householders (2,379 living alone)), 3,429 female householders (2,837 living alone)), 1,811 nonrelatives
- In group quarters: 2,952 (401 institutionalized population)
4,501 married couples with children.
1,417 single-parent households (314 men, 1,103 women).
96.2% of residents of New Concord speak English at home.
2.4% of residents speak Spanish at home (34% speak English very well, 38% speak English well, 29% speak English not well).
0.8% of residents speak other Indo-European language at home (100% speak English very well).
0.5% of residents speak Asian or Pacific Island language at home (61% speak English very well, 39% speak English not well).
Foreign born population: 68 (1.9%)
(14.7% of them are naturalized citizens)
| Here: | 6.4 |
| State: | 6.4 |
| Here: | 5.0 |
| State: | 4.4 |
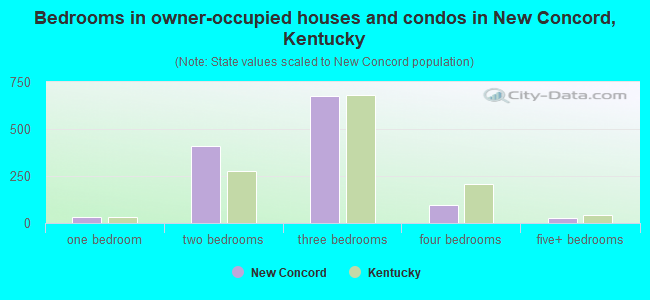
- Bedrooms in owner-occupied houses and condos in New Concord, Kentucky
- 0no bedroom
- 331 bedroom
- 4102 bedrooms
- 6783 bedrooms
- 964 bedrooms
- 265+ bedrooms
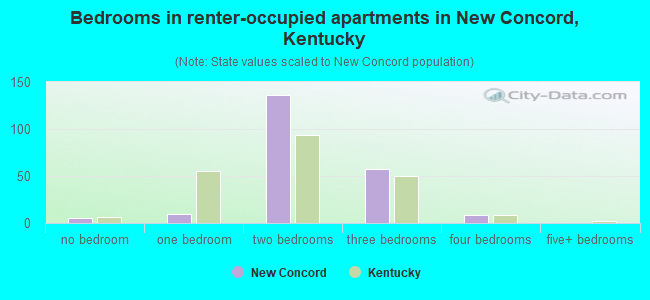
- Bedrooms in renter-occupied apartments in New Concord, Kentucky
- 5no bedroom
- 101 bedroom
- 1362 bedrooms
- 573 bedrooms
- 84 bedrooms
- 05+ bedrooms
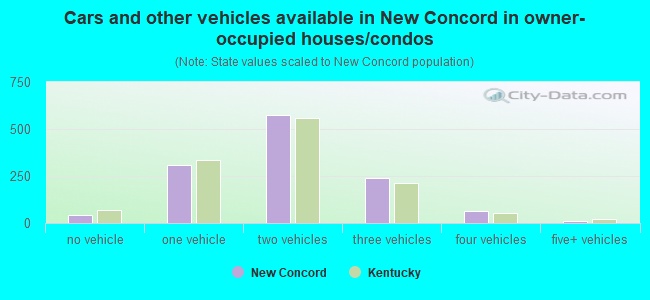
- Cars and other vehicles available in New Concord in owner-occupied houses/condos
- 43no vehicle
- 3091 vehicle
- 5752 vehicles
- 2393 vehicles
- 644 vehicles
- 135+ vehicles
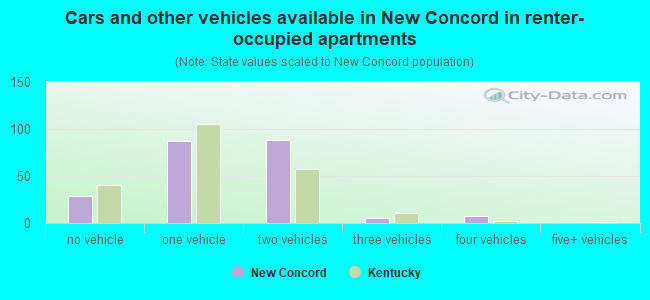
- Cars and other vehicles available in New Concord in renter-occupied apartments
- 29no vehicle
- 871 vehicle
- 882 vehicles
- 53 vehicles
- 74 vehicles
- 05+ vehicles
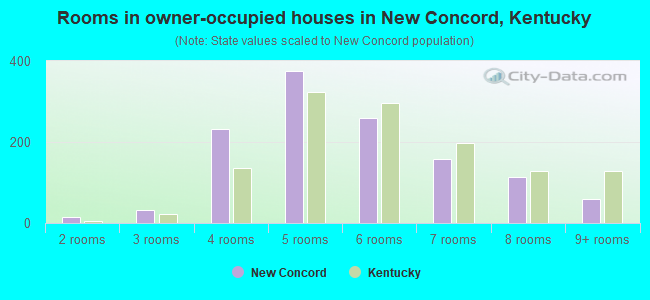
- Rooms in owner-occupied houses in New Concord, Kentucky
- 01 room
- 142 rooms
- 323 rooms
- 2324 rooms
- 3765 rooms
- 2606 rooms
- 1577 rooms
- 1138 rooms
- 599+ rooms
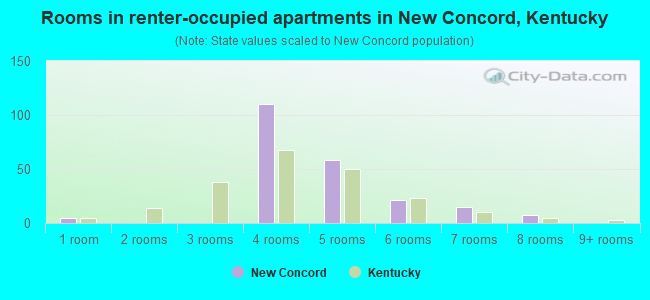
- Rooms in renter-occupied apartments in New Concord, Kentucky
- 51 room
- 02 rooms
- 03 rooms
- 1104 rooms
- 585 rooms
- 216 rooms
- 157 rooms
- 78 rooms
- 09+ rooms
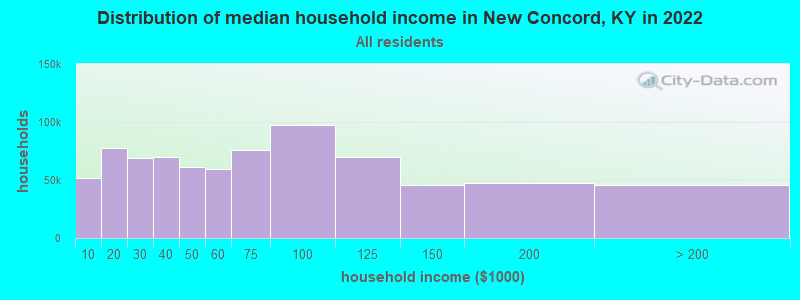
New Concord, KY household income distribution

- 45,258Less than $10,000
- 73,427$10,000 to $19,999
- 61,872$20,000 to $29,999
- 65,553$30,000 to $39,999
- 50,093$40,000 to $49,999
- 55,035$50,000 to $59,999
- 63,137$60,000 to $74,999
- 87,500$75,000 to $99,999
- 62,529$100,000 to $124,999
- 38,366$125,000 to $149,999
- 38,025$150,000 to $199,999
- 32,688$200,000 or more
Percentage of workers working in this county: 80.9%
Number of people working at home: 134 (8.5% of all workers)
Travel time to work (commute)
- Less than 5 minutes: 39
- 5 to 9 minutes: 70
- 10 to 14 minutes: 213
- 15 to 19 minutes: 285
- 20 to 24 minutes: 347
- 25 to 29 minutes: 151
- 30 to 34 minutes: 208
- 35 to 39 minutes: 7
- 40 to 44 minutes: 23
- 45 to 59 minutes: 43
- 60 to 89 minutes: 37
- 90 or more minutes: 30
Means of transportation to work:
- Drove a car alone: 1,219 (80.6%)
- Carpooled: 212 (14.0%)
- Walked: 15 (1.0%)
- Other means: 7 (0.5%)
- Worked at home: 59 (3.9%)
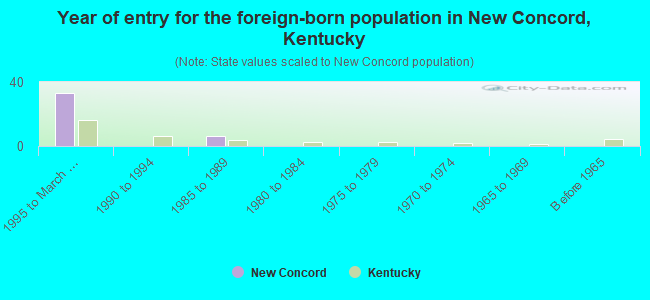
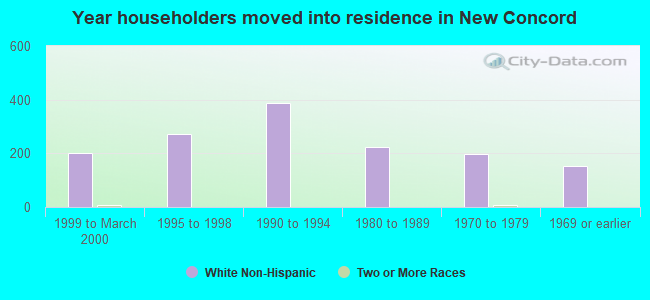
- Year of entry for the foreign-born population in New Concord, Kentucky
- 331995 to March 2000
- 01990 to 1994
- 61985 to 1989
- 01980 to 1984
- 01975 to 1979
- 01970 to 1974
- 01965 to 1969
- 0Before 1965
Most common places of birth for foreign-born residents (%):
| New Concord: | 84.6% (33) |
| Kentucky: | 19.3% (15,511) |
| New Concord: | 15.4% (6) |
| Kentucky: | 0.4% (282) |
Place of birth for U.S.-born residents:
- This state: 1,673
- Other state: 1,703
- Northeast: 100
- Midwest: 924
- South: 563
- West: 116
71% of New Concord residents lived in the same house 5 years ago.
Out of people who lived in different houses, 50% lived in this county.
Out of people who lived in different counties, 26% lived in Kentucky.
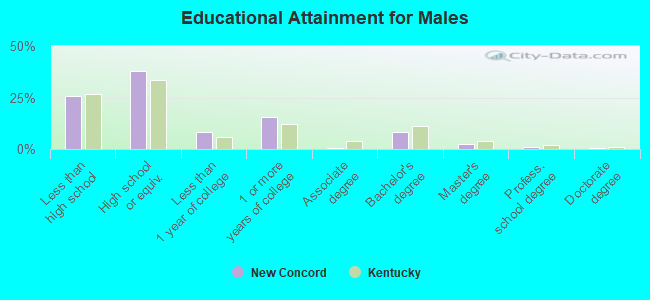
Education attainment for males 25 years and older:
- No schooling: 14
- Nursery to 4th grade: 13
- 5th and 6th grade: 8
- 7th and 8th grade: 82
- 9th grade: 49
- 10th grade: 81
- 11th grade: 36
- 12th grade, no diploma: 39
- High school graduate (or equivalency): 472
- Less than 1 year of college: 105
- Some college more than 1 year, no degree: 194
- Associate degree: 7
- Bachelor's degree: 102
- Master's degree: 31
- Professional school degree: 14
- Doctorate degree: 5
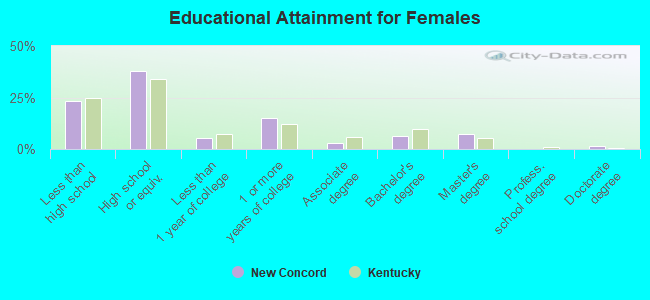
Education attainment for females 25 years and older:
- No schooling: 13
- Nursery to 4th grade: 11
- 5th and 6th grade: 19
- 7th and 8th grade: 62
- 9th grade: 35
- 10th grade: 59
- 11th grade: 76
- 12th grade, no diploma: 14
- High school graduate (or equivalency): 473
- Less than 1 year of college: 65
- Some college more than 1 year, no degree: 187
- Associate degree: 37
- Bachelor's degree: 80
- Master's degree: 92
- Professional school degree: 3
- Doctorate degree: 18
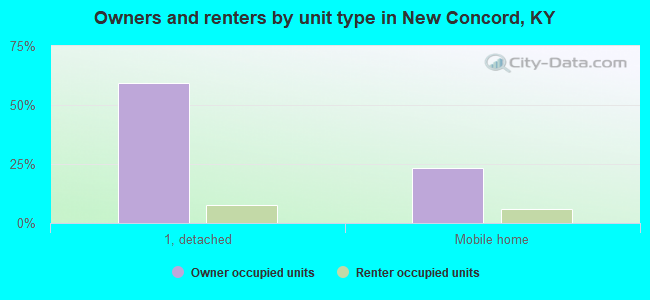
Housing units in structures:
- One, detached: 1,335
- One, attached: 36
- Two: 9
- 50 or more: 5
- Mobile homes: 760
Median worth of mobile homes: $63,813
Housing units lacking complete kitchen facilities: 3.5%
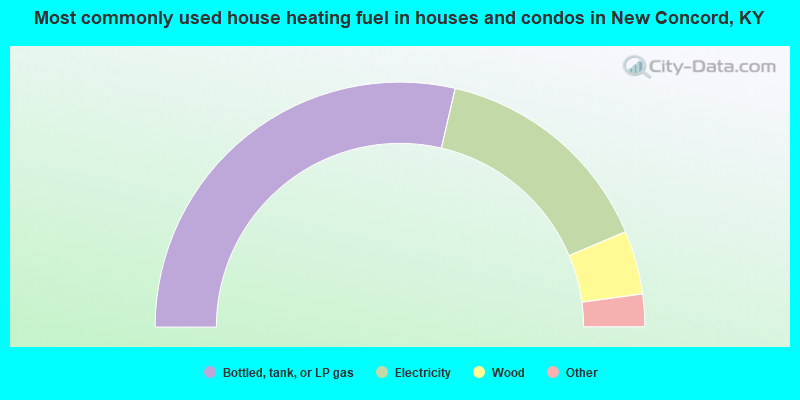
- 57.3%Bottled, tank, or LP gas
- 30.1%Electricity
- 8.4%Wood
- 1.9%Utility gas
- 1.9%Fuel oil, kerosene, etc.
- 0.5%Coal or coke
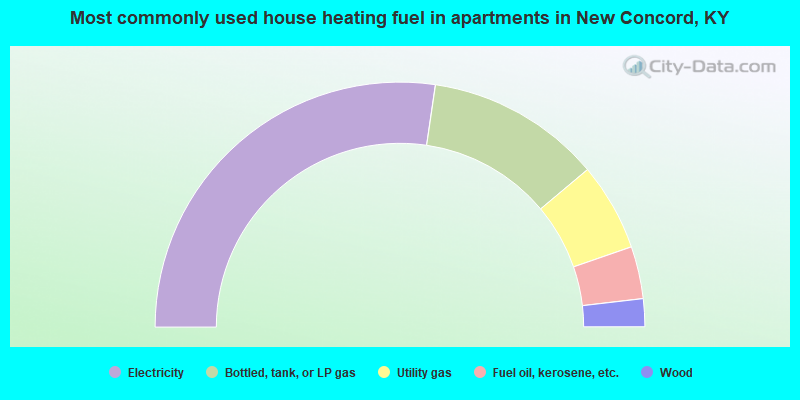
- 54.6%Electricity
- 23.1%Bottled, tank, or LP gas
- 11.6%Utility gas
- 6.9%Fuel oil, kerosene, etc.
- 3.7%Wood
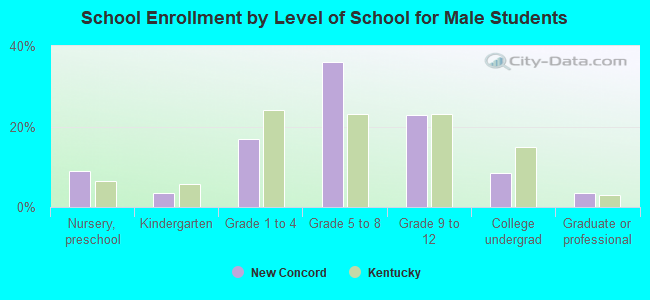
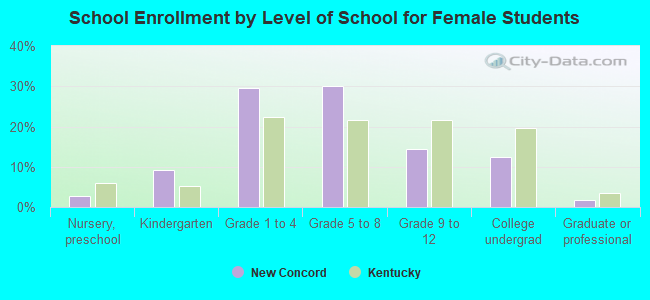
Private vs. public school enrollment:
| Here: | 1.4% |
| Kentucky: | 11.9% |
| Here: | 0.0% |
| Kentucky: | 10.6% |
| Here: | 21.8% |
| Kentucky: | 18.1% |