New Haven, CT (Connecticut) Houses and Residents
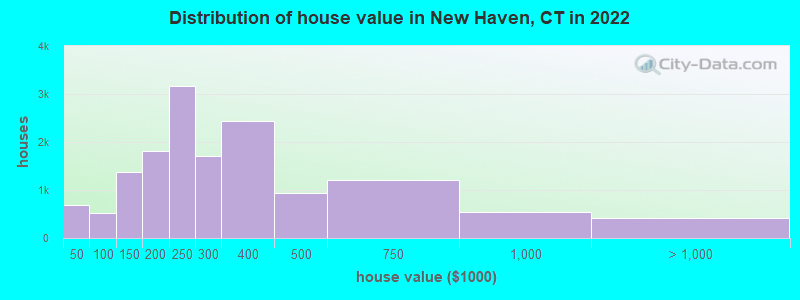
Estimated median house or condo value in 2022: $266,900 (it was $104,300 in 2000 )
New Haven:
$266,900Connecticut:
$347,200
Lower value quartile - upper value quartile: $195,800 - $378,500Mean price in 2022: Detached houses: $351,024 Here:
$351,024State:
$503,946
Townhouses or other attached units: $276,965 Here:
$276,965State:
$304,959
In 2-unit structures: $299,514 Here:
$299,514State:
$304,133
In 3-to-4-unit structures: $261,603 Here:
$261,603State:
$272,970
In 5-or-more-unit structures: $226,280 Here:
$226,280State:
$249,308
Mobile homes: $863,787 Here:
$863,787State:
$151,361
Total population: 130,282 (Urban population: 123,626, Rural population: 0)
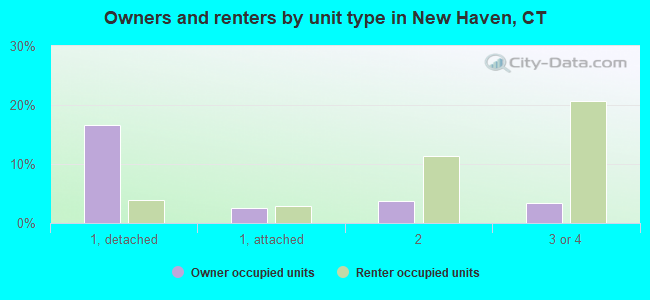
Houses: 61,782 (56,174 occupied: 16,036 owner occupied, 40,138 renter occupied )
% of renters here:
71%State:
34%
Housing density: 3,278 houses/condos per square mile
Median price asked for vacant for-sale houses and condos in 2022: $441,499.
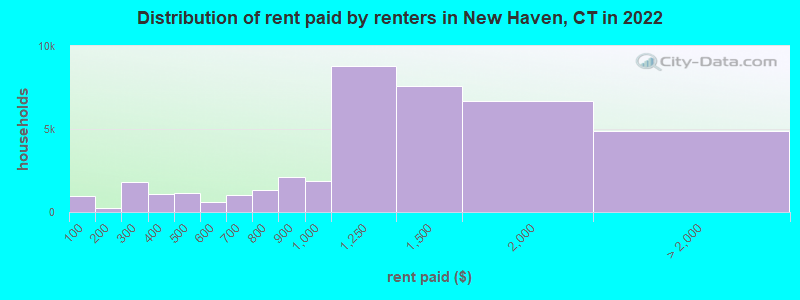
Median contract rent in 2022: $1,214 (lower quartile is $879, upper quartile is $1,574)
Median rent asked for vacant for-rent units in 2022: $1,358
Median gross rent in New Haven, CT in 2022: $1,441
Housing units in New Haven with a mortgage: 10,163 (1,242 second mortgage, 56 home equity loan, 1,028 both second mortgage and home equity loan )Houses without a mortgage: 0
Median household income for houses/condos with a mortgage: $133,554
Median household income for apartments without a mortgage: $112,081
Median monthly housing costs: $1,509
Data:
Median house or condo value ($)
Median house or condo value ($ change since 2000)
Median house or condo value ($) - White
Median house or condo value ($) - Black or African American
Median house or condo value ($) - Asian
Median house or condo value ($) - Hispanic or Latino
Median house or condo value ($) - American Indian and Alaska Native
Median house or condo value ($) - Multirace
Median house or condo value ($) - Other Race
Median price asked for mobile homes ($)
Household density (households per square mile)
Mean house or condo value by units in structure - 1, detached ($)
Mean house or condo value by units in structure - 1, attached ($)
Mean house or condo value by units in structure - 2 ($)
Mean house or condo value by units in structure by units in structure - 3 or 4 ($)
Mean house or condo value by units in structure - 5 or more ($)
Mean house or condo value by units in structure - Boat, RV, van, etc. ($)
Mean house or condo value by units in structure - Mobile home ($)
Median contract rent ($)
Median contract rent - Lower quartile ($)
Median contract rent - Upper quartile ($)
Median gross rent ($)
Urban houses (%)
Rural houses (%)
Houses occupied (%)
Houses occupied (% change since 2000)
Houses owner occupied (%)
Houses owner occupied (% change since 2000)
Houses renter occupied (%)
Houses renter occupied (% change since 2000)
Vacant housing units - For rent (%)
Vacant housing units - For rent (% change since 2000)
Vacant housing units - For sale only (%)
Vacant housing units - For sale only (% change since 2000)
Vacant housing units - Rented or sold, not occupied (%)
Vacant housing units - Rented or sold, not occupied (% change since 2000)
Vacant housing units - For seasonal, recreational, or occasional use (%)
Vacant housing units - For seasonal, recreational, or occasional use (% change since 2000)
Vacant housing units - For migrant workers (%)
Vacant housing units - For migrant workers (% change since 2000)
Vacant housing units - Other vacant (%)
Vacant housing units - Other vacant (% change since 2000)
Median monthly housing costs ($)
Median household income for houses/condos with a mortgage ($)
Median household income for houses/condos without a mortgage ($)
Median household income ($)
Median household income ($) - White
Median household income ($) - Black or African American
Median household income ($) - Asian
Median household income ($) - Hispanic or Latino
Median household income ($) - American Indian and Alaska Native
Median household income ($) - Multirace
Median household income ($) - Other Race
Mortgage status - with mortgage (%)
Mortgage status - with second mortgage (%)
Mortgage status - with home equity loan (%)
Mortgage status - with both second mortgage and home equity loan (%)
Mortgage status - without a mortgage (%)
Median year house/condo built
Median year apartment built
Household type by relationship - Male householder living alone (%)
Household type by relationship - Male householder not living alone (%)
Household type by relationship - Female householder living alone (%)
Household type by relationship - Female householder not living alone (%)
Household type by relationship - Opposite-Sex spouse (%)
Household type by relationship - Same-Sex spouse (%)
Household type by relationship - Opposite-Sex unmarried partner (%)
Household type by relationship - Same-Sex unmarried partner (%)
Household type by relationship - In group quarters (%)
Size of family households - 2-person household (%)
Size of family households - 3-person household (%)
Size of family households - 4-person household (%)
Size of family households - 5-person household (%)
Size of family households - 6-person household (%)
Size of family households - 7-or-more-person household (%)
Size of nonfamily households - 1-person household (%)
Size of nonfamily households - 2-person household (%)
Size of nonfamily households - 3-person household (%)
Size of nonfamily households - 4-person household (%)
Size of nonfamily households - 5-person household (%)
Size of nonfamily households - 6-person household (%)
Size of nonfamily households - 7-or-moreperson household (%)
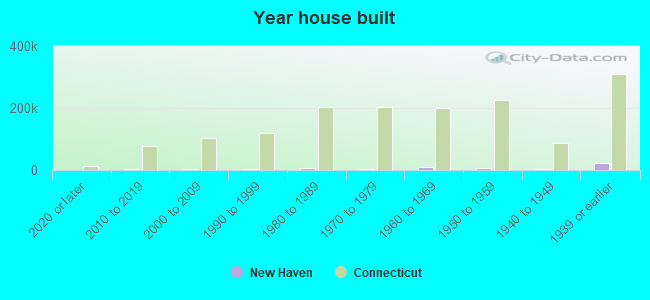
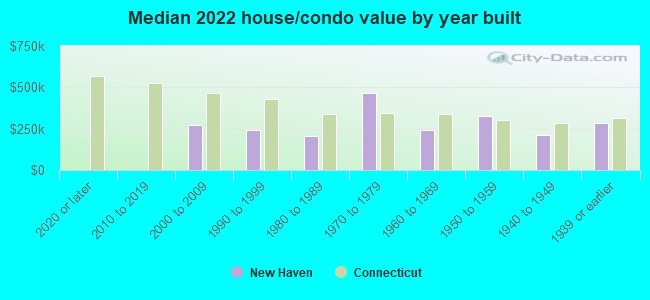
Year house built - Built 2010 or later (%)
Year house built - Built 2000 to 2009 (%)
Year house built - Built 1990 to 1999 (%)
Year house built - Built 1980 to 1989 (%)
Year house built - Built 1970 to 1979 (%)
Year house built - Built 1960 to 1969 (%)
Year house built - Built 1950 to 1959 (%)
Year house built - Built 1940 to 1949 (%)
Year house built - Built 1939 or earlier (%)
Median number of rooms in houses and condos
Median number of rooms in apartments
Median number of bedrooms in owner occupied houses
Mean number of bedrooms in owner occupied houses
Median number of bedrooms in renter occupied houses
Mean number of bedrooms in renter occupied houses
Median number of vehichles in owner occupied houses
Mean number of vehichles in owner occupied houses
Median number of vehichles in renter occupied houses
Mean number of vehichles in renter occupied houses
Rooms in owner-occupied houses - 1 room (%)
Rooms in owner-occupied houses - 2 rooms (%)
Rooms in owner-occupied houses - 3 rooms (%)
Rooms in owner-occupied houses - 4 rooms (%)
Rooms in owner-occupied houses - 5 rooms (%)
Rooms in owner-occupied houses - 6 rooms (%)
Rooms in owner-occupied houses - 7 rooms (%)
Rooms in owner-occupied houses - 8 rooms (%)
Rooms in owner-occupied houses - 9+ rooms (%)
Rooms in renter-occupied houses - 1 room (%)
Rooms in renter-occupied houses - 2 rooms (%)
Rooms in renter-occupied houses - 3 rooms (%)
Rooms in renter-occupied houses - 4 rooms (%)
Rooms in renter-occupied houses - 5 rooms (%)
Rooms in renter-occupied houses - 6 rooms (%)
Rooms in renter-occupied houses - 7 rooms (%)
Rooms in renter-occupied houses - 8 rooms (%)
Rooms in renter-occupied houses - 9+ rooms (%)
Bedrooms in owner-occupied houses - no bedrooms (%)
Bedrooms in owner-occupied houses - 1 bedroom (%)
Bedrooms in owner-occupied houses - 2 bedrooms (%)
Bedrooms in owner-occupied houses - 3 bedrooms (%)
Bedrooms in owner-occupied houses - 4 bedrooms (%)
Bedrooms in owner-occupied houses - 5+ bedrooms (%)
Bedrooms in renter-occupied houses - no bedrooms (%)
Bedrooms in renter-occupied houses - 1 bedroom (%)
Bedrooms in renter-occupied houses - 2 bedrooms (%)
Bedrooms in renter-occupied houses - 3 bedrooms (%)
Bedrooms in renter-occupied houses - 4 bedrooms (%)
Bedrooms in renter-occupied houses - 5+ bedrooms (%)
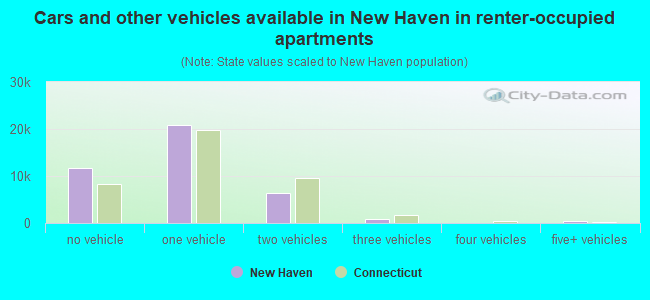
Vehicles available in owner-occupied houses - no vehicle available (%)
Vehicles available in owner-occupied houses - 1 vehicle available(%)
Vehicles available in owner-occupied houses - 2 Vehicles available (%)
Vehicles available in owner-occupied houses - 3 Vehicles available (%)
Vehicles available in owner-occupied houses - 4 Vehicles available (%)
Vehicles available in owner-occupied houses - 5+ Vehicles available (%)
Vehicles available in renter-occupied houses - no vehicle available (%)
Vehicles available in renter-occupied houses - 1 vehicle available (%)
Vehicles available in renter-occupied houses - 2 Vehicles available (%)
Vehicles available in renter-occupied houses - 3 Vehicles available (%)
Vehicles available in renter-occupied houses - 4 Vehicles available (%)
Vehicles available in renter-occupied houses - 5+ Vehicles available (%)
Housing units in structures - 1, detached (%)
Housing units in structures - 1, attached (%)
Housing units in structures - 2 (%)
Housing units in structures - 3 or 4 (%)
Housing units in structures - 5 to 9 (%)
Housing units in structures - 10 to 19 (%)
Housing units in structures - 20 to 49 (%)
Housing units in structures - 50 or more (%)
Housing units in structures - Mobile home (%)
Housing units in structures - Boat, RV, van, etc. (%)
Housing units in structures - Owners - 1, detached (%)
Housing units in structures - Owners - 1, attached (%)
Housing units in structures - Owners - 2 (%)
Housing units in structures - Owners - 3 or 4 (%)
Housing units in structures - Owners - 5 to 9 (%)
Housing units in structures - Owners - 10 to 19 (%)
Housing units in structures - Owners - 20 to 49 (%)
Housing units in structures - Owners - 50 or more (%)
Housing units in structures - Owners - Mobile home (%)
Housing units in structures - Owners - Boat, RV, van, etc. (%)
Housing units in structures - Renters - 1, detached (%)
Housing units in structures - Renters - 1, attached (%)
Housing units in structures - Renters - 2 (%)
Housing units in structures - Renters - 3 or 4 (%)
Housing units in structures - Renters - 5 to 9 (%)
Housing units in structures - Renters - 10 to 19 (%)
Housing units in structures - Renters - 20 to 49 (%)
Housing units in structures - Renters - 50 or more (%)
Housing units in structures - Renters - Mobile home (%)
Housing units in structures - Renters - Boat, RV, van, etc. (%)
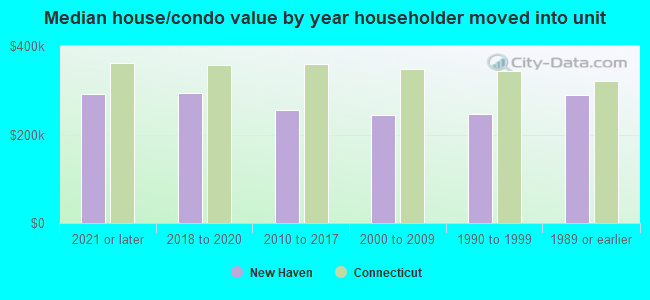
House/condo owner moved in on average (years ago)
Renter moved in on average (years ago)
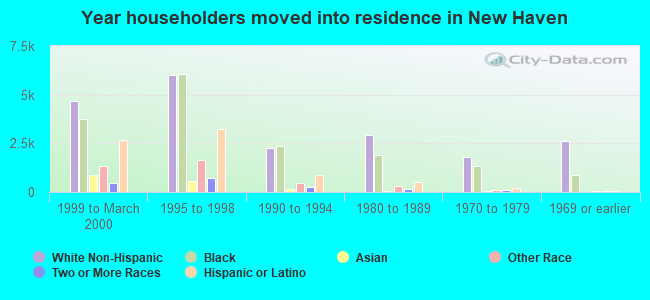
Year householder moved into unit - Moved in 1999 to March 2000 (%)
Year householder moved into unit - Moved in 1999 to March 2000 (%) - White
Year householder moved into unit - Moved in 1999 to March 2000 (%) - Black or African American
Year householder moved into unit - Moved in 1999 to March 2000 (%) - Asian
Year householder moved into unit - Moved in 1999 to March 2000 (%) - Hispanic or Latino
Year householder moved into unit - Moved in 1999 to March 2000 (%) - American Indian and Alaska Native
Year householder moved into unit - Moved in 1999 to March 2000 (%) - Multirace
Year householder moved into unit - Moved in 1999 to March 2000 (%) - Other Race
Year householder moved into unit - Moved in 1995 to 1998 (%)
Year householder moved into unit - Moved in 1995 to 1998 (%) - White
Year householder moved into unit - Moved in 1995 to 1998 (%) - Black or African American
Year householder moved into unit - Moved in 1995 to 1998 (%) - Asian
Year householder moved into unit - Moved in 1995 to 1998 (%) - Hispanic or Latino
Year householder moved into unit - Moved in 1995 to 1998 (%) - American Indian and Alaska Native
Year householder moved into unit - Moved in 1995 to 1998 (%) - Multirace
Year householder moved into unit - Moved in 1995 to 1998 (%) - Other Race
Year householder moved into unit - Moved in 1990 to 1994 (%)
Year householder moved into unit - Moved in 1990 to 1994 (%) - White
Year householder moved into unit - Moved in 1990 to 1994 (%) - Black or African American
Year householder moved into unit - Moved in 1990 to 1994 (%) - Asian
Year householder moved into unit - Moved in 1990 to 1994 (%) - Hispanic or Latino
Year householder moved into unit - Moved in 1990 to 1994 (%) - American Indian and Alaska Native
Year householder moved into unit - Moved in 1990 to 1994 (%) - Multirace
Year householder moved into unit - Moved in 1990 to 1994 (%) - Other Race
Year householder moved into unit - Moved in 1980 to 1989 (%)
Year householder moved into unit - Moved in 1980 to 1989 (%) - White
Year householder moved into unit - Moved in 1980 to 1989 (%) - Black or African American
Year householder moved into unit - Moved in 1980 to 1989 (%) - Asian
Year householder moved into unit - Moved in 1980 to 1989 (%) - Hispanic or Latino
Year householder moved into unit - Moved in 1980 to 1989 (%) - American Indian and Alaska Native
Year householder moved into unit - Moved in 1980 to 1989 (%) - Multirace
Year householder moved into unit - Moved in 1980 to 1989 (%) - Other Race
Year householder moved into unit - Moved in 1970 to 1979 (%)
Year householder moved into unit - Moved in 1970 to 1979 (%) - White
Year householder moved into unit - Moved in 1970 to 1979 (%) - Black or African American
Year householder moved into unit - Moved in 1970 to 1979 (%) - Asian
Year householder moved into unit - Moved in 1970 to 1979 (%) - Hispanic or Latino
Year householder moved into unit - Moved in 1970 to 1979 (%) - American Indian and Alaska Native
Year householder moved into unit - Moved in 1970 to 1979 (%) - Multirace
Year householder moved into unit - Moved in 1970 to 1979 (%) - Other Race
Year householder moved into unit - Moved in 1969 or earlier (%)
Year householder moved into unit - Moved in 1969 or earlier (%) - White
Year householder moved into unit - Moved in 1969 or earlier (%) - Black or African American
Year householder moved into unit - Moved in 1969 or earlier (%) - Asian
Year householder moved into unit - Moved in 1969 or earlier (%) - Hispanic or Latino
Year householder moved into unit - Moved in 1969 or earlier (%) - American Indian and Alaska Native
Year householder moved into unit - Moved in 1969 or earlier (%) - Multirace
Year householder moved into unit - Moved in 1969 or earlier (%) - Other Race
Housing units lacking complete plumbing facilities (%)
Housing units lacking complete kitchen facilities (%)
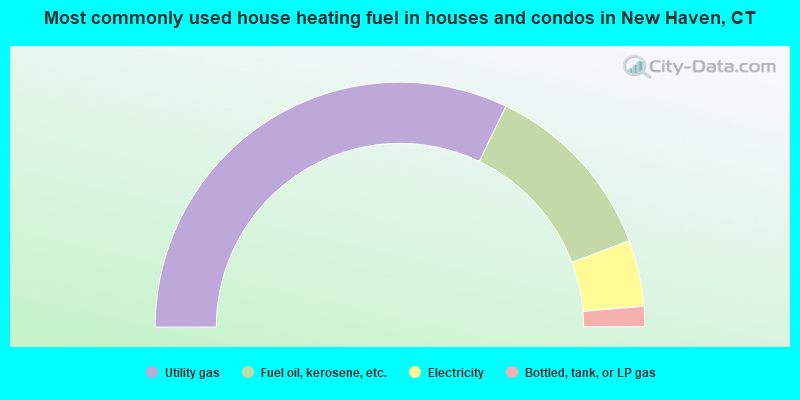
House heating fuel used in houses and condos - Utility gas (%)
House heating fuel used in houses and condos - Bottled, tank, or LP gas (%)
House heating fuel used in houses and condos - Electricity (%)
House heating fuel used in houses and condos - Fuel oil, kerosene, etc. (%)
House heating fuel used in houses and condos - Coal or coke (%)
House heating fuel used in houses and condos - Wood (%)
House heating fuel used in houses and condos - Solar energy (%)
House heating fuel used in houses and condos - Other fuel (%)
House heating fuel used in houses and condos - No fuel used (%)
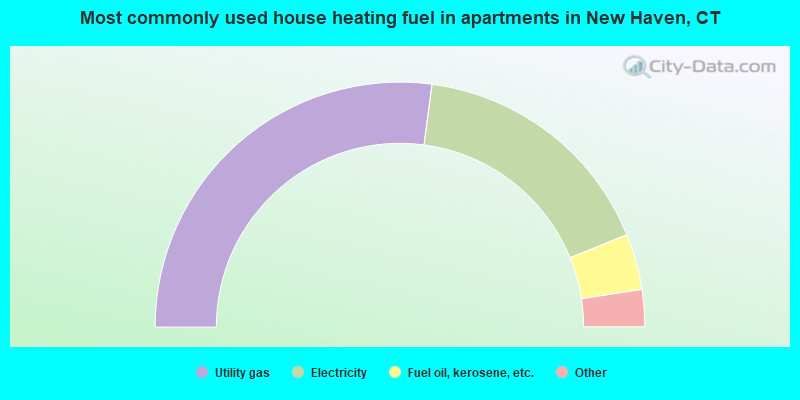
House heating fuel used in apartments - Utility gas (%)
House heating fuel used in apartments - Bottled, tank, or LP gas (%)
House heating fuel used in apartments - Electricity (%)
House heating fuel used in apartments - Fuel oil, kerosene, etc. (%)
House heating fuel used in apartments - Coal or coke (%)
House heating fuel used in apartments - Wood (%)
House heating fuel used in apartments - Solar energy (%)
House heating fuel used in apartments - Other fuel (%)
House heating fuel used in apartments - No fuel used (%)
Median year house/condo built: 1951Median year apartment built: 1959Household type by relationship:
Households: 138,909
Male householders: 24,855 (12,580 living alone ), Female householders: 31,319 (10,816 living alone )13,118 spouses (13,052 opposite-sex spouses ), 3,992 unmarried partners , (3,565 opposite-sex unmarried partners ), 38,635 children (37,779 natural , 78 adopted , 778 stepchildren ), 3,423 grandchildren , 1,266 brothers or sisters , 1,383 parents , 0 foster children , 1,951 other relatives , 6,875 non-relatives In group quarters: 12,092
Size of family households: 10,006 2-persons , 7,111 3-persons , 6,316 4-persons , 1,827 5-persons , 599 6-persons , 623 7-or-more-persons .
Size of nonfamily households: 23,396 1-person , 4,913 2-persons , 719 3-persons , 483 4-persons , 181 6-persons .
10,209 married couples with children. single-parent households (2,888 men , 13,695 women ).
65.8% of residents of New Haven speak English at home. of residents speak Spanish at home (59% speak English very well , 16% speak English well , 16% speak English not well , 9% don't speak English at all ).of residents speak other Indo-European language at home (69% speak English very well , 16% speak English well , 9% speak English not well , 6% don't speak English at all ).of residents speak Asian or Pacific Island language at home (63% speak English very well , 30% speak English well , 7% speak English not well ).of residents speak other language at home (67% speak English very well , 10% speak English well , 20% speak English not well , 3% don't speak English at all ).
Foreign born population: 24,140 (17.4%)of them are naturalized citizens )
Median number of rooms in houses and condos:
Median number of rooms in apartments
Owner-occupied Renter-occupied
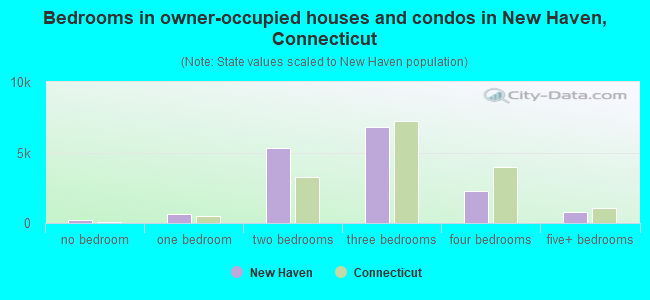
Bedrooms in owner-occupied houses and condos in New Haven, Connecticut
248 no bedroom 625 1 bedroom 5,298 2 bedrooms 6,779 3 bedrooms 2,290 4 bedrooms 796 5+ bedrooms
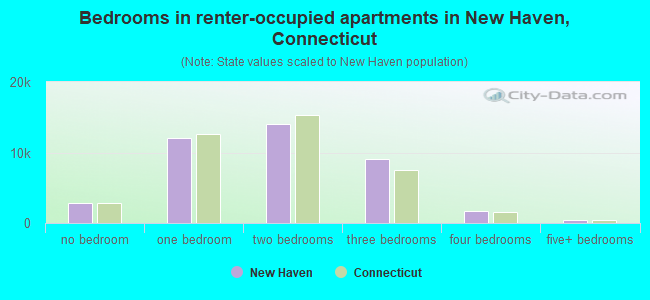
Bedrooms in renter-occupied apartments in New Haven, Connecticut
2,798 no bedroom 11,991 1 bedroom 14,072 2 bedrooms 9,075 3 bedrooms 1,740 4 bedrooms 462 5+ bedrooms
Owner-occupied Renter-occupied
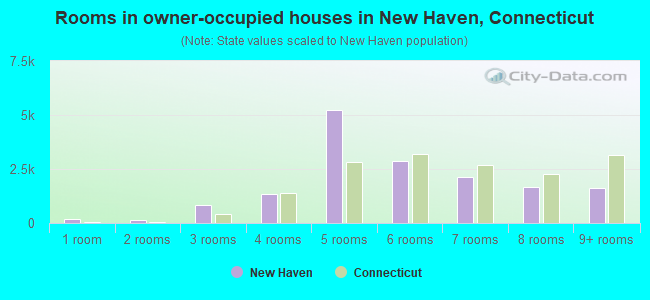
Rooms in owner-occupied houses in New Haven, Connecticut
191 1 room 145 2 rooms 827 3 rooms 1,351 4 rooms 5,249 5 rooms 2,864 6 rooms 2,115 7 rooms 1,677 8 rooms 1,617 9+ rooms
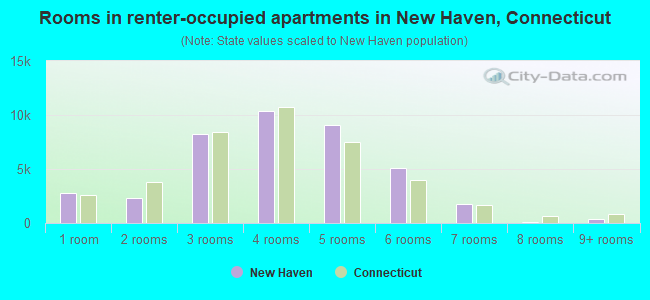
Rooms in renter-occupied apartments in New Haven, Connecticut
2,746 1 room 2,353 2 rooms 8,275 3 rooms 10,338 4 rooms 9,086 5 rooms 5,066 6 rooms 1,800 7 rooms 125 8 rooms 349 9+ rooms
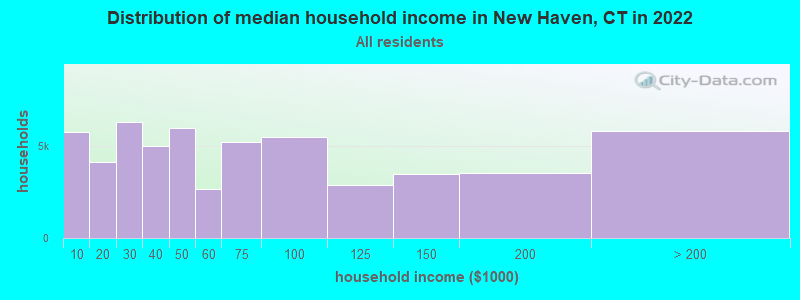
New Haven, CT household income distribution 5,730 Less than $10,0004,123 $10,000 to $19,9996,291 $20,000 to $29,9995,006 $30,000 to $39,9995,968 $40,000 to $49,9992,674 $50,000 to $59,9995,228 $60,000 to $74,9995,463 $75,000 to $99,9992,894 $100,000 to $124,9993,446 $125,000 to $149,9993,529 $150,000 to $199,9995,822 $200,000 or more
Home value of owner - occupied houses in 2022 in New Haven, CT 395 Less than $10,00055 $10,000 to $14,99926 $15,000 to $19,99986 $20,000 to $24,99921 $25,000 to $29,99913 $30,000 to $34,99991 $40,000 to $49,99942 $50,000 to $59,99963 $60,000 to $69,99981 $70,000 to $79,999142 $80,000 to $89,99997 $90,000 to $99,9991,088 $100,000 to $124,999278 $125,000 to $149,999958 $150,000 to $174,999855 $175,000 to $199,9993,166 $200,000 to $249,9991,702 $250,000 to $299,9992,441 $300,000 to $399,999937 $400,000 to $499,9991,200 $500,000 to $749,999532 $750,000 to $999,999213 $1,000,000 to $1,499,99991 $1,500,000 to $1,999,999114 $2,000,000 or moreRent paid by renters in 2022 in New Haven, CT 960 Less than $100263 $100 to $1491,639 $200 to $249178 $250 to $299431 $300 to $349664 $350 to $399632 $400 to $449492 $450 to $499375 $500 to $549207 $550 to $599694 $600 to $649314 $650 to $699681 $700 to $749637 $750 to $7992,125 $800 to $8991,849 $900 to $9998,792 $1,000 to $1,2497,599 $1,250 to $1,4996,709 $1,500 to $1,9992,388 $2,000 to $2,499786 $2,500 to $2,999383 $3,000 to $3,499562 $3,500 or more778 No cash rent
Percentage of workers working in this county: 85.8%Number of people working at home: 9,886 (15.1% of all workers )
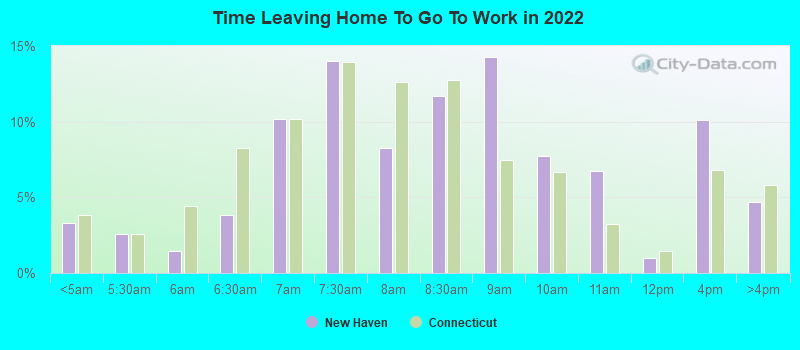
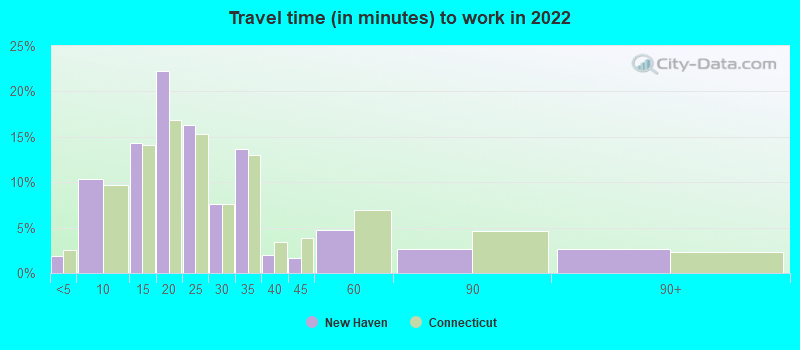
Travel time to work (commute)
Less than 5 minutes: 1,3575 to 9 minutes: 7,36810 to 14 minutes: 9,67915 to 19 minutes: 14,56120 to 24 minutes: 7,85925 to 29 minutes: 2,65930 to 34 minutes: 5,97635 to 39 minutes: 1,16240 to 44 minutes: 66745 to 59 minutes: 2,67160 to 89 minutes: 1,53590 or more minutes: 229
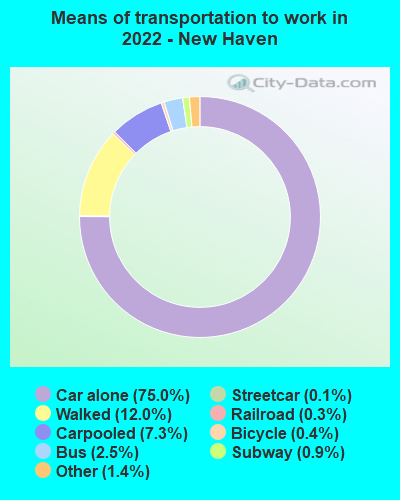
Means of transportation to work:
Drove a car alone: 65,554 (67.4%)Carpooled: 6,373 (6.6%)Bus : 2,144 (2.2%)Subway or elevated rail : 113 (0.1%)Long-distance train or commuter rail : 780 (0.8%)Light rail, streetcar or trolley : 291 (0.3%)Taxi: 1,256 (1.3%)Bicycle: 379 (0.4%)Walked: 10,482 (10.8%)Worked at home: 9,886 (10.2%)
Unemployment by race in 2022
Unemployment rate for White non-Hispanic residents 4.4% Males2.0% FemalesUnemployment rate for Black residents 15.0% Males4.1% FemalesUnemployment rate for Asian residents 1.9% Males4.1% FemalesUnemployment rate for other race residents 8.0% Males11.6% FemalesUnemployment rate for two or more race residents 16.8% Males1.4% FemalesUnemployment rate for Hispanic or Latino residents 9.8% Males5.5% Females
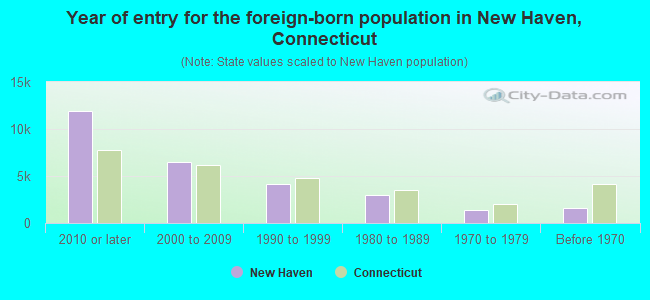
Year of entry for the foreign-born population in New Haven, Connecticut
11,901 2010 or later 6,460 2000 to 2009 4,179 1990 to 1999 2,939 1980 to 1989 1,429 1970 to 1979 1,620 Before 1970
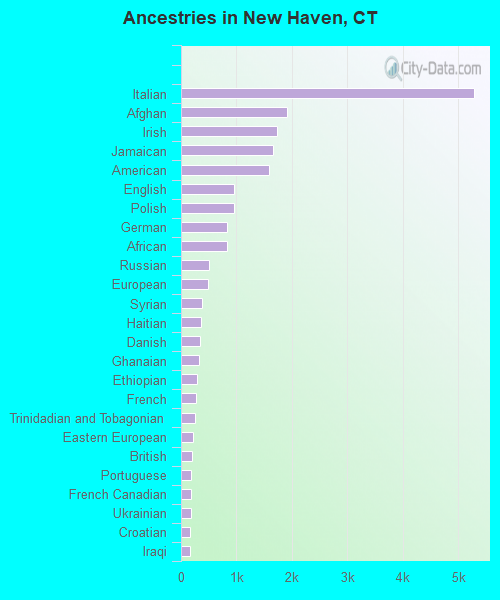
First ancestries reported:
Italian: 5,287 (6.4%)
Afghan: 1,914 (2.3%)
Irish: 1,728 (2.1%)
Jamaican: 1,667 (2.0%)
American: 1,591 (1.9%)
English: 958 (1.2%)
Polish: 948 (1.1%)
German: 829 (1.0%)
African: 828 (1.0%)
Russian: 509 (0.6%)
European: 483 (0.6%)
Syrian: 376 (0.5%)
Haitian: 356 (0.4%)
Danish: 339 (0.4%)
Ghanaian: 316 (0.4%)
Ethiopian: 290 (0.4%)
French: 274 (0.3%)
Trinidadian and Tobagonian: 249 (0.3%)
Eastern European: 221 (0.3%)
British: 197 (0.2%)
Portuguese: 188 (0.2%)
French Canadian: 180 (0.2%)
Ukrainian: 174 (0.2%)
Croatian: 169 (0.2%)
Iraqi: 163 (0.2%)
Arab: 153 (0.2%)
Guyanese: 142 (0.2%)
Scottish: 134 (0.2%)
Dutch: 127 (0.2%)
Nigerian: 126 (0.2%)
Canadian: 117 (0.1%)
Brazilian: 115 (0.1%)
Cape Verdean: 107 (0.1%)
Greek: 106 (0.1%)
Norwegian: 104 (0.1%)
Hungarian: 98 (0.1%)
Slovak: 96 (0.1%)
British West Indian: 95 (0.1%)
Swedish: 84 (0.1%)
Moroccan: 75 (0.09%)
Serbian: 74 (0.09%)
Scotch-Irish: 69 (0.08%)
Kenyan: 62 (0.08%)
Latvian: 60 (0.07%)
Israeli: 59 (0.07%)
South African: 59 (0.07%)
Czech: 57 (0.07%)
Zimbabwean: 53 (0.06%)
Egyptian: 48 (0.06%)
Lithuanian: 43 (0.05%)
Lebanese: 43 (0.05%)
Austrian: 43 (0.05%)
Swiss: 40 (0.05%)
Iranian: 39 (0.05%)
Northern European: 38 (0.05%)
Turkish: 34 (0.04%)
Liberian: 34 (0.04%)
Yugoslavian: 34 (0.04%)
West Indian: 33 (0.04%)
Scandinavian: 28 (0.03%)
Welsh: 28 (0.03%)
Finnish: 27 (0.03%)
Slavic: 22 (0.03%)
Pennsylvania German: 20 (0.02%)
Armenian: 20 (0.02%)
Romanian: 19 (0.02%)
Albanian: 19 (0.02%)
Palestinian: 17 (0.02%)
Jordanian: 10 (0.01%)
Australian: 9 (0.01%)
Sudanese: 8 (0.01%)
U.S. Virgin Islander: 7 (0.01%)
Most common places of birth for foreign-born residents (%): Mexico New Haven:
14.7% (3,648)Connecticut:
4.8% (25,802)
Afghanistan New Haven:
8.9% (2,222)Connecticut:
0.4% (1,946)
Jamaica New Haven:
7.4% (1,829)Connecticut:
7.5% (40,568)
China, excluding Hong Kong and Taiwan New Haven:
7.0% (1,739)Connecticut:
4.4% (24,001)
Ecuador New Haven:
6.1% (1,527)Connecticut:
4.4% (24,026)
Guatemala New Haven:
5.7% (1,409)Connecticut:
3.2% (17,617)
Dominican Republic New Haven:
3.5% (877)Connecticut:
5.0% (27,361)
Colombia New Haven:
2.9% (729)Connecticut:
3.3% (18,124)
Russia New Haven:
2.4% (601)Connecticut:
1.2% (6,448)
India New Haven:
2.4% (597)Connecticut:
7.3% (39,879)
Canada New Haven:
2.2% (547)Connecticut:
2.3% (12,380)
Korea New Haven:
2.2% (547)Connecticut:
1.4% (7,495)
Nigeria New Haven:
1.5% (378)Connecticut:
0.6% (3,109)
Place of birth for U.S.-born residents:
This state: 63,654Other state: 41,991Northeast: 22,191Midwest: 6,763South: 9,075West: 3,962 84.1% of New Haven residents lived in the same house 1 years ago.
Out of people who lived in different houses, 26.1% lived in this county.
Out of people who lived in different counties, 12.6% lived in Connecticut.
New Haven:
84.1%State average:
88.4%
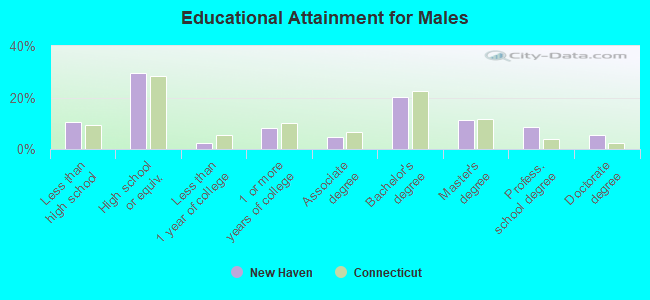
Education attainment for males 25 years and older:
No schooling: 456Nursery to 4th grade: 6655th and 6th grade: 6917th and 8th grade: 09th grade: 78710th grade: 59211th grade: 45012th grade, no diploma: 679High school graduate (or equivalency): 12,258Less than 1 year of college: 1,019Some college more than 1 year, no degree: 3,327Associate degree: 1,980Bachelor's degree: 8,418Master's degree: 4,631Professional school degree: 3,485Doctorate degree: 2,286
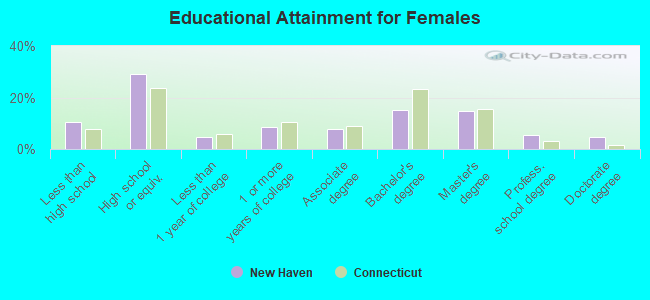
Education attainment for females 25 years and older:
No schooling: 570Nursery to 4th grade: 1045th and 6th grade: 6197th and 8th grade: 2289th grade: 54610th grade: 30111th grade: 1,75312th grade, no diploma: 342High school graduate (or equivalency): 12,384Less than 1 year of college: 1,917Some college more than 1 year, no degree: 3,685Associate degree: 3,268Bachelor's degree: 6,404Master's degree: 6,322Professional school degree: 2,356Doctorate degree: 1,997
Housing units in structures:
One, detached: 13,240One, attached: 2,975Two: 9,5993 or 4: 14,4585 to 9: 4,28510 to 19: 2,79620 to 49: 4,95050 or more: 9,409Mobile homes: 70Housing units lacking complete plumbing facilities in 2022: 0.3%Housing units lacking complete kitchen facilities in 2022: 0.8%House/condo owner moved in on average 12 years ago
Renter moved in on average 3 years ago
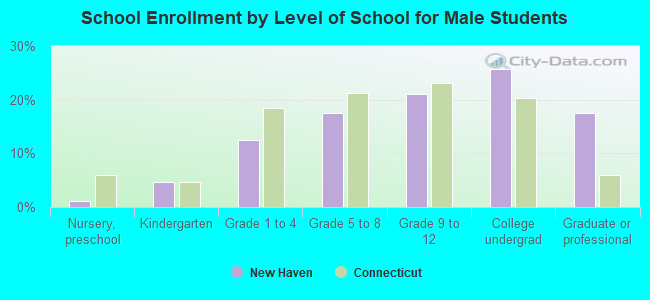
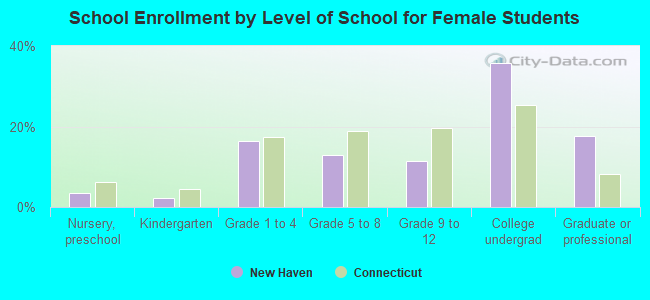
Private vs. public school enrollment:
Students in private schools in grades 1 to 8 (elementary and middle school): 1,530 Here:
10.8%Connecticut:
9.5%
Students in private schools in grades 9 to 12 (high school): 1,301 Here:
17.3%Connecticut:
12.9%
Students in private undergraduate colleges: 8,763 Here:
58.6%Connecticut:
35.5%