Norfolk, MA (Massachusetts) Houses and Residents
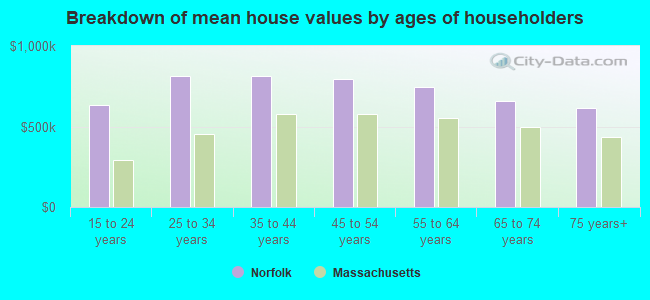
| Norfolk: | $786,541 |
| Massachusetts: | $534,700 |
Total population: 11,227 (Urban population: 8,832, Rural population: 1,628 (all nonfarm))
Houses: 2,861 (2,818 occupied: 2,603 owner occupied, 215 renter occupied)
| % of renters here: | 8% |
| State: | 38% |
Housing density: 193 houses/condos per square mile
Median price asked for vacant for-sale houses and condos in 2022 in this county: $751,928.
Median contract rent in 2022: $1,425 (lower quartile is $665, upper quartile is $1,806)
Median rent asked for vacant for-rent units in 2022: $876
Median gross rent in Norfolk, MA in 2022: $1,725
Housing units in Norfolk with a mortgage: 2,038 (195 second mortgage, 367 home equity loan, 16 both second mortgage and home equity loan)
Houses without a mortgage: 409
Compare current foreclosures near Norfolk, MA:
| Photo | Address | Area | Beds / Baths | Price | Details |
|---|---|---|---|---|---|

|
#1
Cook Rd
Cumberland, RI 02864
|
2,050 sq. feet
|
2 baths 4 beds |
$749,500
|
show details |

|
#2
Stillman St
Framingham, MA 01702
|
1,122 sq. feet
|
1 baths 2 beds |
$418,000
|
show details |

|
#3
Loomis St
North Attleboro, MA 02760
|
2,294 sq. feet
|
2 baths 4 beds |
$700,000
|
show details |

|
#4
Hebron Ave
Attleboro, MA 02703
|
2,939 sq. feet
|
4 baths 6 beds |
$559,900
|
show details |

|
#5
Washington St
Hyde Park, MA 02136
|
2,980 sq. feet
|
3 baths 5 beds |
show details | |

|
#6
Mill St
Foxboro, MA 02035
|
1,584 sq. feet
|
2 baths 3 beds |
show details | |

|
#7
Brahms St
Roslindale, MA 02131
|
1,604 sq. feet
|
1 baths 4 beds |
show details | |

|
#8
Emily Jeffers Rd # L
Randolph, MA 02368
|
1,350 sq. feet
|
1 baths 3 beds |
show details | |

|
#9
Thompson Ave
Brockton, MA 02301
|
1,775 sq. feet
|
2 baths 3 beds |
show details | |

|
#10
Lena Lane Unit 1, 25-27 Lena Lane Condominium
Milford, MA 01757
|
990 sq. feet
|
1 baths 2 beds |
show details |
| Photo | Address | Area | Beds / Baths | Price | Details |
|---|---|---|---|---|---|

|
#11
Laarhoven Ter
Stoughton, MA 02072
|
1,034 sq. feet
|
1 baths 3 beds |
show details | |

|
#12
Goodnow Ln
Framingham, MA 01702
|
2,342 sq. feet
|
2 baths 4 beds |
show details | |

|
#13
Cedar St
Ashland, MA 01721
|
2,756 sq. feet
|
3 baths 4 beds |
show details | |

|
#14
Victoria Cir
Norwood, MA 02062
|
2,980 sq. feet
|
3 baths 5 beds |
show details | |

|
#15
S Franklin St
Holbrook, MA 02343
|
940 sq. feet
|
2 baths 2 beds |
show details | |

|
#16
Grv St
Needham, MA 02492
|
6,542 sq. feet
|
4 baths 7 beds |
show details | |

|
#17
Webster St
Randolph, MA 02368
|
1,080 sq. feet
|
1 baths 3 beds |
show details | |

|
#18
Everett Cir
Hopkinton, MA 01748
|
5,180 sq. feet
|
3 baths 4 beds |
show details | |

|
#19
Ridgehill Rd
Canton, MA 02021
|
1,196 sq. feet
|
1 baths 3 beds |
show details | |

|
#20
Gilbert Rd
Needham, MA 02492
|
1,778 sq. feet
|
2 baths 3 beds |
show details |
| Photo | Address | Area | Beds / Baths | Price | Details |
|---|---|---|---|---|---|

|
#21
Congress Pl
Dedham, MA 02026
|
1,966 sq. feet
|
2 baths 4 beds |
show details | |

|
#22
Baker St
West Roxbury, MA 02132
|
2,614 sq. feet
|
3 baths 4 beds |
show details | |

|
#23
Mount Hope St
North Attleboro, MA 02760
|
3,554 sq. feet
|
2 baths 4 beds |
show details | |

|
#24
Pridemark Ln
Attleboro, MA 02703
|
1,340 sq. feet
|
1 baths 2 beds |
show details | |

|
#25
Mendon St
Blackstone, MA 01504
|
2,312 sq. feet
|
2 baths 4 beds |
show details | |

|
#26
Zeller Ave
Plainville, MA 02762
|
888 sq. feet
|
1 baths 3 beds |
show details | |

|
#27
S Main Street Aka 350 South Main Street
Randolph, MA Array
|
3,984 sq. feet
|
2 baths 8 beds |
show details | |

|
#28
S Main St
Randolph, MA 02368
|
3,773 sq. feet
|
2 baths 8 beds |
show details | |

|
#29
Collins St
Attleboro, MA 02703
|
1,357 sq. feet
|
1 baths 3 beds |
show details | |

|
#30
Pleasant St
Framingham, MA 01701
|
1,531 sq. feet
|
2 baths 3 beds |
show details |
| Photo | Address | Area | Beds / Baths | Price | Details |
|---|---|---|---|---|---|

|
#31
Collins St
Attleboro, MA 02703
|
1,357 sq. feet
|
1 baths 3 beds |
show details | |

|
#32
Park St
Hyde Park, MA 02136
|
1,562 sq. feet
|
2 baths 3 beds |
show details | |

|
#33
Merriam Rd
Framingham, MA 01701
|
1,400 sq. feet
|
2 baths 4 beds |
show details | |

|
#34
Richwood St
West Roxbury, MA 02132
|
3,262 sq. feet
|
2 baths 5 beds |
show details | |

|
#35
Hillcrest Rd
Wrentham, MA 02093
|
2,062 sq. feet
|
2 baths 3 beds |
show details | |

|
#36
Gina Cir
Framingham, MA 01701
|
1,225 sq. feet
|
1 baths 3 beds |
show details | |

|
#37
E Hartford Ave
Uxbridge, MA 01569
|
1,872 sq. feet
|
2 baths 4 beds |
show details | |

|
#38
Westgate Rd
Framingham, MA 01701
|
1,056 sq. feet
|
2 baths 3 beds |
show details | |

|
#39
Goodnow Ln
Framingham, MA 01702
|
4,198 sq. feet
|
3 baths 4 beds |
show details | |

|
#40
River Park St
Needham Heights, MA 02494
|
818 sq. feet
|
1 baths 2 beds |
show details |
| Photo | Address | Area | Beds / Baths | Price | Details |
|---|---|---|---|---|---|

|
#41
Ironstone St
Millville, MA 01529
|
924 sq. feet
|
1 baths 4 beds |
show details | |

|
#42
Lagrange St
West Roxbury, MA 02132
|
1,862 sq. feet
|
2 baths 3 beds |
show details | |

|
#43
Old Farm Rd
Randolph, MA 02368
|
1,296 sq. feet
|
3 baths 3 beds |
show details | |

|
#44
Palmer St
Brockton, MA 02301
|
1,437 sq. feet
|
1 baths 4 beds |
show details | |

|
#45
Highland Ave
Randolph, MA 02368
|
1,404 sq. feet
|
1 baths 3 beds |
show details | |

|
#46
Cole Ter
Randolph, MA 02368
|
1,776 sq. feet
|
2 baths 3 beds |
show details | |

|
#47
Pleasant St
Framingham, MA 01701
|
1,519 sq. feet
|
2 baths 4 beds |
show details | |

|
#48
Goodnow Ln
Framingham, MA 01702
|
2,342 sq. feet
|
2 baths 4 beds |
show details | |

|
#49
Warren St
Randolph, MA 02368
|
872 sq. feet
|
1 baths 3 beds |
show details | |

|
Check over 1 million property listings on Foreclosure.com!
|
browse all offers | |||
Latest news about housing in Norfolk, MA collected exclusively by city-data.com from local newspapers, TV, and radio stations

 | How Much Massachusetts Households Make Per Year: Census Data (37 replies) |
| household income map of Boston area (75 replies) |
| 2023 Real Estate Observations (5278 replies) |
| 2021 Real Estate Observations (1729 replies) |
| Single family homes for rent (3 replies) |
| Police expecting a rough summer ahead, in the city. (2487 replies) |

Household type by relationship:
Households: 653,239- In family households: 540,608 (116,996 male householders, 51,907 female householders)
134,066 spouses, 197,825 children (189,784 natural, 4,588 adopted, 3,453 stepchildren), 7,406 grandchildren, 6,062 brothers or sisters, 7,064 parents, foster children, 5,893 other relatives, 9,006 non-relatives
- In nonfamily households: 112,631 (36,559 male householders (27,334 living alone)), 52,452 female householders (43,798 living alone)), 23,620 nonrelatives
- In group quarters: 17,611 (8,991 institutionalized population)
123,500 married couples with children.
20,654 single-parent households (3,498 men, 17,156 women).
88.5% of residents of Norfolk speak English at home.
6.0% of residents speak Spanish at home (43% speak English very well, 26% speak English well, 31% speak English not well).
4.4% of residents speak other Indo-European language at home (80% speak English very well, 11% speak English well, 7% speak English not well, 2% don't speak English at all).
1.0% of residents speak Asian or Pacific Island language at home (41% speak English very well, 17% speak English well, 28% speak English not well, 15% don't speak English at all).
0.1% of residents speak other language at home (100% speak English very well).
Foreign born population: 1,594 (13.7%)
(39.0% of them are naturalized citizens)
| Here: | 8.1 |
| State: | 6.5 |
| Here: | 3.8 |
| State: | 4.0 |
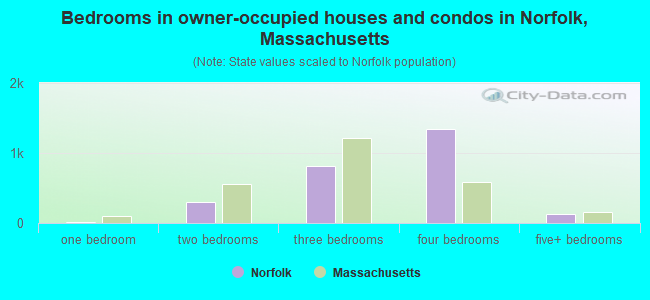
- Bedrooms in owner-occupied houses and condos in Norfolk, Massachusetts
- 0no bedroom
- 181 bedroom
- 3012 bedrooms
- 8173 bedrooms
- 1,3394 bedrooms
- 1285+ bedrooms
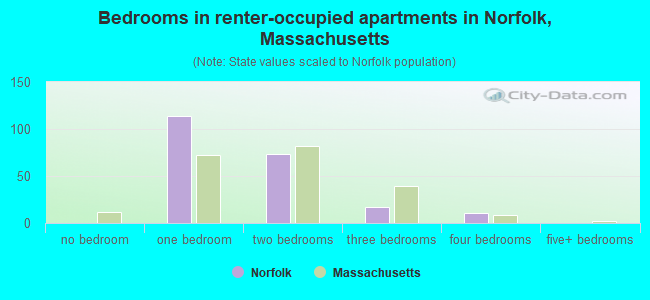
- Bedrooms in renter-occupied apartments in Norfolk, Massachusetts
- 0no bedroom
- 1141 bedroom
- 732 bedrooms
- 173 bedrooms
- 114 bedrooms
- 05+ bedrooms
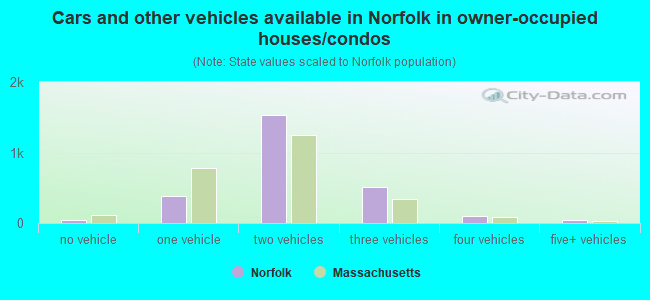
- Cars and other vehicles available in Norfolk in owner-occupied houses/condos
- 45no vehicle
- 3901 vehicle
- 1,5262 vehicles
- 5063 vehicles
- 964 vehicles
- 405+ vehicles
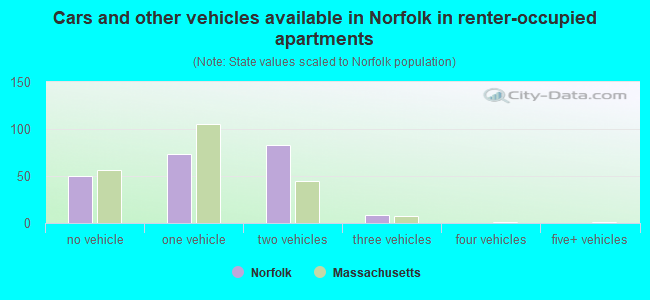
- Cars and other vehicles available in Norfolk in renter-occupied apartments
- 50no vehicle
- 731 vehicle
- 832 vehicles
- 93 vehicles
- 04 vehicles
- 05+ vehicles
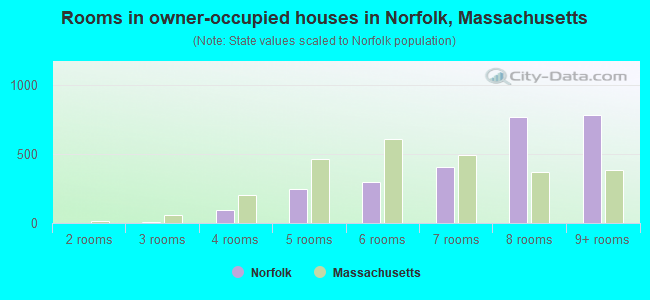
- Rooms in owner-occupied houses in Norfolk, Massachusetts
- 01 room
- 02 rooms
- 73 rooms
- 914 rooms
- 2505 rooms
- 2996 rooms
- 4037 rooms
- 7708 rooms
- 7839+ rooms
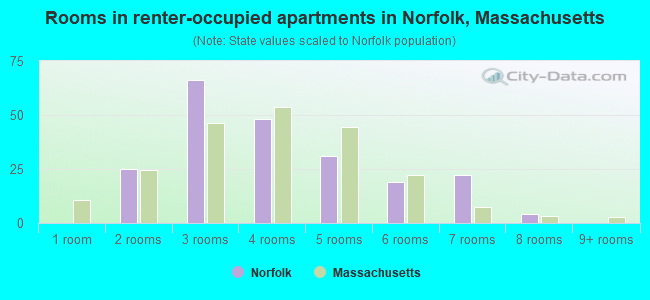
- Rooms in renter-occupied apartments in Norfolk, Massachusetts
- 01 room
- 252 rooms
- 663 rooms
- 484 rooms
- 315 rooms
- 196 rooms
- 227 rooms
- 48 rooms
- 09+ rooms
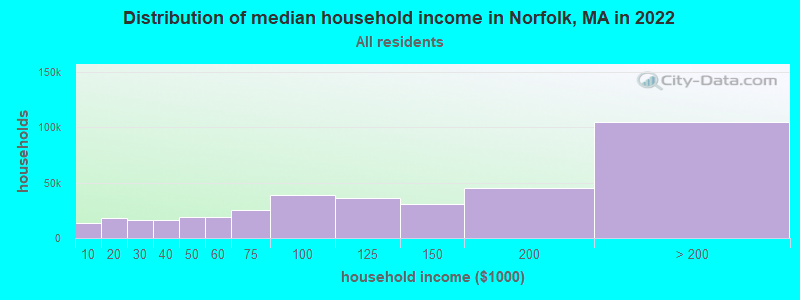
Norfolk, MA household income distribution

- 13,613Less than $10,000
- 18,288$10,000 to $19,999
- 16,497$20,000 to $29,999
- 16,149$30,000 to $39,999
- 19,197$40,000 to $49,999
- 19,060$50,000 to $59,999
- 25,162$60,000 to $74,999
- 38,654$75,000 to $99,999
- 36,428$100,000 to $124,999
- 30,297$125,000 to $149,999
- 44,901$150,000 to $199,999
- 104,547$200,000 or more
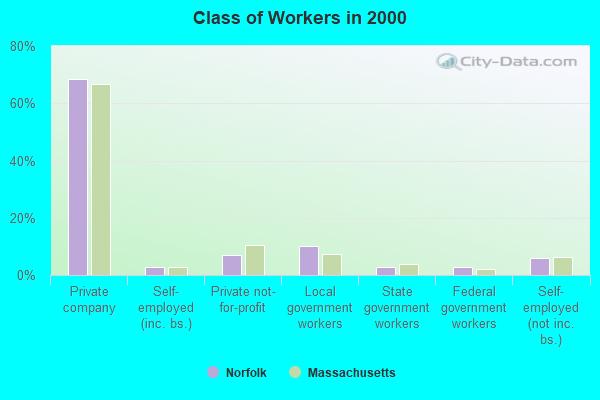
Percentage of workers working in this county: 65.7%
Number of people working at home: 1,135 (22.3% of all workers)
Travel time to work (commute)
- Less than 5 minutes: 181
- 5 to 9 minutes: 310
- 10 to 14 minutes: 435
- 15 to 19 minutes: 316
- 20 to 24 minutes: 333
- 25 to 29 minutes: 224
- 30 to 34 minutes: 598
- 35 to 39 minutes: 213
- 40 to 44 minutes: 262
- 45 to 59 minutes: 571
- 60 to 89 minutes: 605
- 90 or more minutes: 144
Means of transportation to work:
- Drove a car alone: 3,447 (79.3%)
- Carpooled: 314 (7.2%)
- Subway or elevated: 26 (0.6%)
- Railroad: 317 (7.3%)
- Bicycle: 8 (0.2%)
- Walked: 80 (1.8%)
- Worked at home: 156 (3.6%)
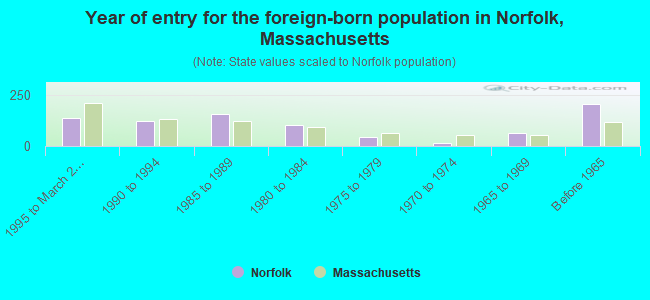
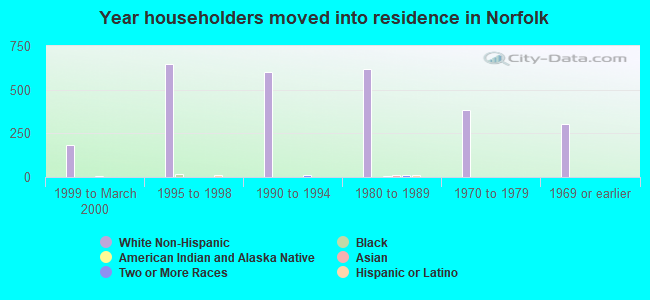
- Year of entry for the foreign-born population in Norfolk, Massachusetts
- 1381995 to March 2000
- 1251990 to 1994
- 1581985 to 1989
- 1051980 to 1984
- 421975 to 1979
- 131970 to 1974
- 631965 to 1969
- 208Before 1965
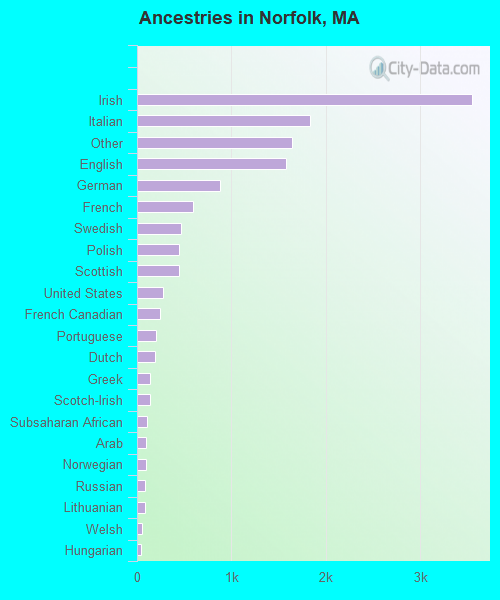
First ancestries reported:
- Irish: 3,552 (26.8%)
- Italian: 1,834 (13.8%)
- Other: 1,641 (12.4%)
- English: 1,583 (11.9%)
- German: 878 (6.6%)
- French: 598 (4.5%)
- Swedish: 461 (3.5%)
- Polish: 449 (3.4%)
- Scottish: 444 (3.3%)
- United States: 276 (2.1%)
- French Canadian: 239 (1.8%)
- Portuguese: 201 (1.5%)
- Dutch: 190 (1.4%)
- Greek: 143 (1.1%)
- Scotch-Irish: 142 (1.1%)
- Subsaharan African: 104 (0.8%)
- Arab: 96 (0.7%)
- Norwegian: 94 (0.7%)
- Russian: 84 (0.6%)
- Lithuanian: 80 (0.6%)
- Welsh: 50 (0.4%)
- Hungarian: 43 (0.3%)
- West Indian: 22 (0.2%)
- Swiss: 18 (0.1%)
- Danish: 17 (0.1%)
- Ukrainian: 16 (0.1%)
Most common places of birth for foreign-born residents (%):
| Norfolk: | 18.5% (158) |
| Massachusetts: | 6.0% (46,744) |
| Norfolk: | 10.4% (89) |
| Massachusetts: | 3.3% (25,403) |
| Norfolk: | 7.0% (60) |
| Massachusetts: | 5.2% (40,247) |
| Norfolk: | 6.1% (52) |
| Massachusetts: | 1.0% (7,867) |
| Norfolk: | 3.8% (32) |
| Massachusetts: | 3.7% (28,319) |
| Norfolk: | 3.8% (32) |
| Massachusetts: | 8.6% (66,627) |
| Norfolk: | 3.5% (30) |
| Massachusetts: | 2.0% (15,286) |
| Norfolk: | 3.3% (28) |
| Massachusetts: | 1.9% (14,883) |
| Norfolk: | 3.3% (28) |
| Massachusetts: | 5.1% (39,255) |
| Norfolk: | 2.7% (23) |
| Massachusetts: | 3.9% (30,457) |
| Norfolk: | 2.7% (23) |
| Massachusetts: | 3.6% (28,086) |
| Norfolk: | 2.7% (23) |
| Massachusetts: | 2.4% (18,606) |
| Norfolk: | 2.6% (22) |
| Massachusetts: | 0.4% (3,048) |
| Norfolk: | 2.2% (19) |
| Massachusetts: | 1.7% (13,456) |
| Norfolk: | 2.2% (19) |
| Massachusetts: | 2.6% (20,299) |
| Norfolk: | 2.1% (18) |
| Massachusetts: | 2.3% (17,987) |
| Norfolk: | 1.9% (16) |
| Massachusetts: | 0.4% (2,726) |
| Norfolk: | 1.9% (16) |
| Massachusetts: | 0.9% (7,258) |
| Norfolk: | 1.9% (16) |
| Massachusetts: | 2.3% (17,449) |
| Norfolk: | 1.6% (14) |
| Massachusetts: | 0.3% (2,470) |
| Norfolk: | 1.6% (14) |
| Massachusetts: | 1.7% (12,808) |
| Norfolk: | 1.5% (13) |
| Massachusetts: | 0.3% (1,984) |
Place of birth for U.S.-born residents:
- This state: 7,251
- Other state: 2,144
- Northeast: 1,334
- Midwest: 287
- South: 385
- West: 138
72% of Norfolk residents lived in the same house 5 years ago.
Out of people who lived in different houses, 53% lived in this county.
Out of people who lived in different counties, 70% lived in Massachusetts.
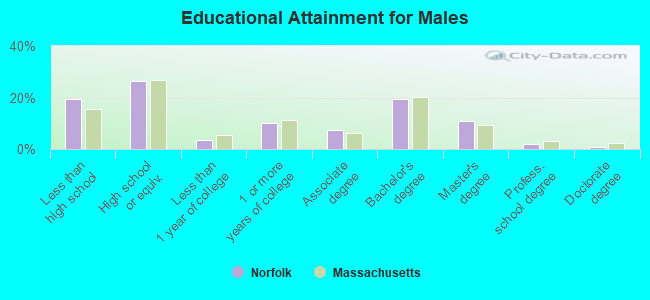
Education attainment for males 25 years and older:
- No schooling: 14
- Nursery to 4th grade: 29
- 5th and 6th grade: 50
- 7th and 8th grade: 209
- 9th grade: 117
- 10th grade: 139
- 11th grade: 116
- 12th grade, no diploma: 159
- High school graduate (or equivalency): 1,134
- Less than 1 year of college: 158
- Some college more than 1 year, no degree: 434
- Associate degree: 311
- Bachelor's degree: 845
- Master's degree: 476
- Professional school degree: 77
- Doctorate degree: 41
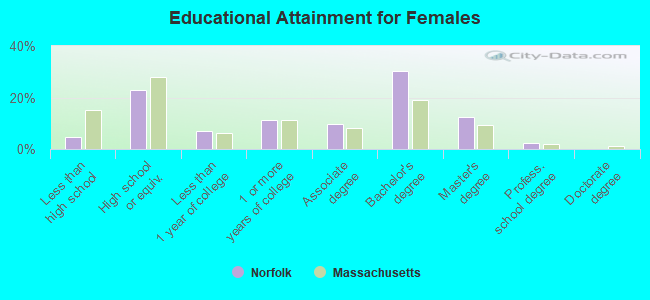
Education attainment for females 25 years and older:
- No schooling: 7
- Nursery to 4th grade: 8
- 5th and 6th grade: 0
- 7th and 8th grade: 33
- 9th grade: 0
- 10th grade: 5
- 11th grade: 34
- 12th grade, no diploma: 45
- High school graduate (or equivalency): 636
- Less than 1 year of college: 197
- Some college more than 1 year, no degree: 311
- Associate degree: 267
- Bachelor's degree: 846
- Master's degree: 346
- Professional school degree: 62
- Doctorate degree: 0
Housing units in structures:
- One, detached: 2,668
- One, attached: 26
- Two: 58
- 3 or 4: 63
- 5 to 9: 46
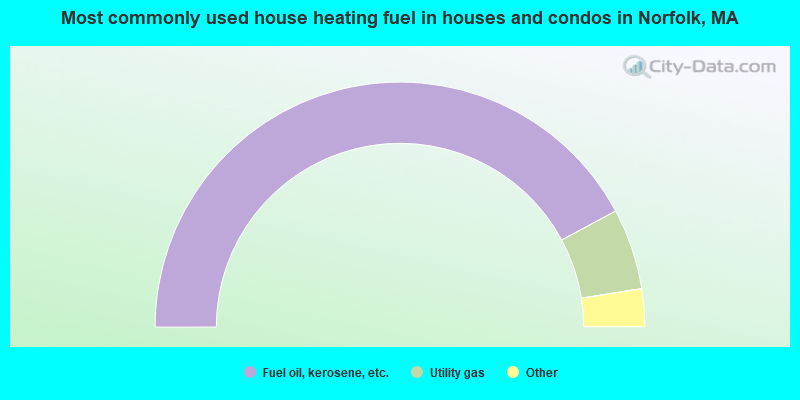
- 84.3%Fuel oil, kerosene, etc.
- 10.7%Utility gas
- 2.2%Electricity
- 1.8%Bottled, tank, or LP gas
- 0.7%Wood
- 0.3%Other fuel
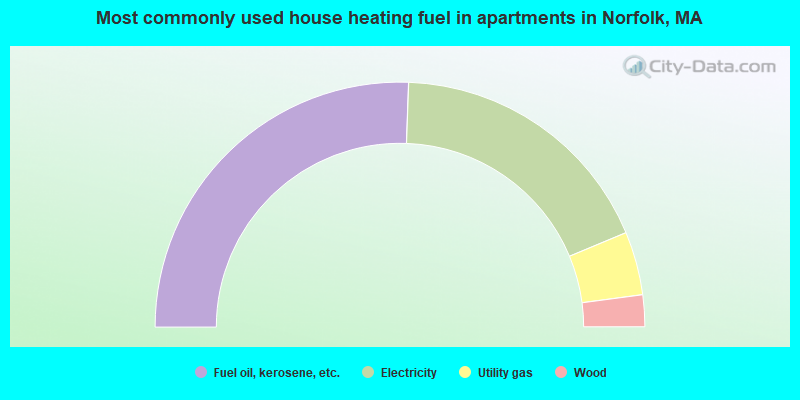
- 51.2%Fuel oil, kerosene, etc.
- 36.3%Electricity
- 8.4%Utility gas
- 4.2%Wood
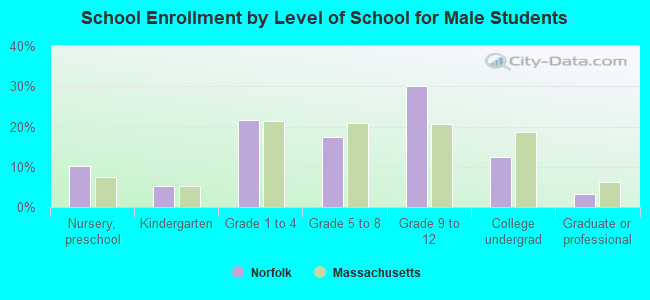
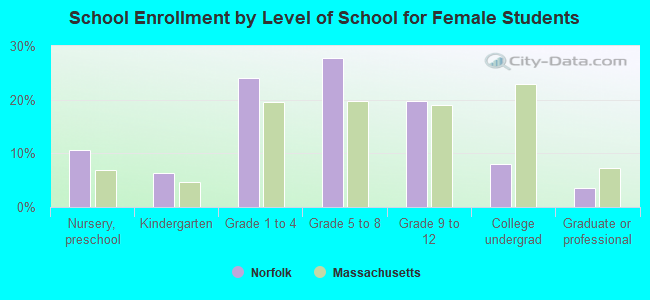
Private vs. public school enrollment:
| Here: | 8.7% |
| Massachusetts: | 10.8% |
| Here: | 17.2% |
| Massachusetts: | 12.2% |
| Here: | 41.7% |
| Massachusetts: | 48.2% |