North Las Vegas, NV (Nevada) Houses and Residents
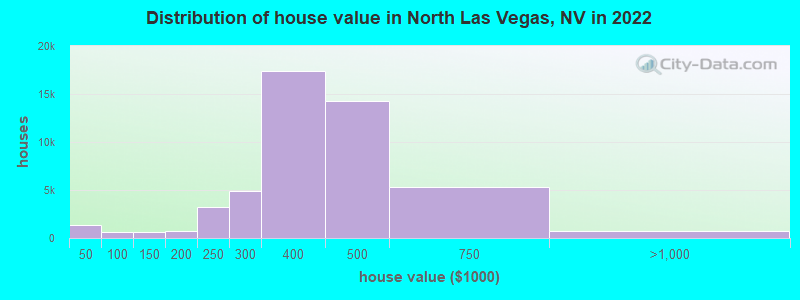
Estimated median house or condo value in 2022: $413,300 (it was $120,900 in 2000 )
North Las Vegas:
$413,300Nevada:
$434,700
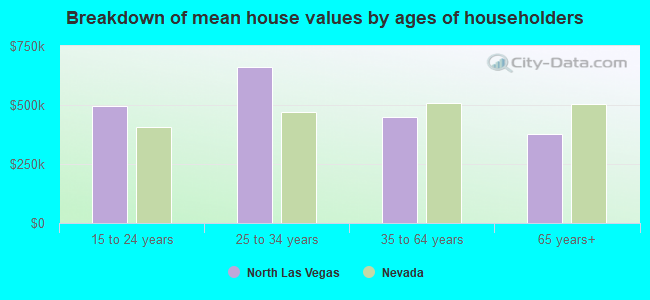
Lower value quartile - upper value quartile: $328,800 - $477,400Mean price in 2022: Detached houses: $473,966 Here:
$473,966State:
$549,327
Townhouses or other attached units: $339,574 Here:
$339,574State:
$328,893
In 2-unit structures: $349,970 Here:
$349,970State:
$326,466
In 3-to-4-unit structures: $306,006 Here:
$306,006State:
$295,216
In 5-or-more-unit structures: $335,150 Here:
$335,150State:
$297,847
Mobile homes: $184,479 Here:
$184,479State:
$159,995
Total population: 230,788 (Urban population: 115,421, Rural population: 68 (all nonfarm) )
Houses: 97,459 (89,660 occupied: 58,401 owner occupied, 31,259 renter occupied )
% of renters here:
35%State:
40%
Housing density: 1,241 houses/condos per square mile
Median price asked for vacant for-sale houses and condos in 2022: $537,257.
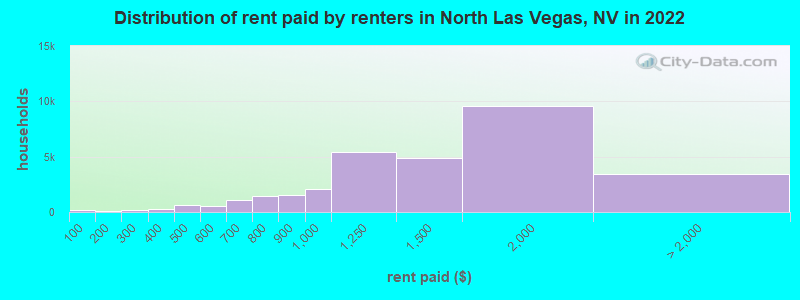
Median contract rent in 2022: $1,356 (lower quartile is $988, upper quartile is $1,756)
Median rent asked for vacant for-rent units in 2022: $2,441
Median gross rent in North Las Vegas, NV in 2022: $1,572
Housing units in North Las Vegas with a mortgage: 45,911 (2,686 second mortgage, 96 home equity loan, 1,845 both second mortgage and home equity loan )Houses without a mortgage: 168
Median household income for houses/condos with a mortgage: $96,207
Median household income for apartments without a mortgage: $69,181
Median monthly housing costs: $1,519
Data:
Median house or condo value ($)
Median house or condo value ($ change since 2000)
Median house or condo value ($) - White
Median house or condo value ($) - Black or African American
Median house or condo value ($) - Asian
Median house or condo value ($) - Hispanic or Latino
Median house or condo value ($) - American Indian and Alaska Native
Median house or condo value ($) - Multirace
Median house or condo value ($) - Other Race
Median price asked for mobile homes ($)
Household density (households per square mile)
Mean house or condo value by units in structure - 1, detached ($)
Mean house or condo value by units in structure - 1, attached ($)
Mean house or condo value by units in structure - 2 ($)
Mean house or condo value by units in structure by units in structure - 3 or 4 ($)
Mean house or condo value by units in structure - 5 or more ($)
Mean house or condo value by units in structure - Boat, RV, van, etc. ($)
Mean house or condo value by units in structure - Mobile home ($)
Median contract rent ($)
Median contract rent - Lower quartile ($)
Median contract rent - Upper quartile ($)
Median gross rent ($)
Urban houses (%)
Rural houses (%)
Houses occupied (%)
Houses occupied (% change since 2000)
Houses owner occupied (%)
Houses owner occupied (% change since 2000)
Houses renter occupied (%)
Houses renter occupied (% change since 2000)
Vacant housing units - For rent (%)
Vacant housing units - For rent (% change since 2000)
Vacant housing units - For sale only (%)
Vacant housing units - For sale only (% change since 2000)
Vacant housing units - Rented or sold, not occupied (%)
Vacant housing units - Rented or sold, not occupied (% change since 2000)
Vacant housing units - For seasonal, recreational, or occasional use (%)
Vacant housing units - For seasonal, recreational, or occasional use (% change since 2000)
Vacant housing units - For migrant workers (%)
Vacant housing units - For migrant workers (% change since 2000)
Vacant housing units - Other vacant (%)
Vacant housing units - Other vacant (% change since 2000)
Median monthly housing costs ($)
Median household income for houses/condos with a mortgage ($)
Median household income for houses/condos without a mortgage ($)
Median household income ($)
Median household income ($) - White
Median household income ($) - Black or African American
Median household income ($) - Asian
Median household income ($) - Hispanic or Latino
Median household income ($) - American Indian and Alaska Native
Median household income ($) - Multirace
Median household income ($) - Other Race
Mortgage status - with mortgage (%)
Mortgage status - with second mortgage (%)
Mortgage status - with home equity loan (%)
Mortgage status - with both second mortgage and home equity loan (%)
Mortgage status - without a mortgage (%)
Median year house/condo built
Median year apartment built
Household type by relationship - Male householder living alone (%)
Household type by relationship - Male householder not living alone (%)
Household type by relationship - Female householder living alone (%)
Household type by relationship - Female householder not living alone (%)
Household type by relationship - Opposite-Sex spouse (%)
Household type by relationship - Same-Sex spouse (%)
Household type by relationship - Opposite-Sex unmarried partner (%)
Household type by relationship - Same-Sex unmarried partner (%)
Household type by relationship - In group quarters (%)
Size of family households - 2-person household (%)
Size of family households - 3-person household (%)
Size of family households - 4-person household (%)
Size of family households - 5-person household (%)
Size of family households - 6-person household (%)
Size of family households - 7-or-more-person household (%)
Size of nonfamily households - 1-person household (%)
Size of nonfamily households - 2-person household (%)
Size of nonfamily households - 3-person household (%)
Size of nonfamily households - 4-person household (%)
Size of nonfamily households - 5-person household (%)
Size of nonfamily households - 6-person household (%)
Size of nonfamily households - 7-or-moreperson household (%)
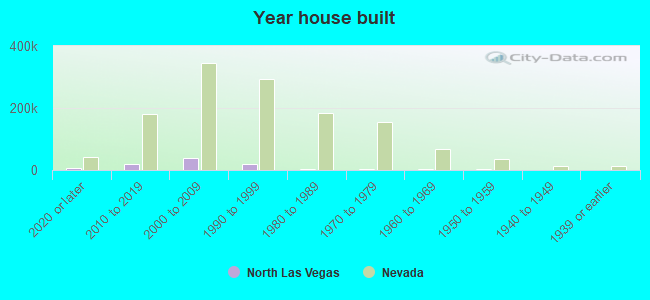
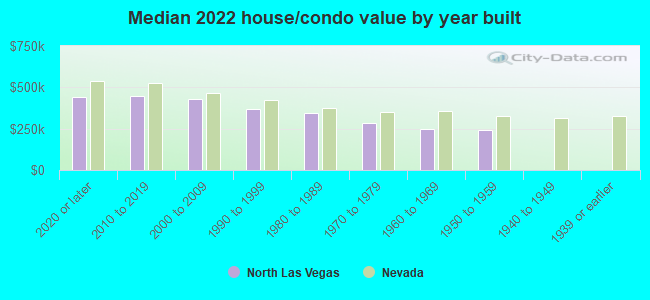
Year house built - Built 2010 or later (%)
Year house built - Built 2000 to 2009 (%)
Year house built - Built 1990 to 1999 (%)
Year house built - Built 1980 to 1989 (%)
Year house built - Built 1970 to 1979 (%)
Year house built - Built 1960 to 1969 (%)
Year house built - Built 1950 to 1959 (%)
Year house built - Built 1940 to 1949 (%)
Year house built - Built 1939 or earlier (%)
Median number of rooms in houses and condos
Median number of rooms in apartments
Median number of bedrooms in owner occupied houses
Mean number of bedrooms in owner occupied houses
Median number of bedrooms in renter occupied houses
Mean number of bedrooms in renter occupied houses
Median number of vehichles in owner occupied houses
Mean number of vehichles in owner occupied houses
Median number of vehichles in renter occupied houses
Mean number of vehichles in renter occupied houses
Rooms in owner-occupied houses - 1 room (%)
Rooms in owner-occupied houses - 2 rooms (%)
Rooms in owner-occupied houses - 3 rooms (%)
Rooms in owner-occupied houses - 4 rooms (%)
Rooms in owner-occupied houses - 5 rooms (%)
Rooms in owner-occupied houses - 6 rooms (%)
Rooms in owner-occupied houses - 7 rooms (%)
Rooms in owner-occupied houses - 8 rooms (%)
Rooms in owner-occupied houses - 9+ rooms (%)
Rooms in renter-occupied houses - 1 room (%)
Rooms in renter-occupied houses - 2 rooms (%)
Rooms in renter-occupied houses - 3 rooms (%)
Rooms in renter-occupied houses - 4 rooms (%)
Rooms in renter-occupied houses - 5 rooms (%)
Rooms in renter-occupied houses - 6 rooms (%)
Rooms in renter-occupied houses - 7 rooms (%)
Rooms in renter-occupied houses - 8 rooms (%)
Rooms in renter-occupied houses - 9+ rooms (%)
Bedrooms in owner-occupied houses - no bedrooms (%)
Bedrooms in owner-occupied houses - 1 bedroom (%)
Bedrooms in owner-occupied houses - 2 bedrooms (%)
Bedrooms in owner-occupied houses - 3 bedrooms (%)
Bedrooms in owner-occupied houses - 4 bedrooms (%)
Bedrooms in owner-occupied houses - 5+ bedrooms (%)
Bedrooms in renter-occupied houses - no bedrooms (%)
Bedrooms in renter-occupied houses - 1 bedroom (%)
Bedrooms in renter-occupied houses - 2 bedrooms (%)
Bedrooms in renter-occupied houses - 3 bedrooms (%)
Bedrooms in renter-occupied houses - 4 bedrooms (%)
Bedrooms in renter-occupied houses - 5+ bedrooms (%)
Vehicles available in owner-occupied houses - no vehicle available (%)
Vehicles available in owner-occupied houses - 1 vehicle available(%)
Vehicles available in owner-occupied houses - 2 Vehicles available (%)
Vehicles available in owner-occupied houses - 3 Vehicles available (%)
Vehicles available in owner-occupied houses - 4 Vehicles available (%)
Vehicles available in owner-occupied houses - 5+ Vehicles available (%)
Vehicles available in renter-occupied houses - no vehicle available (%)
Vehicles available in renter-occupied houses - 1 vehicle available (%)
Vehicles available in renter-occupied houses - 2 Vehicles available (%)
Vehicles available in renter-occupied houses - 3 Vehicles available (%)
Vehicles available in renter-occupied houses - 4 Vehicles available (%)
Vehicles available in renter-occupied houses - 5+ Vehicles available (%)
Housing units in structures - 1, detached (%)
Housing units in structures - 1, attached (%)
Housing units in structures - 2 (%)
Housing units in structures - 3 or 4 (%)
Housing units in structures - 5 to 9 (%)
Housing units in structures - 10 to 19 (%)
Housing units in structures - 20 to 49 (%)
Housing units in structures - 50 or more (%)
Housing units in structures - Mobile home (%)
Housing units in structures - Boat, RV, van, etc. (%)
Housing units in structures - Owners - 1, detached (%)
Housing units in structures - Owners - 1, attached (%)
Housing units in structures - Owners - 2 (%)
Housing units in structures - Owners - 3 or 4 (%)
Housing units in structures - Owners - 5 to 9 (%)
Housing units in structures - Owners - 10 to 19 (%)
Housing units in structures - Owners - 20 to 49 (%)
Housing units in structures - Owners - 50 or more (%)
Housing units in structures - Owners - Mobile home (%)
Housing units in structures - Owners - Boat, RV, van, etc. (%)
Housing units in structures - Renters - 1, detached (%)
Housing units in structures - Renters - 1, attached (%)
Housing units in structures - Renters - 2 (%)
Housing units in structures - Renters - 3 or 4 (%)
Housing units in structures - Renters - 5 to 9 (%)
Housing units in structures - Renters - 10 to 19 (%)
Housing units in structures - Renters - 20 to 49 (%)
Housing units in structures - Renters - 50 or more (%)
Housing units in structures - Renters - Mobile home (%)
Housing units in structures - Renters - Boat, RV, van, etc. (%)
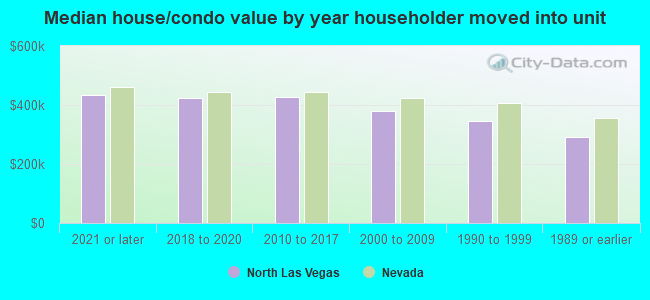
House/condo owner moved in on average (years ago)
Renter moved in on average (years ago)
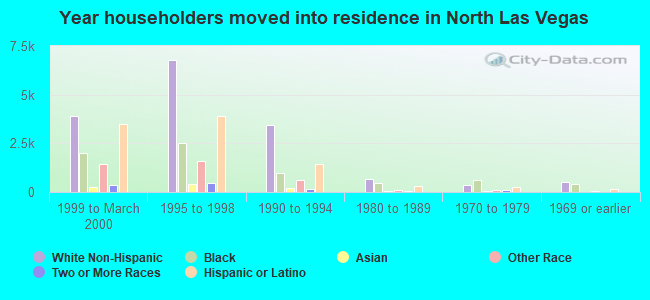
Year householder moved into unit - Moved in 1999 to March 2000 (%)
Year householder moved into unit - Moved in 1999 to March 2000 (%) - White
Year householder moved into unit - Moved in 1999 to March 2000 (%) - Black or African American
Year householder moved into unit - Moved in 1999 to March 2000 (%) - Asian
Year householder moved into unit - Moved in 1999 to March 2000 (%) - Hispanic or Latino
Year householder moved into unit - Moved in 1999 to March 2000 (%) - American Indian and Alaska Native
Year householder moved into unit - Moved in 1999 to March 2000 (%) - Multirace
Year householder moved into unit - Moved in 1999 to March 2000 (%) - Other Race
Year householder moved into unit - Moved in 1995 to 1998 (%)
Year householder moved into unit - Moved in 1995 to 1998 (%) - White
Year householder moved into unit - Moved in 1995 to 1998 (%) - Black or African American
Year householder moved into unit - Moved in 1995 to 1998 (%) - Asian
Year householder moved into unit - Moved in 1995 to 1998 (%) - Hispanic or Latino
Year householder moved into unit - Moved in 1995 to 1998 (%) - American Indian and Alaska Native
Year householder moved into unit - Moved in 1995 to 1998 (%) - Multirace
Year householder moved into unit - Moved in 1995 to 1998 (%) - Other Race
Year householder moved into unit - Moved in 1990 to 1994 (%)
Year householder moved into unit - Moved in 1990 to 1994 (%) - White
Year householder moved into unit - Moved in 1990 to 1994 (%) - Black or African American
Year householder moved into unit - Moved in 1990 to 1994 (%) - Asian
Year householder moved into unit - Moved in 1990 to 1994 (%) - Hispanic or Latino
Year householder moved into unit - Moved in 1990 to 1994 (%) - American Indian and Alaska Native
Year householder moved into unit - Moved in 1990 to 1994 (%) - Multirace
Year householder moved into unit - Moved in 1990 to 1994 (%) - Other Race
Year householder moved into unit - Moved in 1980 to 1989 (%)
Year householder moved into unit - Moved in 1980 to 1989 (%) - White
Year householder moved into unit - Moved in 1980 to 1989 (%) - Black or African American
Year householder moved into unit - Moved in 1980 to 1989 (%) - Asian
Year householder moved into unit - Moved in 1980 to 1989 (%) - Hispanic or Latino
Year householder moved into unit - Moved in 1980 to 1989 (%) - American Indian and Alaska Native
Year householder moved into unit - Moved in 1980 to 1989 (%) - Multirace
Year householder moved into unit - Moved in 1980 to 1989 (%) - Other Race
Year householder moved into unit - Moved in 1970 to 1979 (%)
Year householder moved into unit - Moved in 1970 to 1979 (%) - White
Year householder moved into unit - Moved in 1970 to 1979 (%) - Black or African American
Year householder moved into unit - Moved in 1970 to 1979 (%) - Asian
Year householder moved into unit - Moved in 1970 to 1979 (%) - Hispanic or Latino
Year householder moved into unit - Moved in 1970 to 1979 (%) - American Indian and Alaska Native
Year householder moved into unit - Moved in 1970 to 1979 (%) - Multirace
Year householder moved into unit - Moved in 1970 to 1979 (%) - Other Race
Year householder moved into unit - Moved in 1969 or earlier (%)
Year householder moved into unit - Moved in 1969 or earlier (%) - White
Year householder moved into unit - Moved in 1969 or earlier (%) - Black or African American
Year householder moved into unit - Moved in 1969 or earlier (%) - Asian
Year householder moved into unit - Moved in 1969 or earlier (%) - Hispanic or Latino
Year householder moved into unit - Moved in 1969 or earlier (%) - American Indian and Alaska Native
Year householder moved into unit - Moved in 1969 or earlier (%) - Multirace
Year householder moved into unit - Moved in 1969 or earlier (%) - Other Race
Housing units lacking complete plumbing facilities (%)
Housing units lacking complete kitchen facilities (%)
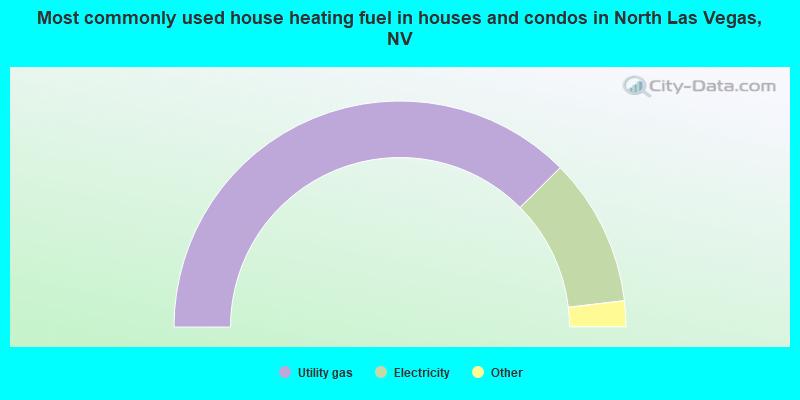
House heating fuel used in houses and condos - Utility gas (%)
House heating fuel used in houses and condos - Bottled, tank, or LP gas (%)
House heating fuel used in houses and condos - Electricity (%)
House heating fuel used in houses and condos - Fuel oil, kerosene, etc. (%)
House heating fuel used in houses and condos - Coal or coke (%)
House heating fuel used in houses and condos - Wood (%)
House heating fuel used in houses and condos - Solar energy (%)
House heating fuel used in houses and condos - Other fuel (%)
House heating fuel used in houses and condos - No fuel used (%)
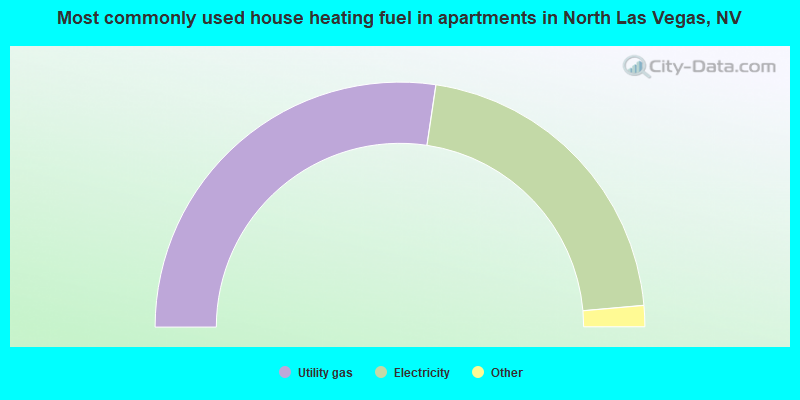
House heating fuel used in apartments - Utility gas (%)
House heating fuel used in apartments - Bottled, tank, or LP gas (%)
House heating fuel used in apartments - Electricity (%)
House heating fuel used in apartments - Fuel oil, kerosene, etc. (%)
House heating fuel used in apartments - Coal or coke (%)
House heating fuel used in apartments - Wood (%)
House heating fuel used in apartments - Solar energy (%)
House heating fuel used in apartments - Other fuel (%)
House heating fuel used in apartments - No fuel used (%)
Median year house/condo built: 2005Median year apartment built: 2000Household type by relationship:
Households: 280,539
Male householders: 42,835 (8,592 living alone ), Female householders: 46,825 (8,759 living alone )45,111 spouses (44,028 opposite-sex spouses ), 8,600 unmarried partners , (8,342 opposite-sex unmarried partners ), 92,212 children (87,011 natural , 1,338 adopted , 3,863 stepchildren ), 9,414 grandchildren , 5,667 brothers or sisters , 8,144 parents , 465 foster children , 10,622 other relatives , 9,551 non-relatives In group quarters: 1,093
Size of family households: 20,437 2-persons , 16,253 3-persons , 14,341 4-persons , 7,790 5-persons , 4,561 6-persons , 2,324 7-or-more-persons .
Size of nonfamily households: 17,351 1-person , 5,208 2-persons , 987 3-persons , 349 4-persons , 59 6-persons .
38,502 married couples with children. single-parent households (3,854 men , 18,168 women ).
61.0% of residents of North Las Vegas speak English at home. of residents speak Spanish at home (61% speak English very well , 20% speak English well , 14% speak English not well , 5% don't speak English at all ).of residents speak other Indo-European language at home (71% speak English very well , 24% speak English well , 4% speak English not well ).of residents speak Asian or Pacific Island language at home (66% speak English very well , 26% speak English well , 7% speak English not well ).of residents speak other language at home (71% speak English very well , 21% speak English well , 4% speak English not well , 4% don't speak English at all ).
Foreign born population: 57,788 (20.6%)of them are naturalized citizens )
Median number of rooms in houses and condos:
Median number of rooms in apartments
Owner-occupied Renter-occupied
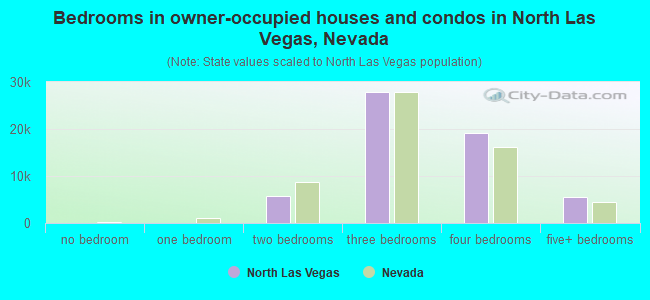
Bedrooms in owner-occupied houses and condos in North Las Vegas, Nevada
30 no bedroom 96 1 bedroom 5,758 2 bedrooms 27,843 3 bedrooms 19,154 4 bedrooms 5,520 5+ bedrooms
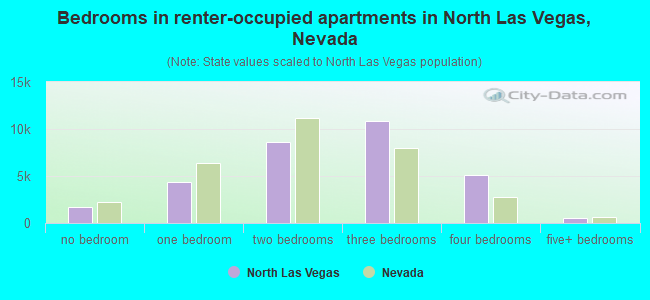
Bedrooms in renter-occupied apartments in North Las Vegas, Nevada
1,732 no bedroom 4,341 1 bedroom 8,639 2 bedrooms 10,819 3 bedrooms 5,149 4 bedrooms 579 5+ bedrooms
Owner-occupied Renter-occupied
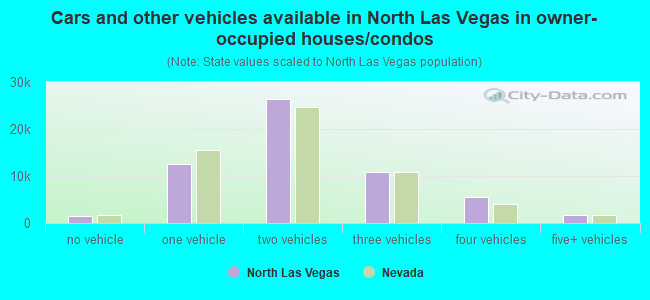
Cars and other vehicles available in North Las Vegas in owner-occupied houses/condos
1,551 no vehicle 12,483 1 vehicle 26,315 2 vehicles 10,828 3 vehicles 5,526 4 vehicles 1,698 5+ vehicles
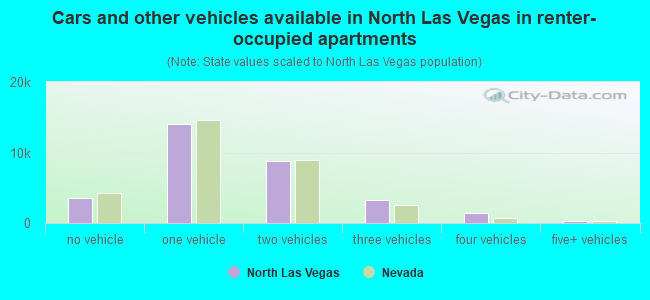
Cars and other vehicles available in North Las Vegas in renter-occupied apartments
3,493 no vehicle 14,011 1 vehicle 8,864 2 vehicles 3,216 3 vehicles 1,434 4 vehicles 241 5+ vehicles
Owner-occupied Renter-occupied
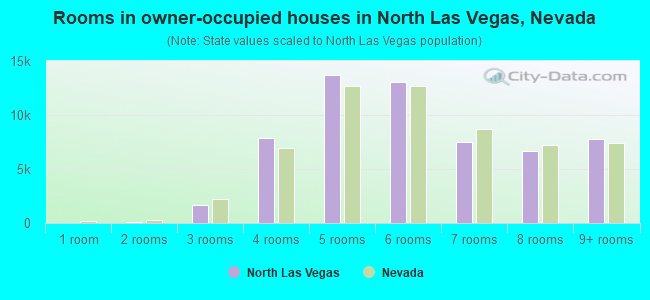
Rooms in owner-occupied houses in North Las Vegas, Nevada
30 1 room 54 2 rooms 1,669 3 rooms 7,889 4 rooms 13,695 5 rooms 13,086 6 rooms 7,496 7 rooms 6,679 8 rooms 7,803 9+ rooms
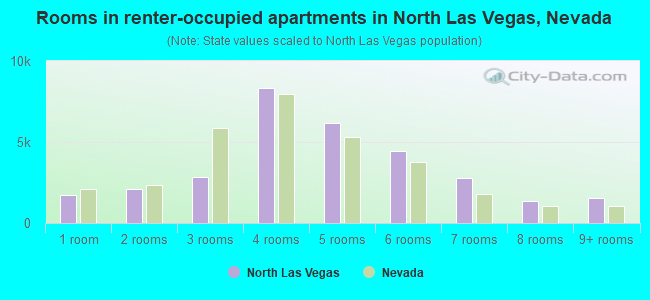
Rooms in renter-occupied apartments in North Las Vegas, Nevada
1,732 1 room 2,089 2 rooms 2,863 3 rooms 8,317 4 rooms 6,150 5 rooms 4,441 6 rooms 2,760 7 rooms 1,349 8 rooms 1,558 9+ rooms
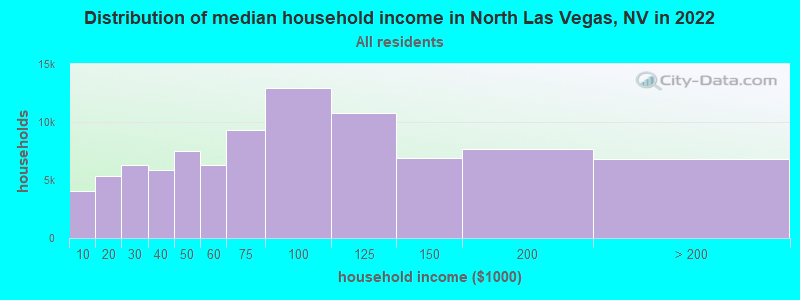
North Las Vegas, NV household income distribution 4,046 Less than $10,0005,310 $10,000 to $19,9996,256 $20,000 to $29,9995,823 $30,000 to $39,9997,468 $40,000 to $49,9996,301 $50,000 to $59,9999,306 $60,000 to $74,99912,953 $75,000 to $99,99910,787 $100,000 to $124,9996,889 $125,000 to $149,9997,699 $150,000 to $199,9996,822 $200,000 or more
Home value of owner - occupied houses in 2022 in North Las Vegas, NV 374 Less than $10,00028 $10,000 to $14,9997 $15,000 to $19,99949 $20,000 to $24,999143 $25,000 to $29,999188 $30,000 to $34,999306 $35,000 to $39,999305 $40,000 to $49,99955 $50,000 to $59,99922 $60,000 to $69,99968 $70,000 to $79,999110 $80,000 to $89,99959 $90,000 to $99,999394 $100,000 to $124,999192 $125,000 to $149,999329 $150,000 to $174,999402 $175,000 to $199,9993,233 $200,000 to $249,9994,860 $250,000 to $299,99917,353 $300,000 to $399,99914,296 $400,000 to $499,9995,288 $500,000 to $749,999452 $750,000 to $999,99943 $1,000,000 to $1,499,99915 $1,500,000 to $1,999,999188 $2,000,000 or moreRent paid by renters in 2022 in North Las Vegas, NV 166 Less than $10071 $150 to $199206 $250 to $299148 $300 to $34990 $350 to $399410 $400 to $449260 $450 to $499427 $500 to $54986 $550 to $599630 $600 to $649451 $650 to $699978 $700 to $749426 $750 to $7991,541 $800 to $8992,064 $900 to $9995,395 $1,000 to $1,2494,855 $1,250 to $1,4999,611 $1,500 to $1,9992,643 $2,000 to $2,499366 $2,500 to $2,999435 No cash rent
Percentage of workers working in this county: 98.7%Number of people working at home: 11,717 (8.7% of all workers )
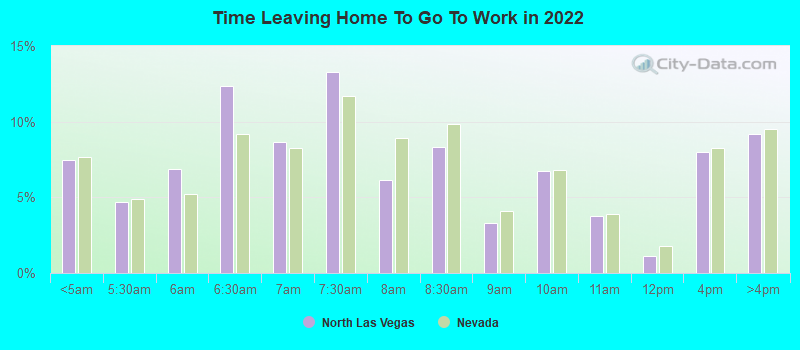
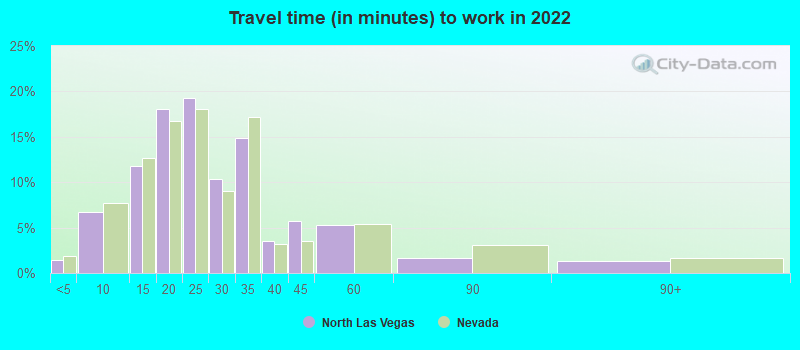
Travel time to work (commute)
Less than 5 minutes: 2,0305 to 9 minutes: 7,37310 to 14 minutes: 9,30715 to 19 minutes: 17,22520 to 24 minutes: 19,19725 to 29 minutes: 10,44230 to 34 minutes: 28,52535 to 39 minutes: 7,26840 to 44 minutes: 6,59245 to 59 minutes: 10,33160 to 89 minutes: 2,18890 or more minutes: 1,884
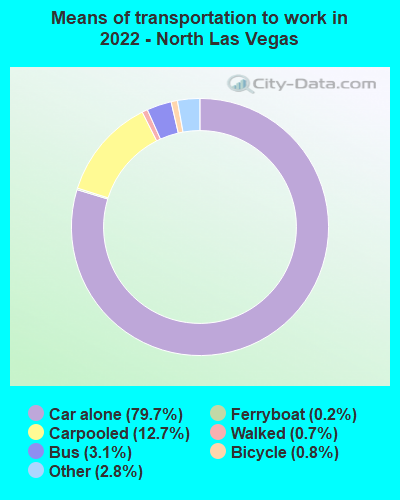
Means of transportation to work:
Drove a car alone: 59,772 (69.0%)Carpooled: 9,502 (11.0%)Bus : 2,321 (2.7%)Ferryboat: 139 (0.2%)Taxi: 2,097 (2.4%)Bicycle: 607 (0.7%)Walked: 525 (0.6%)Worked at home: 11,717 (13.5%)
Unemployment by race in 2022
Unemployment rate for White non-Hispanic residents 6.1% Males5.7% FemalesUnemployment rate for Black residents 12.2% Males6.8% FemalesUnemployment rate for American Indian and Alaska Native residents 13.9% Males1.9% FemalesUnemployment rate for Asian residents 7.0% Males5.1% FemalesUnemployment rate for other race residents 7.2% Males10.4% FemalesUnemployment rate for two or more race residents 8.2% Males5.4% FemalesUnemployment rate for Hispanic or Latino residents 7.7% Males7.1% Females
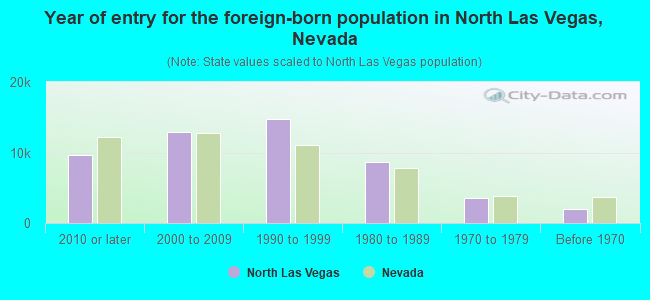
Year of entry for the foreign-born population in North Las Vegas, Nevada
9,578 2010 or later 12,919 2000 to 2009 14,728 1990 to 1999 8,711 1980 to 1989 3,524 1970 to 1979 1,938 Before 1970
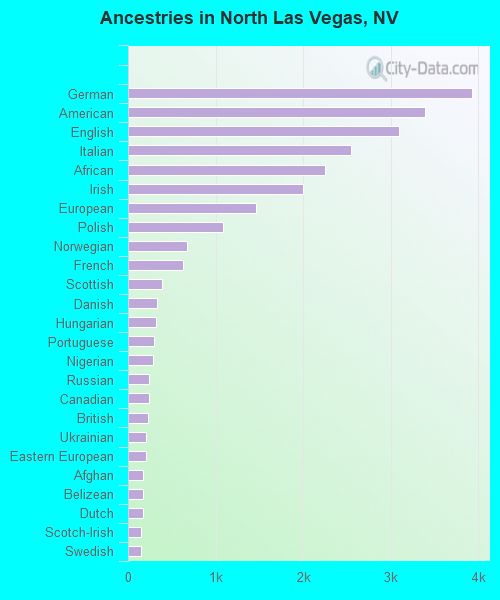
First ancestries reported:
German: 3,929 (2.4%)
American: 3,392 (2.1%)
English: 3,099 (1.9%)
Italian: 2,543 (1.6%)
African: 2,249 (1.4%)
Irish: 1,998 (1.2%)
European: 1,458 (0.9%)
Polish: 1,085 (0.7%)
Norwegian: 672 (0.4%)
French: 625 (0.4%)
Scottish: 388 (0.2%)
Danish: 337 (0.2%)
Hungarian: 321 (0.2%)
Portuguese: 297 (0.2%)
Nigerian: 285 (0.2%)
Russian: 245 (0.1%)
Canadian: 241 (0.1%)
British: 230 (0.1%)
Ukrainian: 209 (0.1%)
Eastern European: 209 (0.1%)
Afghan: 176 (0.1%)
Belizean: 171 (0.1%)
Dutch: 171 (0.1%)
Scotch-Irish: 151 (0.09%)
Swedish: 150 (0.09%)
Belgian: 130 (0.08%)
French Canadian: 99 (0.06%)
Slavic: 94 (0.06%)
Jamaican: 94 (0.06%)
Finnish: 93 (0.06%)
Czech: 93 (0.06%)
Iraqi: 82 (0.05%)
Sudanese: 80 (0.05%)
Northern European: 78 (0.05%)
West Indian: 75 (0.05%)
Scandinavian: 73 (0.04%)
Australian: 67 (0.04%)
Haitian: 65 (0.04%)
Greek: 62 (0.04%)
Croatian: 50 (0.03%)
Armenian: 50 (0.03%)
Turkish: 50 (0.03%)
Kenyan: 49 (0.03%)
Welsh: 49 (0.03%)
Trinidadian and Tobagonian: 47 (0.03%)
Zimbabwean: 41 (0.03%)
Austrian: 36 (0.02%)
Romanian: 32 (0.02%)
Ethiopian: 30 (0.02%)
Czechoslovakian: 27 (0.02%)
Basque: 27 (0.02%)
Cape Verdean: 26 (0.02%)
Israeli: 23 (0.01%)
Brazilian: 21 (0.01%)
Assyrian: 19 (0.01%)
Serbian: 17 (0.01%)
Egyptian: 16 (0.01%)
Bahamian: 15 (0.01%)
New Zealander: 15 (0.01%)
Iranian: 14 (0.01%)
Swiss: 14 (0.01%)
Slovak: 13 (0.01%)
Barbadian: 11 (0.01%)
Arab: 10 (0.01%)
Slovene: 9 (0.01%)
Most common places of birth for foreign-born residents (%): Mexico North Las Vegas:
56.6% (32,191)Nevada:
36.8% (218,248)
Philippines North Las Vegas:
16.2% (9,221)Nevada:
15.5% (91,628)
El Salvador North Las Vegas:
3.8% (2,142)Nevada:
4.0% (23,923)
Guatemala North Las Vegas:
2.7% (1,540)Nevada:
2.4% (14,384)
Place of birth for U.S.-born residents:
This state: 84,721Other state: 131,610Northeast: 12,755Midwest: 26,037South: 22,698West: 70,120 85.1% of North Las Vegas residents lived in the same house 1 years ago.
Out of people who lived in different houses, 41.1% lived in this county.
Out of people who lived in different counties, 6.8% lived in Nevada.
North Las Vegas:
85.1%State average:
86.4%
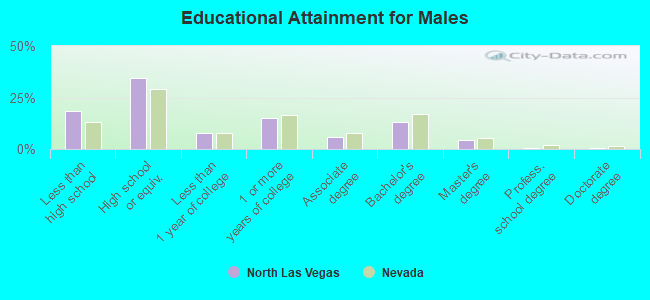
Education attainment for males 25 years and older:
No schooling: 3,543Nursery to 4th grade: 5895th and 6th grade: 2,3317th and 8th grade: 1,2469th grade: 1,18610th grade: 1,14511th grade: 1,65312th grade, no diploma: 4,567High school graduate (or equivalency): 30,314Less than 1 year of college: 6,836Some college more than 1 year, no degree: 13,122Associate degree: 5,212Bachelor's degree: 11,322Master's degree: 3,741Professional school degree: 298Doctorate degree: 363
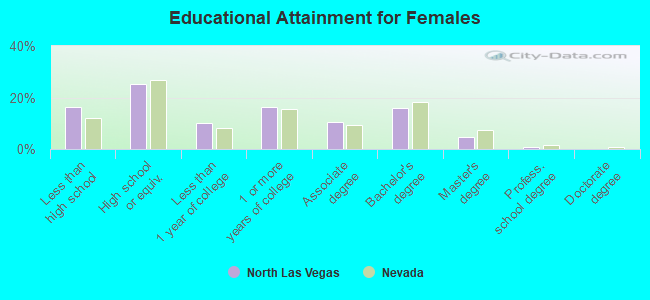
Education attainment for females 25 years and older:
No schooling: 4,365Nursery to 4th grade: 6535th and 6th grade: 2,0847th and 8th grade: 1,2759th grade: 1,67110th grade: 87911th grade: 1,15512th grade, no diploma: 3,299High school graduate (or equivalency): 23,994Less than 1 year of college: 9,667Some college more than 1 year, no degree: 15,520Associate degree: 9,881Bachelor's degree: 15,090Master's degree: 4,522Professional school degree: 824Doctorate degree: 162
Housing units in structures:
One, detached: 73,097One, attached: 4,293Two: 1,7253 or 4: 4,0595 to 9: 3,76110 to 19: 3,51920 to 49: 2,13950 or more: 3,243Mobile homes: 1,623Median worth of mobile homes: $138,530
Housing units lacking complete plumbing facilities in 2022: 0.6%Housing units lacking complete kitchen facilities in 2022: 0.9%House/condo owner moved in on average 6 years ago
Renter moved in on average 2 years ago
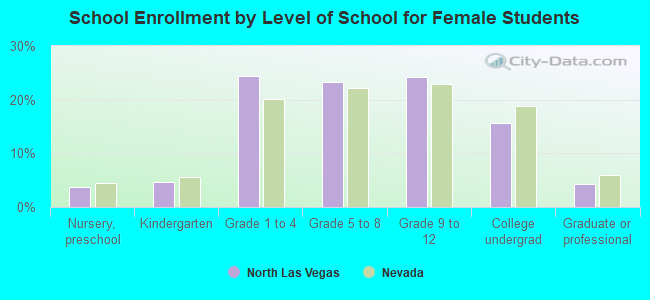
Private vs. public school enrollment:
Students in private schools in grades 1 to 8 (elementary and middle school): 4,317 Students in private schools in grades 9 to 12 (high school): 709 Students in private undergraduate colleges: 1,859