North Richland Hills, TX (Texas) Houses and Residents
| North Richland Hills: | $339,900 |
| Texas: | $275,400 |
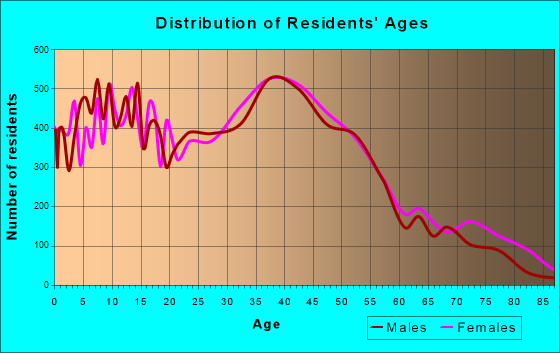
Total population: 68,529 (Urban population: 55,490, Rural population: 0)
Houses: 28,378 (27,946 occupied: 17,831 owner occupied, 10,115 renter occupied)
| % of renters here: | 36% |
| State: | 38% |
Housing density: 1,559 houses/condos per square mile
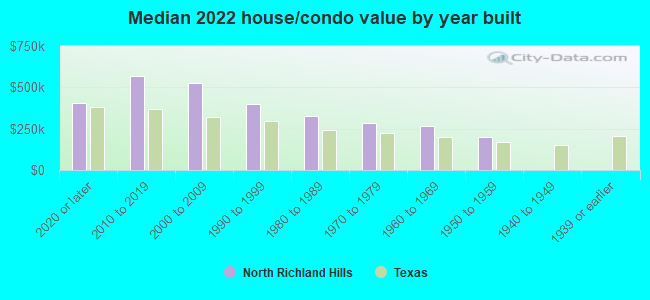
Median price asked for vacant for-sale houses and condos in 2022: $242,081.
Median contract rent in 2022: $1,402 (lower quartile is $1,129, upper quartile is $1,742)
Median rent asked for vacant for-rent units in 2022: $1,381
Median gross rent in North Richland Hills, TX in 2022: $1,672
Housing units in North Richland Hills with a mortgage: 10,600 (569 second mortgage, 7 home equity loan, 484 both second mortgage and home equity loan)
Houses without a mortgage: 16
Median household income for houses/condos with a mortgage: $119,188
Median household income for apartments without a mortgage: $68,944
Median monthly housing costs: $1,611
Compare current foreclosures in North Richland Hills, TX:
| Photo | Address | Area | Beds / Baths | Price | Details |
|---|---|---|---|---|---|

|
#1
Little Ranch Rd
North Richland Hills, TX 76182
|
2,889 sq. feet
|
3 baths 5 beds |
show details | |

|
#2
Greenacres Dr
North Richland Hills, TX 76182
|
1,900 sq. feet
|
2 baths 3 beds |
show details | |

|
#3
Bursey Rd
North Richland Hills, TX 76182
|
2,696 sq. feet
|
3 baths 4 beds |
show details | |

|
#4
Ken Michael Ct
North Richland Hills, TX 76180
|
1,224 sq. feet
|
2 baths 3 beds |
show details | |

|
#5
Ridgetop Rd
North Richland Hills, TX 76182
|
1,457 sq. feet
|
2 baths 3 beds |
show details | |

|
#6
Forrest Ln
North Richland Hills, TX 76182
|
1,799 sq. feet
|
2 baths 3 beds |
show details | |

|
#7
Greenacres Dr
North Richland Hills, TX 76182
|
1,640 sq. feet
|
2 baths 3 beds |
show details | |

|
#8
Briarwood Dr
North Richland Hills, TX 76182
|
1,681 sq. feet
|
2 baths 3 beds |
show details | |

|
#9
Saint Patrick St
North Richland Hills, TX 76180
|
1,440 sq. feet
|
2 baths 3 beds |
show details | |

|
#10
Hadley Dr
North Richland Hills, TX 76182
|
1,750 sq. feet
|
2 baths 3 beds |
show details |
| Photo | Address | Area | Beds / Baths | Price | Details |
|---|---|---|---|---|---|

|
#11
Wood View St
North Richland Hills, TX 76180
|
1,872 sq. feet
|
2 baths 4 beds |
show details | |

|
#12
Shannon Ln
North Richland Hills, TX 76180
|
1,807 sq. feet
|
3 baths 4 beds |
show details | |

|
#13
Meadow Ct
North Richland Hills, TX 76180
|
1,276 sq. feet
|
2 baths 3 beds |
show details | |

|
#14
Green Ridge Trl
North Richland Hills, TX 76182
|
1,582 sq. feet
|
2 baths 3 beds |
show details | |

|
#15
Onyx Dr S
North Richland Hills, TX 76180
|
1,277 sq. feet
|
1 baths 3 beds |
show details | |

|
#16
Eldorado Dr
North Richland Hills, TX 76180
|
1,698 sq. feet
|
2 baths 3 beds |
show details | |

|
#17
Driftwood Ct
North Richland Hills, TX 76182
|
1,704 sq. feet
|
2 baths 3 beds |
show details | |

|
#18
Dewsbury St
North Richland Hills, TX 76182
|
1,438 sq. feet
|
2 baths 3 beds |
show details | |

|
#19
Central Ave
North Richland Hills, TX 76182
|
2,118 sq. feet
|
4 baths 4 beds |
show details | |

|
#20
Dogwood Ln
North Richland Hills, TX 76182
|
1,768 sq. feet
|
2 baths 3 beds |
show details |
| Photo | Address | Area | Beds / Baths | Price | Details |
|---|---|---|---|---|---|

|
#21
Moss Ct
North Richland Hills, TX 76182
|
2,143 sq. feet
|
3 baths 4 beds |
show details | |

|
#22
Wesley Ct
North Richland Hills, TX 76180
|
1,764 sq. feet
|
2 baths 3 beds |
show details | |

|
#23
Villa Pointe Dr
North Richland Hills, TX 76182
|
- sq. feet
|
3 baths 3 beds |
show details | |

|
#24
Misty Meadow Dr
North Richland Hills, TX 76180
|
1,900 sq. feet
|
2 baths 4 beds |
show details | |

|
#25
Bursey Rd
North Richland Hills, TX 76182
|
3,700 sq. feet
|
2 baths 3 beds |
show details | |

|
#26
Georgia Ave
North Richland Hills, TX 76180
|
1,822 sq. feet
|
2 baths 3 beds |
show details | |

|
#27
Susan Lee Ln
North Richland Hills, TX 76180
|
1,448 sq. feet
|
2 baths 3 beds |
show details | |

|
#28
Greenwood Way
North Richland Hills, TX 76180
|
2,843 sq. feet
|
4 baths 4 beds |
show details | |

|
#29
Fair Meadows Dr
North Richland Hills, TX 76182
|
1,752 sq. feet
|
2 baths 3 beds |
show details | |

|
#30
Diamond Loch E
North Richland Hills, TX 76180
|
2,117 sq. feet
|
2 baths 4 beds |
show details |
| Photo | Address | Area | Beds / Baths | Price | Details |
|---|---|---|---|---|---|

|
#31
Cancun Dr
North Richland Hills, TX 76180
|
1,062 sq. feet
|
2 baths 2 beds |
show details | |

|
#32
Old Hickory Dr
North Richland Hills, TX 76182
|
1,845 sq. feet
|
2 baths 3 beds |
show details | |

|
#33
Winchester Rd
North Richland Hills, TX 76182
|
1,442 sq. feet
|
2 baths 3 beds |
show details | |

|
#34
Skylark Cir
North Richland Hills, TX 76180
|
3,070 sq. feet
|
2 baths 3 beds |
show details | |

|
#35
Briarridge Ct
North Richland Hills, TX 76182
|
1,522 sq. feet
|
2 baths 3 beds |
show details | |

|
#36
Whispering Woods Ln
North Richland Hills, TX 76182
|
2,113 sq. feet
|
2 baths 3 beds |
show details | |

|
#37
Wentwood Ct
North Richland Hills, TX 76182
|
2,652 sq. feet
|
2 baths 4 beds |
show details | |

|
#38
Sudbury Way
North Richland Hills, TX 76182
|
1,156 sq. feet
|
2 baths 3 beds |
show details | |

|
#39
Spring River Ln
North Richland Hills, TX 76180
|
2,128 sq. feet
|
2 baths 3 beds |
show details | |

|
#40
Main St
North Richland Hills, TX 76182
|
- sq. feet
|
- baths - beds |
show details |
| Photo | Address | Area | Beds / Baths | Price | Details |
|---|---|---|---|---|---|

|
#41
Edinburg Dr
North Richland Hills, TX 76182
|
- sq. feet
|
- baths - beds |
show details | |

|
#42
Christy Ct
North Richland Hills, TX 76182
|
- sq. feet
|
- baths - beds |
show details | |

|
#43
Redondo St
North Richland Hills, TX 76180
|
- sq. feet
|
- baths - beds |
show details | |

|
#44
Eagle Crest Dr
North Richland Hills, TX 76180
|
- sq. feet
|
- baths - beds |
show details | |

|
#45
Redding St
North Richland Hills, TX 76180
|
- sq. feet
|
- baths - beds |
show details | |

|
#46
Saint Andrews Dr
North Richland Hills, TX 76180
|
- sq. feet
|
- baths - beds |
show details | |

|
#47
Iron Horse Blvd # 1101
North Richland Hills, TX 76180
|
- sq. feet
|
- baths - beds |
show details | |

|
#48
Cancun Dr
North Richland Hills, TX 76180
|
- sq. feet
|
- baths - beds |
show details | |

|
#49
Shauna Dr
North Richland Hills, TX 76180
|
- sq. feet
|
- baths - beds |
show details | |

|
Check over 1 million property listings on Foreclosure.com!
|
browse all offers | |||


 | Nice Apartments in North Richland Hills (6 replies) |
| What is going on with all of this 400K homes listed at 600K (113 replies) |
| Apartments in HEB area? (10 replies) |
| Is the DFW real estate market cooling off? (361 replies) |
| House Hunting...need Quick Advice (83 replies) |
| The DFW area has the #1 U.S. home market, says Freddie Mac... (113 replies) |
Median year apartment built: 1987
Household type by relationship:
Households: 70,666- Male householders: 13,448 (3,582 living alone), Female householders: 14,498 (3,788 living alone)
14,639 spouses (14,505 opposite-sex spouses), 2,311 unmarried partners, (1,642 opposite-sex unmarried partners), 20,224 children (18,682 natural, 763 adopted, 779 stepchildren), 751 grandchildren, 510 brothers or sisters, 350 parents, 0 foster children, 945 other relatives, 2,624 non-relatives
- In group quarters: 366
Size of family households: 9,361 2-persons, 3,587 3-persons, 3,513 4-persons, 1,155 5-persons, 146 6-persons, 575 7-or-more-persons.
Size of nonfamily households: 7,370 1-person, 1,909 2-persons, 102 4-persons, 228 7-or-more-persons.
10,389 married couples with children.
3,340 single-parent households (616 men, 2,724 women).
80.5% of residents of North Richland Hills speak English at home.
12.3% of residents speak Spanish at home (72% speak English very well, 16% speak English well, 8% speak English not well, 4% don't speak English at all).
3.5% of residents speak other Indo-European language at home (64% speak English very well, 28% speak English well, 7% speak English not well).
2.0% of residents speak Asian or Pacific Island language at home (52% speak English very well, 39% speak English well, 8% speak English not well, 1% don't speak English at all).
1.8% of residents speak other language at home (66% speak English very well, 27% speak English well, 6% speak English not well).
Foreign born population: 6,388 (9.0%)
(46.7% of them are naturalized citizens)
| Here: | 6.6 |
| State: | 6.3 |
| Here: | 4.2 |
| State: | 4.0 |
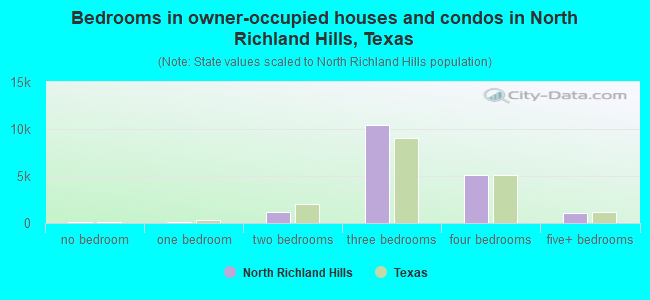
- Bedrooms in owner-occupied houses and condos in North Richland Hills, Texas
- 124no bedroom
- 881 bedroom
- 1,1432 bedrooms
- 10,3863 bedrooms
- 5,0584 bedrooms
- 1,0325+ bedrooms
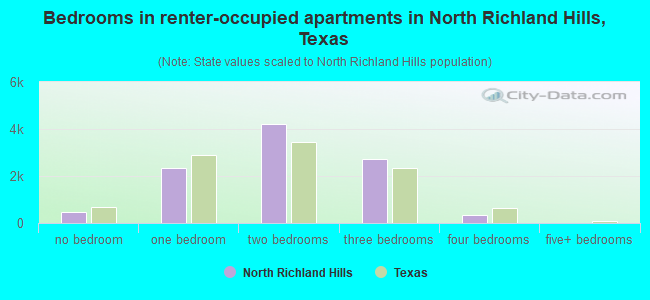
- Bedrooms in renter-occupied apartments in North Richland Hills, Texas
- 470no bedroom
- 2,3361 bedroom
- 4,2252 bedrooms
- 2,7433 bedrooms
- 3414 bedrooms
- 05+ bedrooms
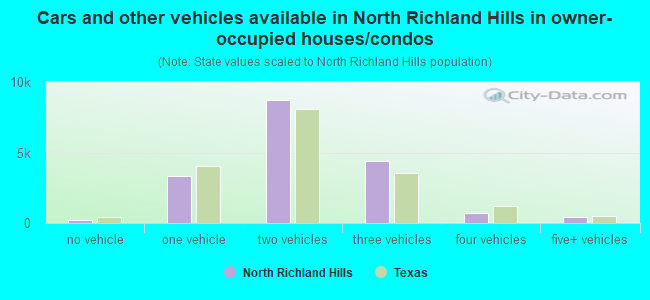
- Cars and other vehicles available in North Richland Hills in owner-occupied houses/condos
- 229no vehicle
- 3,3401 vehicle
- 8,7062 vehicles
- 4,4013 vehicles
- 7354 vehicles
- 4205+ vehicles
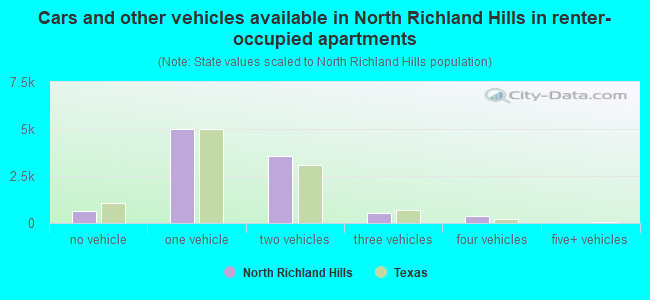
- Cars and other vehicles available in North Richland Hills in renter-occupied apartments
- 616no vehicle
- 5,0051 vehicle
- 3,5792 vehicles
- 5273 vehicles
- 3884 vehicles
- 05+ vehicles
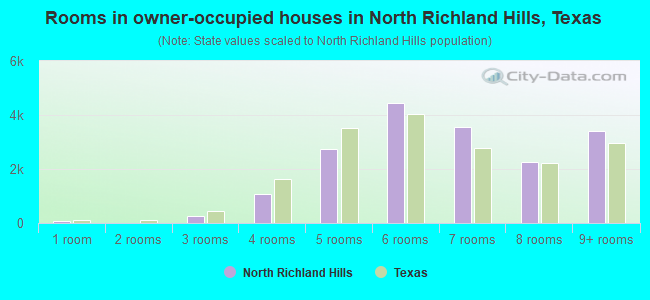
- Rooms in owner-occupied houses in North Richland Hills, Texas
- 781 room
- 02 rooms
- 2543 rooms
- 1,0914 rooms
- 2,7315 rooms
- 4,4626 rooms
- 3,5497 rooms
- 2,2558 rooms
- 3,4119+ rooms
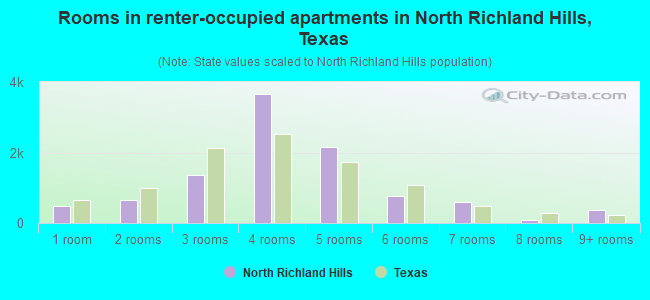
- Rooms in renter-occupied apartments in North Richland Hills, Texas
- 4701 room
- 6642 rooms
- 1,3693 rooms
- 3,6564 rooms
- 2,1425 rooms
- 7586 rooms
- 6037 rooms
- 848 rooms
- 3699+ rooms
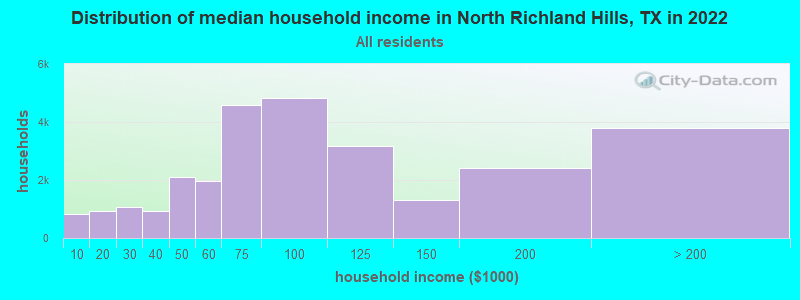
North Richland Hills, TX household income distribution

- 819Less than $10,000
- 936$10,000 to $19,999
- 1,066$20,000 to $29,999
- 939$30,000 to $39,999
- 2,110$40,000 to $49,999
- 1,964$50,000 to $59,999
- 4,580$60,000 to $74,999
- 4,837$75,000 to $99,999
- 3,160$100,000 to $124,999
- 1,323$125,000 to $149,999
- 2,428$150,000 to $199,999
- 3,784$200,000 or more
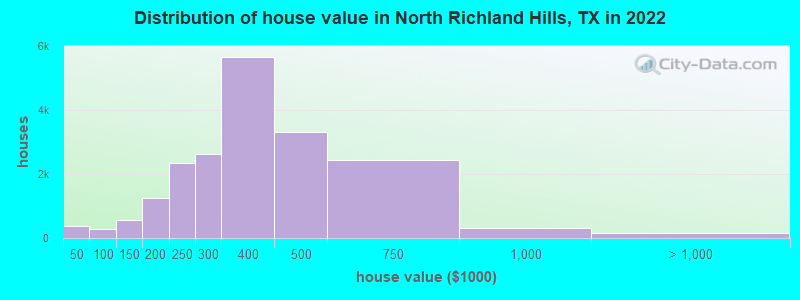
Home value of owner - occupied houses in 2022 in North Richland Hills, TX
-
- 127Less than $10,000
- 7$10,000 to $14,999
- 28$15,000 to $19,999
- 145$20,000 to $24,999
- 36$25,000 to $29,999
- 22$30,000 to $34,999
- 10$40,000 to $49,999
- 60$50,000 to $59,999
- 95$70,000 to $79,999
- 65$80,000 to $89,999
- 37$90,000 to $99,999
- 315$100,000 to $124,999
- 241$125,000 to $149,999
- 603$150,000 to $174,999
- 650$175,000 to $199,999
- 2,338$200,000 to $249,999
- 2,631$250,000 to $299,999
- 5,652$300,000 to $399,999
- 3,315$400,000 to $499,999
- 2,446$500,000 to $749,999
- 299$750,000 to $999,999
- 66$1,000,000 to $1,499,999
- 74$2,000,000 or more
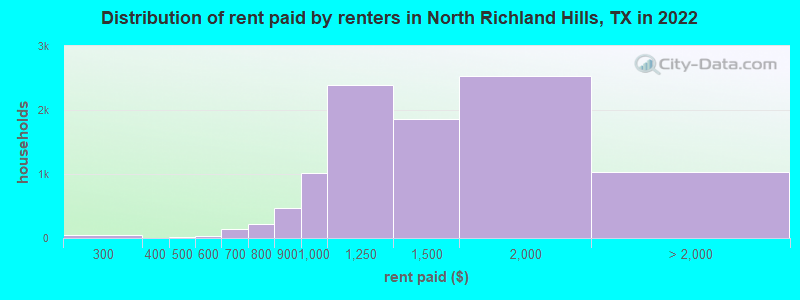
Rent paid by renters in 2022 in North Richland Hills, TX
-
- 12Less than $100
- 53$250 to $299
- 21$400 to $449
- 8$500 to $549
- 17$550 to $599
- 96$600 to $649
- 47$650 to $699
- 70$700 to $749
- 141$750 to $799
- 465$800 to $899
- 1,012$900 to $999
- 2,385$1,000 to $1,249
- 1,861$1,250 to $1,499
- 2,533$1,500 to $1,999
- 404$2,000 to $2,499
- 243$2,500 to $2,999
- 48$3,000 to $3,499
- 67$3,500 or more
- 267No cash rent
Percentage of workers working in this county: 80.3%
Number of people working at home: 6,505 (17.3% of all workers)
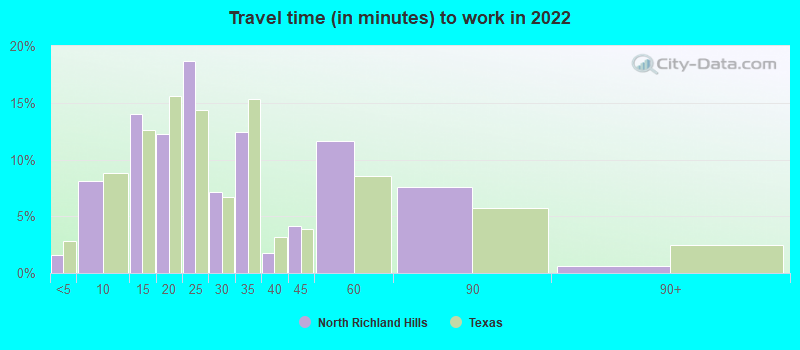
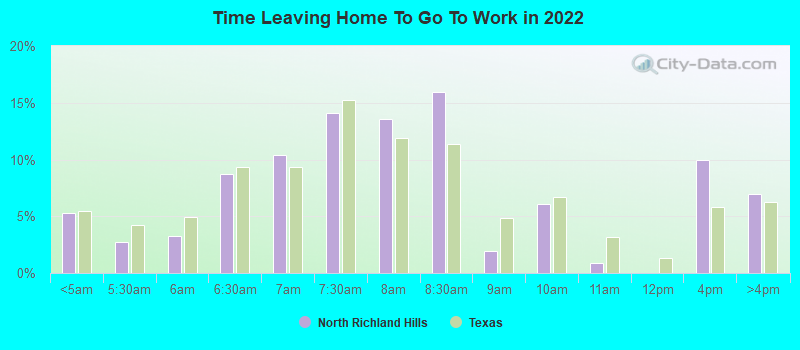
Travel time to work (commute)
- Less than 5 minutes: 665
- 5 to 9 minutes: 1,780
- 10 to 14 minutes: 2,742
- 15 to 19 minutes: 5,447
- 20 to 24 minutes: 3,556
- 25 to 29 minutes: 1,887
- 30 to 34 minutes: 7,097
- 35 to 39 minutes: 1,073
- 40 to 44 minutes: 1,113
- 45 to 59 minutes: 2,496
- 60 to 89 minutes: 1,802
- 90 or more minutes: 215
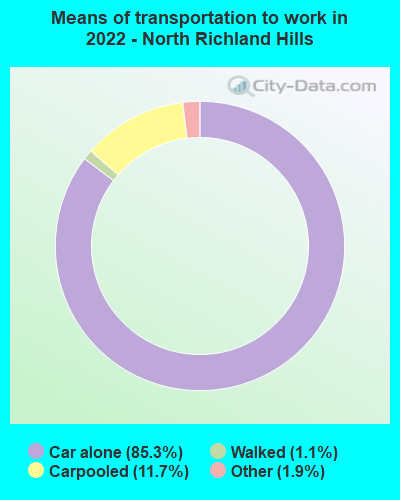
Means of transportation to work:
- Drove a car alone: 18,295 (66.7%)
- Carpooled: 2,606 (9.5%)
- Taxi: 488 (1.8%)
- Bicycle: 5 (0.0%)
- Walked: 236 (0.9%)
- Worked at home: 6,505 (23.7%)
- Unemployment by race in 2022
- Unemployment rate for White non-Hispanic residents
- 1.6%Males
- Unemployment rate for Black residents
- 11.7%Males
- 3.8%Females
- Unemployment rate for American Indian and Alaska Native residents
- 6.5%Females
- Unemployment rate for Asian residents
- 1.1%Males
- 4.3%Females
- Unemployment rate for other race residents
- 3.4%Females
- Unemployment rate for two or more race residents
- 3.8%Males
- 2.9%Females
- Unemployment rate for Hispanic or Latino residents
- 3.2%Males
- 2.6%Females
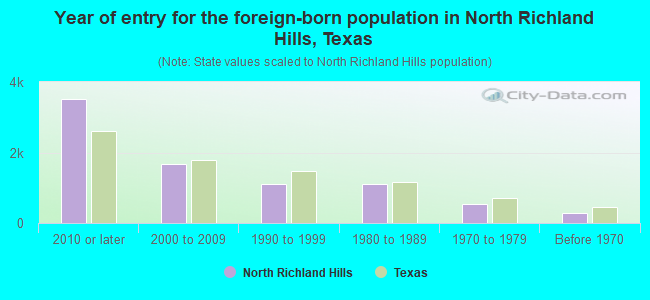
- Year of entry for the foreign-born population in North Richland Hills, Texas
- 3,5042010 or later
- 1,6632000 to 2009
- 1,1181990 to 1999
- 1,0991980 to 1989
- 5261970 to 1979
- 291Before 1970
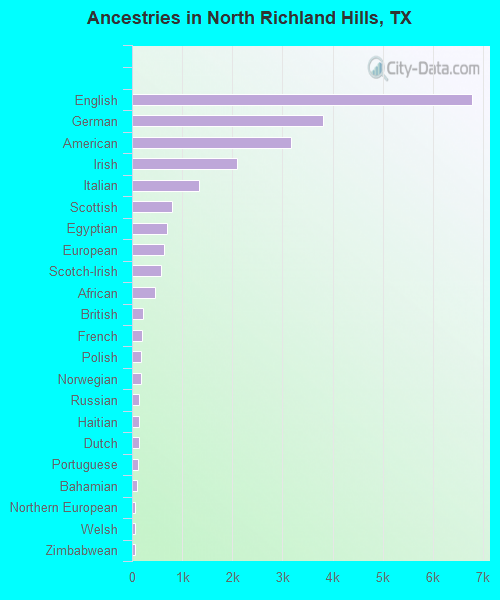
First ancestries reported:
- English: 6,778 (18.2%)
- German: 3,813 (10.2%)
- American: 3,173 (8.5%)
- Irish: 2,093 (5.6%)
- Italian: 1,338 (3.6%)
- Scottish: 796 (2.1%)
- Egyptian: 692 (1.9%)
- European: 637 (1.7%)
- Scotch-Irish: 581 (1.6%)
- African: 458 (1.2%)
- British: 210 (0.6%)
- French: 192 (0.5%)
- Polish: 182 (0.5%)
- Norwegian: 172 (0.5%)
- Russian: 148 (0.4%)
- Haitian: 140 (0.4%)
- Dutch: 138 (0.4%)
- Portuguese: 128 (0.3%)
- Bahamian: 104 (0.3%)
- Northern European: 69 (0.2%)
- Welsh: 66 (0.2%)
- Zimbabwean: 62 (0.2%)
- Danish: 58 (0.2%)
- Palestinian: 55 (0.1%)
- Eastern European: 49 (0.1%)
- Finnish: 48 (0.1%)
- Ethiopian: 44 (0.1%)
- Brazilian: 41 (0.1%)
- Czech: 33 (0.09%)
- Swedish: 33 (0.09%)
- Hungarian: 28 (0.08%)
- Scandinavian: 27 (0.07%)
- West Indian: 25 (0.07%)
- French Canadian: 25 (0.07%)
- Nigerian: 23 (0.06%)
- Greek: 23 (0.06%)
- Albanian: 19 (0.05%)
- Lebanese: 17 (0.05%)
- Canadian: 16 (0.04%)
- Romanian: 13 (0.03%)
- Maltese: 12 (0.03%)
- Belgian: 11 (0.03%)
- Jamaican: 11 (0.03%)
- Sudanese: 10 (0.03%)
- Iranian: 7 (0.02%)
- Croatian: 7 (0.02%)
- Cape Verdean: 7 (0.02%)
- Swiss: 5 (0.01%)
- Slovene: 4 (0.01%)
Most common places of birth for foreign-born residents (%):
| North Richland Hills: | 26.5% (2,086) |
| Texas: | 48.4% (2,411,723) |
| North Richland Hills: | 9.1% (715) |
| Texas: | 0.3% (14,588) |
| North Richland Hills: | 6.3% (499) |
| Texas: | 1.5% (72,413) |
| North Richland Hills: | 6.3% (496) |
| Texas: | 3.7% (184,770) |
| North Richland Hills: | 3.7% (291) |
| Texas: | 1.2% (61,555) |
| North Richland Hills: | 3.3% (263) |
| Texas: | 0.6% (27,480) |
| North Richland Hills: | 2.8% (222) |
| Texas: | 2.1% (103,148) |
| North Richland Hills: | 2.7% (216) |
| Texas: | 4.5% (224,455) |
| North Richland Hills: | 2.5% (200) |
| Texas: | 0.1% (6,376) |
| North Richland Hills: | 2.4% (186) |
| Texas: | 0.3% (15,833) |
| North Richland Hills: | 2.3% (185) |
| Texas: | 6.1% (306,347) |
| North Richland Hills: | 2.1% (166) |
| Texas: | 1.2% (60,172) |
| North Richland Hills: | 2.1% (164) |
| Texas: | 1.8% (87,382) |
| North Richland Hills: | 2.1% (164) |
| Texas: | 1.2% (62,159) |
Place of birth for U.S.-born residents:
- This state: 40,452
- Other state: 20,851
- Northeast: 2,715
- Midwest: 6,348
- South: 7,386
- West: 4,402
85.2% of North Richland Hills residents lived in the same house 1 years ago.
Out of people who lived in different houses, 39.5% lived in this county.
Out of people who lived in different counties, 52.1% lived in Texas.
| North Richland Hills: | 85.2% |
| State average: | 85.7% |
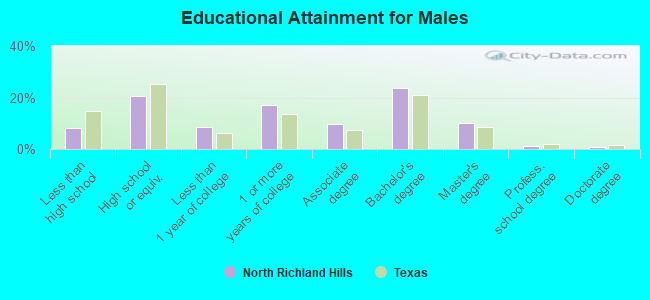
Education attainment for males 25 years and older:
- No schooling: 424
- Nursery to 4th grade: 61
- 5th and 6th grade: 53
- 7th and 8th grade: 173
- 9th grade: 174
- 10th grade: 294
- 11th grade: 213
- 12th grade, no diploma: 516
- High school graduate (or equivalency): 4,813
- Less than 1 year of college: 1,992
- Some college more than 1 year, no degree: 4,021
- Associate degree: 2,226
- Bachelor's degree: 5,508
- Master's degree: 2,373
- Professional school degree: 279
- Doctorate degree: 162
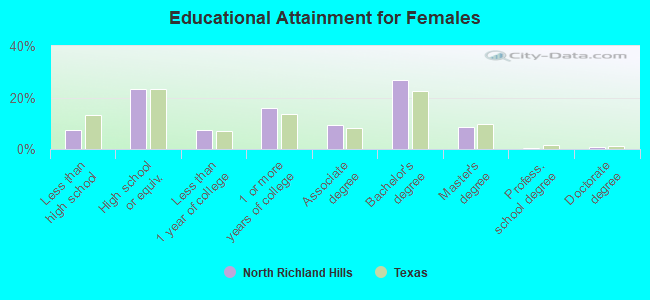
Education attainment for females 25 years and older:
- No schooling: 353
- Nursery to 4th grade: 268
- 5th and 6th grade: 127
- 7th and 8th grade: 108
- 9th grade: 44
- 10th grade: 100
- 11th grade: 248
- 12th grade, no diploma: 676
- High school graduate (or equivalency): 6,122
- Less than 1 year of college: 1,908
- Some college more than 1 year, no degree: 4,240
- Associate degree: 2,471
- Bachelor's degree: 7,108
- Master's degree: 2,286
- Professional school degree: 130
- Doctorate degree: 190
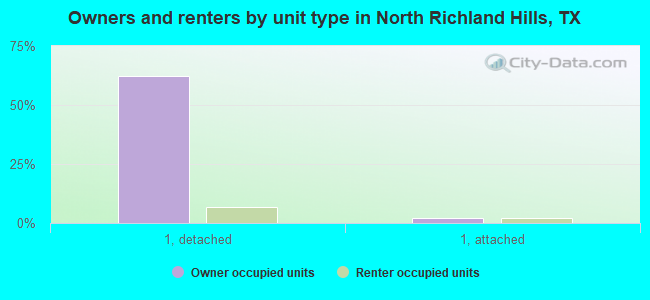
Housing units in structures:
- One, detached: 19,375
- One, attached: 1,408
- Two: 58
- 3 or 4: 850
- 5 to 9: 2,870
- 10 to 19: 1,226
- 20 to 49: 946
- 50 or more: 1,370
- Mobile homes: 275
Housing units lacking complete kitchen facilities in 2022: 2.1%
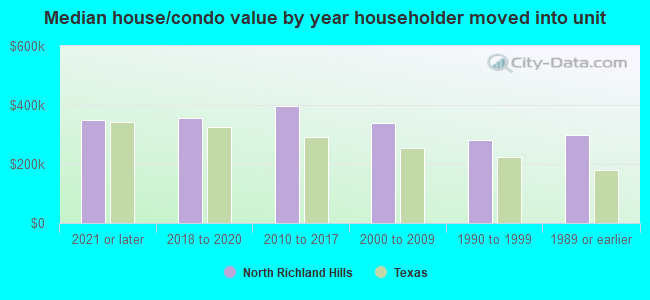
House/condo owner moved in on average 12 years ago
Renter moved in on average 2 years ago
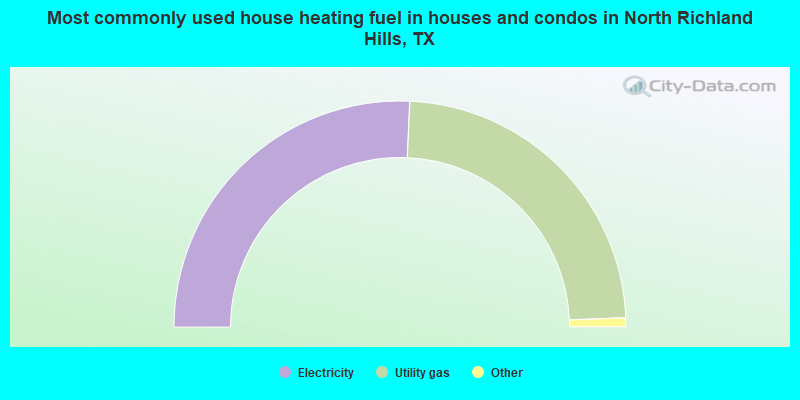
- 51.4%Electricity
- 47.3%Utility gas
- 0.6%Bottled, tank, or LP gas
- 0.5%Solar energy
- 0.2%No fuel used
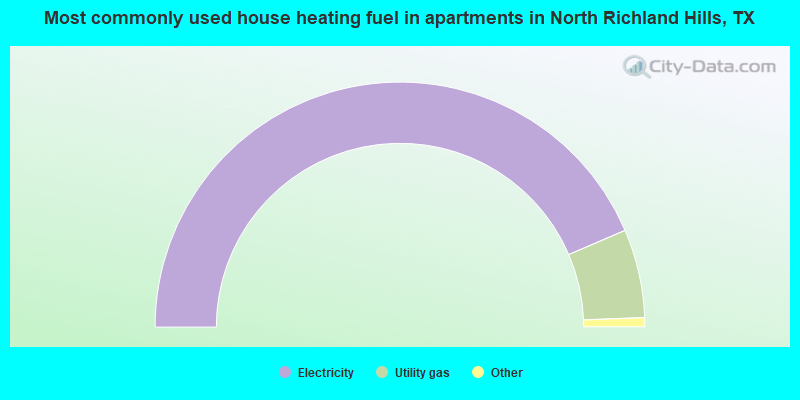
- 87.1%Electricity
- 11.7%Utility gas
- 0.7%No fuel used
- 0.5%Bottled, tank, or LP gas
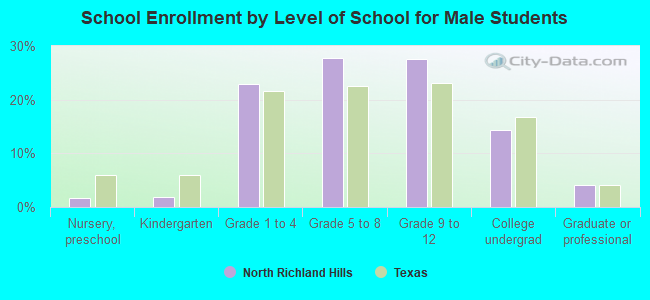
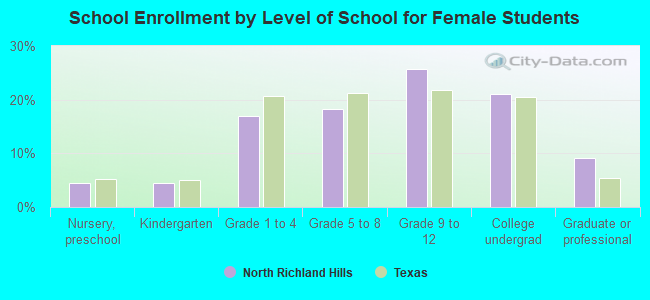
Private vs. public school enrollment:
| Here: | 8.4% |
| Texas: | 8.8% |
| Here: | 8.8% |
| Texas: | 8.0% |
| Here: | 6.2% |
| Texas: | 16.2% |