Northbrook, IL (Illinois) Houses and Residents
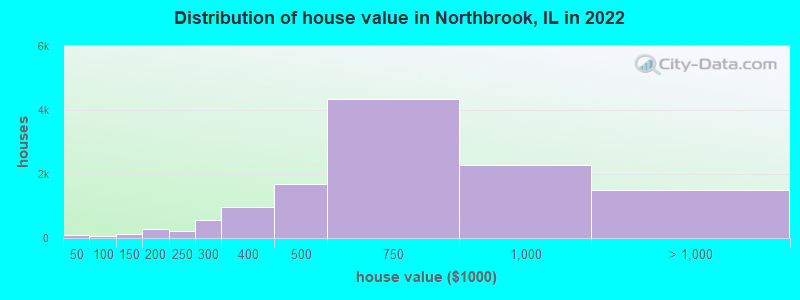
Estimated median house or condo value in 2022: $637,897 (it was $353,100 in 2000 )
Northbrook:
$637,897Illinois:
$251,600
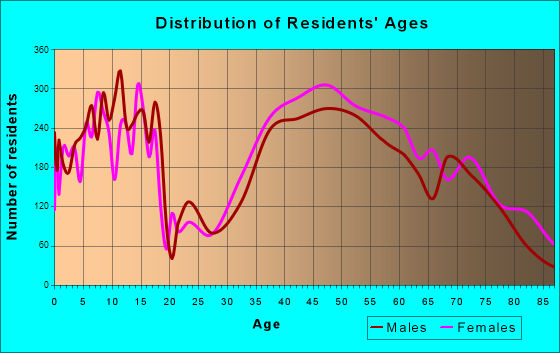
Lower value quartile - upper value quartile: $463,373 - $848,693Total population: 33,655 (Urban population: 33,425, Rural population: 0)
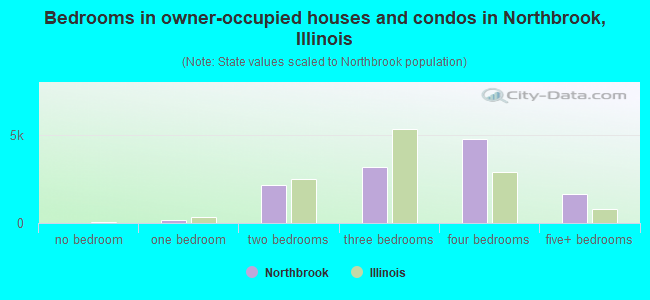
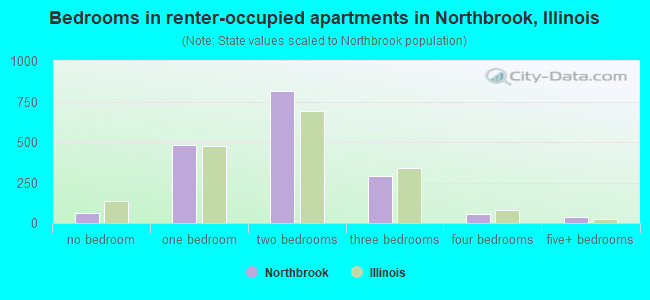
Houses: 14,929 (13,538 occupied: 12,028 owner occupied, 1,741 renter occupied )
% of renters here:
13%State:
33%
Housing density: 1,156 houses/condos per square mile
Median price asked for vacant for-sale houses and condos in 2022: $403,468.
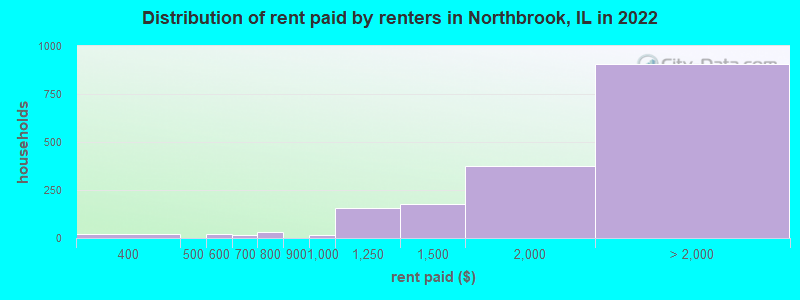
Median contract rent in 2022: $1,969 (lower quartile is $1,420, upper quartile is over $2,000)
Median rent asked for vacant for-rent units in 2022: $3,815
Median gross rent in Northbrook, IL in 2022: $1,988
Housing units in Northbrook with a mortgage: 7,109 (973 second mortgage, 32 home equity loan, 863 both second mortgage and home equity loan )Houses without a mortgage: 482
Median household income for houses/condos with a mortgage: $207,242
Median household income for apartments without a mortgage: $129,018
Median monthly housing costs: $2,365
Data:
Median house or condo value ($)
Median house or condo value ($ change since 2000)
Median house or condo value ($) - White
Median house or condo value ($) - Black or African American
Median house or condo value ($) - Asian
Median house or condo value ($) - Hispanic or Latino
Median house or condo value ($) - American Indian and Alaska Native
Median house or condo value ($) - Multirace
Median house or condo value ($) - Other Race
Median price asked for mobile homes ($)
Household density (households per square mile)
Mean house or condo value by units in structure - 1, detached ($)
Mean house or condo value by units in structure - 1, attached ($)
Mean house or condo value by units in structure - 2 ($)
Mean house or condo value by units in structure by units in structure - 3 or 4 ($)
Mean house or condo value by units in structure - 5 or more ($)
Mean house or condo value by units in structure - Boat, RV, van, etc. ($)
Mean house or condo value by units in structure - Mobile home ($)
Median contract rent ($)
Median contract rent - Lower quartile ($)
Median contract rent - Upper quartile ($)
Median gross rent ($)
Urban houses (%)
Rural houses (%)
Houses occupied (%)
Houses occupied (% change since 2000)
Houses owner occupied (%)
Houses owner occupied (% change since 2000)
Houses renter occupied (%)
Houses renter occupied (% change since 2000)
Vacant housing units - For rent (%)
Vacant housing units - For rent (% change since 2000)
Vacant housing units - For sale only (%)
Vacant housing units - For sale only (% change since 2000)
Vacant housing units - Rented or sold, not occupied (%)
Vacant housing units - Rented or sold, not occupied (% change since 2000)
Vacant housing units - For seasonal, recreational, or occasional use (%)
Vacant housing units - For seasonal, recreational, or occasional use (% change since 2000)
Vacant housing units - For migrant workers (%)
Vacant housing units - For migrant workers (% change since 2000)
Vacant housing units - Other vacant (%)
Vacant housing units - Other vacant (% change since 2000)
Median monthly housing costs ($)
Median household income for houses/condos with a mortgage ($)
Median household income for houses/condos without a mortgage ($)
Median household income ($)
Median household income ($) - White
Median household income ($) - Black or African American
Median household income ($) - Asian
Median household income ($) - Hispanic or Latino
Median household income ($) - American Indian and Alaska Native
Median household income ($) - Multirace
Median household income ($) - Other Race
Mortgage status - with mortgage (%)
Mortgage status - with second mortgage (%)
Mortgage status - with home equity loan (%)
Mortgage status - with both second mortgage and home equity loan (%)
Mortgage status - without a mortgage (%)
Median year house/condo built
Median year apartment built
Household type by relationship - Male householder living alone (%)
Household type by relationship - Male householder not living alone (%)
Household type by relationship - Female householder living alone (%)
Household type by relationship - Female householder not living alone (%)
Household type by relationship - Opposite-Sex spouse (%)
Household type by relationship - Same-Sex spouse (%)
Household type by relationship - Opposite-Sex unmarried partner (%)
Household type by relationship - Same-Sex unmarried partner (%)
Household type by relationship - In group quarters (%)
Size of family households - 2-person household (%)
Size of family households - 3-person household (%)
Size of family households - 4-person household (%)
Size of family households - 5-person household (%)
Size of family households - 6-person household (%)
Size of family households - 7-or-more-person household (%)
Size of nonfamily households - 1-person household (%)
Size of nonfamily households - 2-person household (%)
Size of nonfamily households - 3-person household (%)
Size of nonfamily households - 4-person household (%)
Size of nonfamily households - 5-person household (%)
Size of nonfamily households - 6-person household (%)
Size of nonfamily households - 7-or-moreperson household (%)
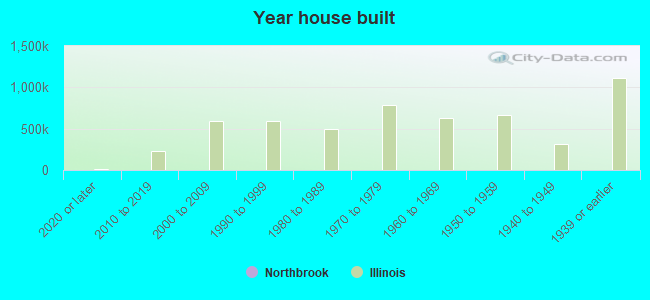
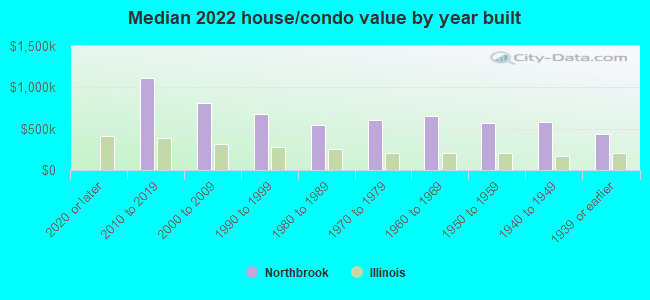
Year house built - Built 2010 or later (%)
Year house built - Built 2000 to 2009 (%)
Year house built - Built 1990 to 1999 (%)
Year house built - Built 1980 to 1989 (%)
Year house built - Built 1970 to 1979 (%)
Year house built - Built 1960 to 1969 (%)
Year house built - Built 1950 to 1959 (%)
Year house built - Built 1940 to 1949 (%)
Year house built - Built 1939 or earlier (%)
Median number of rooms in houses and condos
Median number of rooms in apartments
Median number of bedrooms in owner occupied houses
Mean number of bedrooms in owner occupied houses
Median number of bedrooms in renter occupied houses
Mean number of bedrooms in renter occupied houses
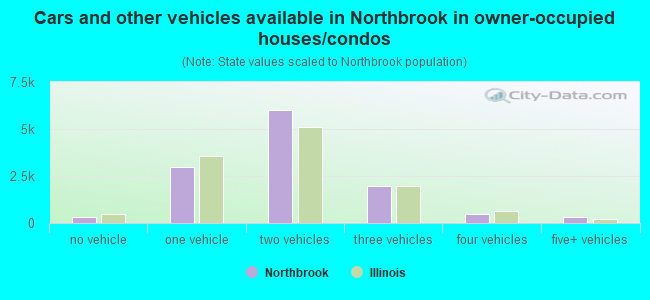
Median number of vehichles in owner occupied houses
Mean number of vehichles in owner occupied houses
Median number of vehichles in renter occupied houses
Mean number of vehichles in renter occupied houses
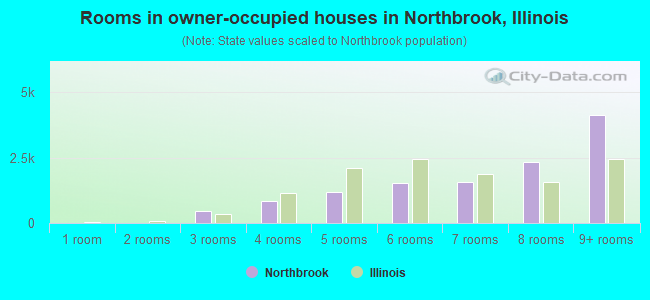
Rooms in owner-occupied houses - 1 room (%)
Rooms in owner-occupied houses - 2 rooms (%)
Rooms in owner-occupied houses - 3 rooms (%)
Rooms in owner-occupied houses - 4 rooms (%)
Rooms in owner-occupied houses - 5 rooms (%)
Rooms in owner-occupied houses - 6 rooms (%)
Rooms in owner-occupied houses - 7 rooms (%)
Rooms in owner-occupied houses - 8 rooms (%)
Rooms in owner-occupied houses - 9+ rooms (%)
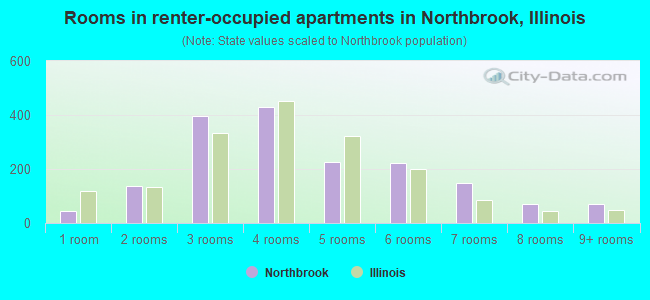
Rooms in renter-occupied houses - 1 room (%)
Rooms in renter-occupied houses - 2 rooms (%)
Rooms in renter-occupied houses - 3 rooms (%)
Rooms in renter-occupied houses - 4 rooms (%)
Rooms in renter-occupied houses - 5 rooms (%)
Rooms in renter-occupied houses - 6 rooms (%)
Rooms in renter-occupied houses - 7 rooms (%)
Rooms in renter-occupied houses - 8 rooms (%)
Rooms in renter-occupied houses - 9+ rooms (%)
Bedrooms in owner-occupied houses - no bedrooms (%)
Bedrooms in owner-occupied houses - 1 bedroom (%)
Bedrooms in owner-occupied houses - 2 bedrooms (%)
Bedrooms in owner-occupied houses - 3 bedrooms (%)
Bedrooms in owner-occupied houses - 4 bedrooms (%)
Bedrooms in owner-occupied houses - 5+ bedrooms (%)
Bedrooms in renter-occupied houses - no bedrooms (%)
Bedrooms in renter-occupied houses - 1 bedroom (%)
Bedrooms in renter-occupied houses - 2 bedrooms (%)
Bedrooms in renter-occupied houses - 3 bedrooms (%)
Bedrooms in renter-occupied houses - 4 bedrooms (%)
Bedrooms in renter-occupied houses - 5+ bedrooms (%)
Vehicles available in owner-occupied houses - no vehicle available (%)
Vehicles available in owner-occupied houses - 1 vehicle available(%)
Vehicles available in owner-occupied houses - 2 Vehicles available (%)
Vehicles available in owner-occupied houses - 3 Vehicles available (%)
Vehicles available in owner-occupied houses - 4 Vehicles available (%)
Vehicles available in owner-occupied houses - 5+ Vehicles available (%)
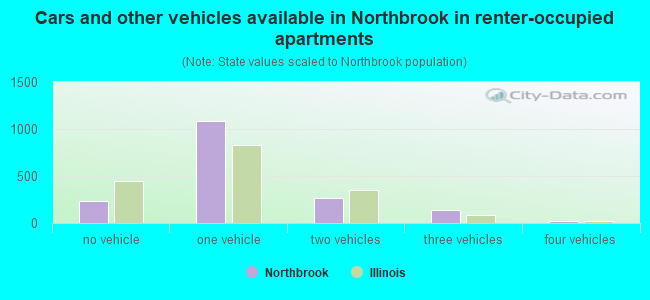
Vehicles available in renter-occupied houses - no vehicle available (%)
Vehicles available in renter-occupied houses - 1 vehicle available (%)
Vehicles available in renter-occupied houses - 2 Vehicles available (%)
Vehicles available in renter-occupied houses - 3 Vehicles available (%)
Vehicles available in renter-occupied houses - 4 Vehicles available (%)
Vehicles available in renter-occupied houses - 5+ Vehicles available (%)
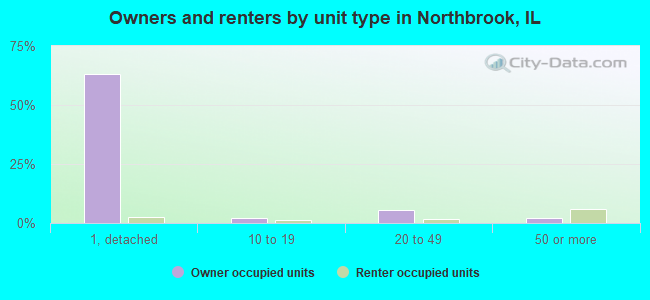
Housing units in structures - 1, detached (%)
Housing units in structures - 1, attached (%)
Housing units in structures - 2 (%)
Housing units in structures - 3 or 4 (%)
Housing units in structures - 5 to 9 (%)
Housing units in structures - 10 to 19 (%)
Housing units in structures - 20 to 49 (%)
Housing units in structures - 50 or more (%)
Housing units in structures - Mobile home (%)
Housing units in structures - Boat, RV, van, etc. (%)
Housing units in structures - Owners - 1, detached (%)
Housing units in structures - Owners - 1, attached (%)
Housing units in structures - Owners - 2 (%)
Housing units in structures - Owners - 3 or 4 (%)
Housing units in structures - Owners - 5 to 9 (%)
Housing units in structures - Owners - 10 to 19 (%)
Housing units in structures - Owners - 20 to 49 (%)
Housing units in structures - Owners - 50 or more (%)
Housing units in structures - Owners - Mobile home (%)
Housing units in structures - Owners - Boat, RV, van, etc. (%)
Housing units in structures - Renters - 1, detached (%)
Housing units in structures - Renters - 1, attached (%)
Housing units in structures - Renters - 2 (%)
Housing units in structures - Renters - 3 or 4 (%)
Housing units in structures - Renters - 5 to 9 (%)
Housing units in structures - Renters - 10 to 19 (%)
Housing units in structures - Renters - 20 to 49 (%)
Housing units in structures - Renters - 50 or more (%)
Housing units in structures - Renters - Mobile home (%)
Housing units in structures - Renters - Boat, RV, van, etc. (%)
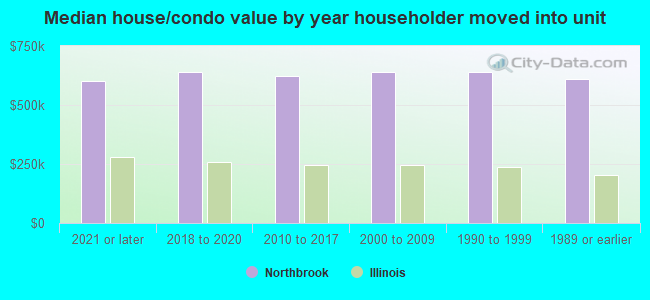
House/condo owner moved in on average (years ago)
Renter moved in on average (years ago)
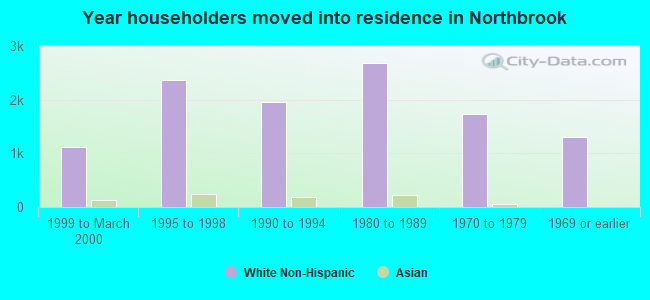
Year householder moved into unit - Moved in 1999 to March 2000 (%)
Year householder moved into unit - Moved in 1999 to March 2000 (%) - White
Year householder moved into unit - Moved in 1999 to March 2000 (%) - Black or African American
Year householder moved into unit - Moved in 1999 to March 2000 (%) - Asian
Year householder moved into unit - Moved in 1999 to March 2000 (%) - Hispanic or Latino
Year householder moved into unit - Moved in 1999 to March 2000 (%) - American Indian and Alaska Native
Year householder moved into unit - Moved in 1999 to March 2000 (%) - Multirace
Year householder moved into unit - Moved in 1999 to March 2000 (%) - Other Race
Year householder moved into unit - Moved in 1995 to 1998 (%)
Year householder moved into unit - Moved in 1995 to 1998 (%) - White
Year householder moved into unit - Moved in 1995 to 1998 (%) - Black or African American
Year householder moved into unit - Moved in 1995 to 1998 (%) - Asian
Year householder moved into unit - Moved in 1995 to 1998 (%) - Hispanic or Latino
Year householder moved into unit - Moved in 1995 to 1998 (%) - American Indian and Alaska Native
Year householder moved into unit - Moved in 1995 to 1998 (%) - Multirace
Year householder moved into unit - Moved in 1995 to 1998 (%) - Other Race
Year householder moved into unit - Moved in 1990 to 1994 (%)
Year householder moved into unit - Moved in 1990 to 1994 (%) - White
Year householder moved into unit - Moved in 1990 to 1994 (%) - Black or African American
Year householder moved into unit - Moved in 1990 to 1994 (%) - Asian
Year householder moved into unit - Moved in 1990 to 1994 (%) - Hispanic or Latino
Year householder moved into unit - Moved in 1990 to 1994 (%) - American Indian and Alaska Native
Year householder moved into unit - Moved in 1990 to 1994 (%) - Multirace
Year householder moved into unit - Moved in 1990 to 1994 (%) - Other Race
Year householder moved into unit - Moved in 1980 to 1989 (%)
Year householder moved into unit - Moved in 1980 to 1989 (%) - White
Year householder moved into unit - Moved in 1980 to 1989 (%) - Black or African American
Year householder moved into unit - Moved in 1980 to 1989 (%) - Asian
Year householder moved into unit - Moved in 1980 to 1989 (%) - Hispanic or Latino
Year householder moved into unit - Moved in 1980 to 1989 (%) - American Indian and Alaska Native
Year householder moved into unit - Moved in 1980 to 1989 (%) - Multirace
Year householder moved into unit - Moved in 1980 to 1989 (%) - Other Race
Year householder moved into unit - Moved in 1970 to 1979 (%)
Year householder moved into unit - Moved in 1970 to 1979 (%) - White
Year householder moved into unit - Moved in 1970 to 1979 (%) - Black or African American
Year householder moved into unit - Moved in 1970 to 1979 (%) - Asian
Year householder moved into unit - Moved in 1970 to 1979 (%) - Hispanic or Latino
Year householder moved into unit - Moved in 1970 to 1979 (%) - American Indian and Alaska Native
Year householder moved into unit - Moved in 1970 to 1979 (%) - Multirace
Year householder moved into unit - Moved in 1970 to 1979 (%) - Other Race
Year householder moved into unit - Moved in 1969 or earlier (%)
Year householder moved into unit - Moved in 1969 or earlier (%) - White
Year householder moved into unit - Moved in 1969 or earlier (%) - Black or African American
Year householder moved into unit - Moved in 1969 or earlier (%) - Asian
Year householder moved into unit - Moved in 1969 or earlier (%) - Hispanic or Latino
Year householder moved into unit - Moved in 1969 or earlier (%) - American Indian and Alaska Native
Year householder moved into unit - Moved in 1969 or earlier (%) - Multirace
Year householder moved into unit - Moved in 1969 or earlier (%) - Other Race
Housing units lacking complete plumbing facilities (%)
Housing units lacking complete kitchen facilities (%)
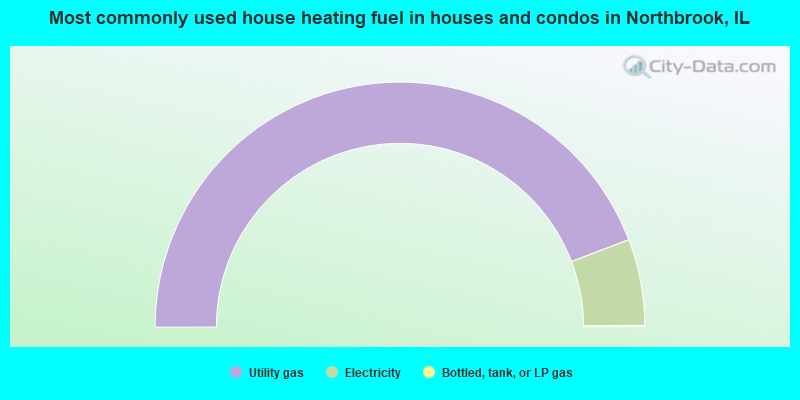
House heating fuel used in houses and condos - Utility gas (%)
House heating fuel used in houses and condos - Bottled, tank, or LP gas (%)
House heating fuel used in houses and condos - Electricity (%)
House heating fuel used in houses and condos - Fuel oil, kerosene, etc. (%)
House heating fuel used in houses and condos - Coal or coke (%)
House heating fuel used in houses and condos - Wood (%)
House heating fuel used in houses and condos - Solar energy (%)
House heating fuel used in houses and condos - Other fuel (%)
House heating fuel used in houses and condos - No fuel used (%)
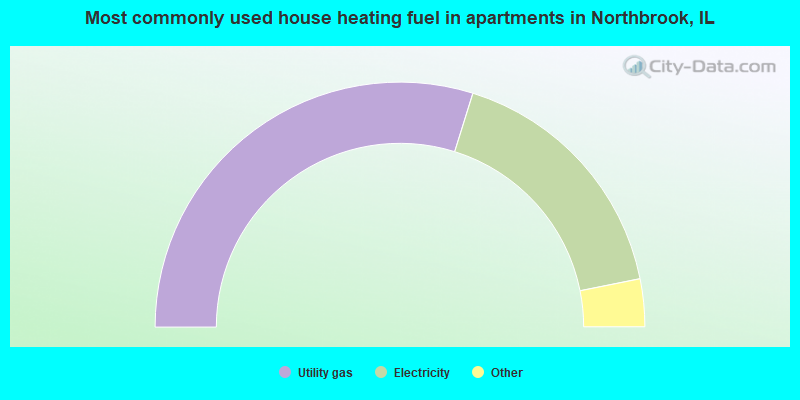
House heating fuel used in apartments - Utility gas (%)
House heating fuel used in apartments - Bottled, tank, or LP gas (%)
House heating fuel used in apartments - Electricity (%)
House heating fuel used in apartments - Fuel oil, kerosene, etc. (%)
House heating fuel used in apartments - Coal or coke (%)
House heating fuel used in apartments - Wood (%)
House heating fuel used in apartments - Solar energy (%)
House heating fuel used in apartments - Other fuel (%)
House heating fuel used in apartments - No fuel used (%)
Latest news about housing in Northbrook, IL collected exclusively by city-data.com from local newspapers, TV, and radio stations
Median year house/condo built: 1974Median year apartment built: 1991Household type by relationship:
Households: 34,173
Male householders: 6,957 (1,120 living alone ), Female householders: 6,223 (2,032 living alone )8,636 spouses (8,605 opposite-sex spouses ), 352 unmarried partners , (352 opposite-sex unmarried partners ), 9,894 children (9,585 natural , 245 adopted , 63 stepchildren ), 383 grandchildren , 94 brothers or sisters , 365 parents , 13 foster children , 112 other relatives , 464 non-relatives In group quarters: 674
Size of family households: 4,726 2-persons , 1,632 3-persons , 2,412 4-persons , 848 5-persons , 131 6-persons , 17 7-or-more-persons .
Size of nonfamily households: 3,387 1-person , 534 2-persons .
5,854 married couples with children. single-parent households (157 men , 466 women ).
75.8% of residents of Northbrook speak English at home. of residents speak Spanish at home (71% speak English very well , 21% speak English well , 6% speak English not well , 2% don't speak English at all ).of residents speak other Indo-European language at home (74% speak English very well , 18% speak English well , 6% speak English not well , 1% don't speak English at all ).of residents speak Asian or Pacific Island language at home (68% speak English very well , 22% speak English well , 9% speak English not well , 1% don't speak English at all ).of residents speak other language at home (66% speak English very well , 15% speak English well , 14% speak English not well , 5% don't speak English at all ).
Foreign born population: 6,937 (20.3%)of them are naturalized citizens )
Median number of rooms in houses and condos:
Median number of rooms in apartments
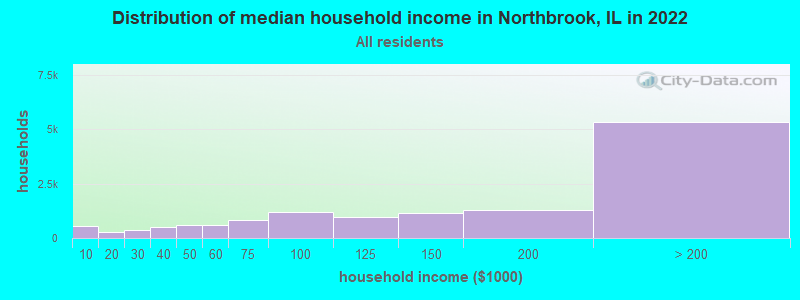
Northbrook, IL household income distribution 533 Less than $10,000261 $10,000 to $19,999351 $20,000 to $29,999489 $30,000 to $39,999584 $40,000 to $49,999577 $50,000 to $59,999805 $60,000 to $74,9991,214 $75,000 to $99,999960 $100,000 to $124,9991,160 $125,000 to $149,9991,302 $150,000 to $199,9995,324 $200,000 or more
Home value of owner - occupied houses in 2022 in Northbrook, IL 65 Less than $10,00025 $40,000 to $49,99917 $50,000 to $59,99914 $60,000 to $69,9997 $70,000 to $79,99915 $100,000 to $124,999115 $125,000 to $149,999148 $150,000 to $174,999123 $175,000 to $199,999230 $200,000 to $249,999558 $250,000 to $299,999981 $300,000 to $399,9991,674 $400,000 to $499,9994,357 $500,000 to $749,9992,296 $750,000 to $999,9991,046 $1,000,000 to $1,499,999145 $1,500,000 to $1,999,999311 $2,000,000 or moreRent paid by renters in 2022 in Northbrook, IL 18 $300 to $34915 $500 to $5495 $550 to $59918 $650 to $69913 $700 to $74915 $750 to $79915 $900 to $999156 $1,000 to $1,249175 $1,250 to $1,499376 $1,500 to $1,999301 $2,000 to $2,499226 $2,500 to $2,99983 $3,000 to $3,499156 $3,500 or more136 No cash rent
Percentage of workers working in this county: 83.6%Number of people working at home: 5,603 (33.8% of all workers )
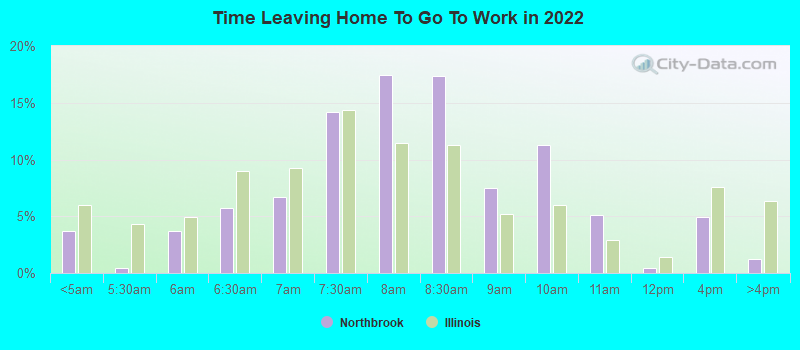
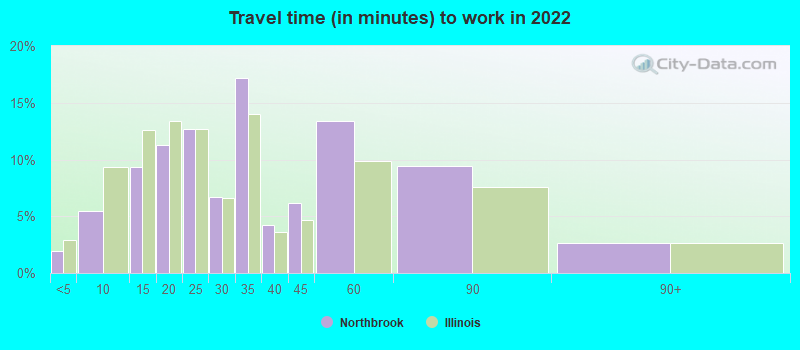
Travel time to work (commute)
Less than 5 minutes: 5305 to 9 minutes: 1,04710 to 14 minutes: 1,86215 to 19 minutes: 1,30820 to 24 minutes: 1,57125 to 29 minutes: 66730 to 34 minutes: 1,27235 to 39 minutes: 37540 to 44 minutes: 52145 to 59 minutes: 1,23960 to 89 minutes: 1,26990 or more minutes: 179
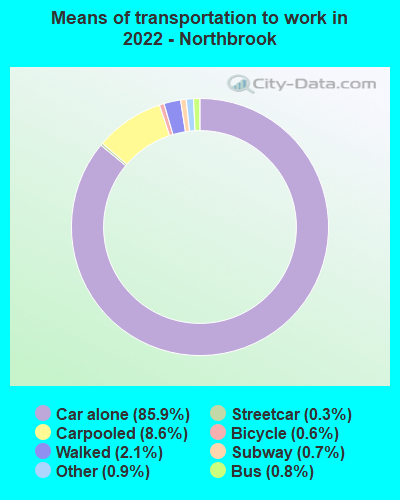
Means of transportation to work:
Drove a car alone: 24,268 (72.9%)Carpooled: 2,609 (7.8%)Bus : 207 (0.6%)Subway or elevated rail : 63 (0.2%)Long-distance train or commuter rail : 147 (0.4%)Taxi: 258 (0.8%)Bicycle: 184 (0.6%)Walked: 609 (1.8%)Worked at home: 5,603 (16.8%)
Unemployment by race in 2022
Unemployment rate for White non-Hispanic residents 1.5% Males3.1% FemalesUnemployment rate for Black residents 14.4% FemalesUnemployment rate for Asian residents 2.1% Males4.0% FemalesUnemployment rate for two or more race residents 1.2% MalesUnemployment rate for Hispanic or Latino residents 0.7% Males
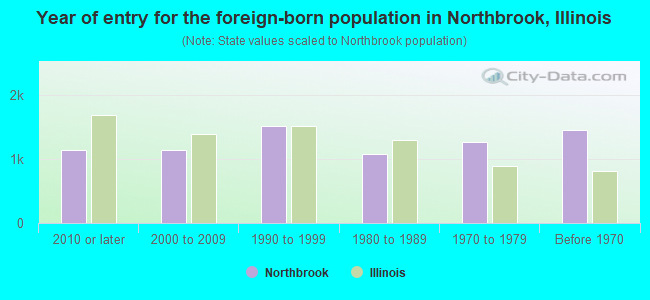
Year of entry for the foreign-born population in Northbrook, Illinois
1,141 2010 or later 1,151 2000 to 2009 1,524 1990 to 1999 1,083 1980 to 1989 1,263 1970 to 1979 1,459 Before 1970
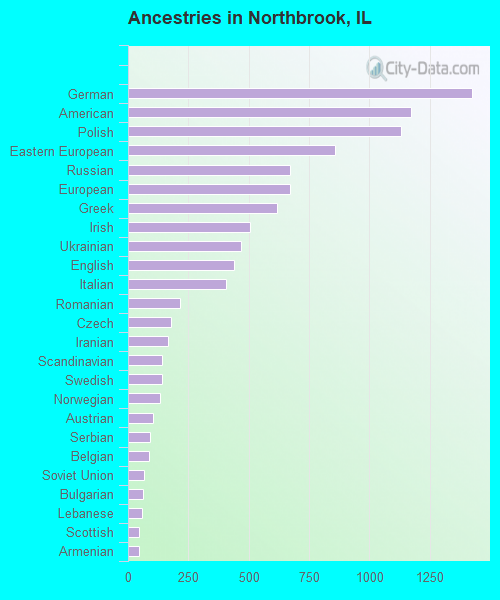
First ancestries reported:
German: 1,425 (8.3%)
American: 1,173 (6.9%)
Polish: 1,132 (6.6%)
Eastern European: 858 (5.0%)
Russian: 672 (3.9%)
European: 672 (3.9%)
Greek: 618 (3.6%)
Irish: 504 (3.0%)
Ukrainian: 468 (2.7%)
English: 441 (2.6%)
Italian: 407 (2.4%)
Romanian: 214 (1.3%)
Czech: 177 (1.0%)
Iranian: 164 (1.0%)
Scandinavian: 142 (0.8%)
Swedish: 141 (0.8%)
Norwegian: 133 (0.8%)
Austrian: 102 (0.6%)
Serbian: 93 (0.5%)
Belgian: 88 (0.5%)
Soviet Union: 68 (0.4%)
Bulgarian: 62 (0.4%)
Lebanese: 60 (0.4%)
Scottish: 47 (0.3%)
Armenian: 46 (0.3%)
French Canadian: 46 (0.3%)
Czechoslovakian: 46 (0.3%)
Croatian: 43 (0.3%)
African: 42 (0.2%)
Dutch: 39 (0.2%)
Egyptian: 38 (0.2%)
Guyanese: 33 (0.2%)
Lithuanian: 32 (0.2%)
Hungarian: 32 (0.2%)
British: 28 (0.2%)
Luxembourger: 25 (0.1%)
Portuguese: 22 (0.1%)
Jamaican: 20 (0.1%)
Danish: 16 (0.09%)
French: 15 (0.09%)
Welsh: 15 (0.09%)
Scotch-Irish: 14 (0.08%)
Israeli: 12 (0.07%)
Latvian: 10 (0.06%)
Finnish: 10 (0.06%)
Albanian: 8 (0.05%)
Haitian: 8 (0.05%)
New Zealander: 7 (0.04%)
Slovak: 5 (0.03%)
Kenyan: 5 (0.03%)
Turkish: 3 (0.02%)
Most common places of birth for foreign-born residents (%): Korea Northbrook:
15.2% (1,052)Illinois:
2.2% (40,393)
India Northbrook:
14.4% (996)Illinois:
9.2% (166,409)
Ukraine Northbrook:
11.5% (800)Illinois:
1.6% (29,316)
China, excluding Hong Kong and Taiwan Northbrook:
7.7% (531)Illinois:
4.1% (74,364)
Poland Northbrook:
5.1% (357)Illinois:
6.9% (124,474)
Greece Northbrook:
3.8% (261)Illinois:
0.6% (10,720)
Taiwan Northbrook:
3.0% (209)Illinois:
0.5% (8,235)
Russia Northbrook:
2.8% (193)Illinois:
0.9% (16,308)
Canada Northbrook:
2.3% (159)Illinois:
1.1% (19,306)
Philippines Northbrook:
2.2% (155)Illinois:
5.2% (93,003)
Mexico Northbrook:
2.2% (154)Illinois:
34.7% (626,958)
Germany Northbrook:
2.2% (153)Illinois:
1.0% (18,753)
Hong Kong Northbrook:
2.2% (153)Illinois:
0.3% (5,016)
Iran Northbrook:
1.8% (125)Illinois:
0.4% (6,922)
Place of birth for U.S.-born residents:
This state: 20,539Other state: 6,396Northeast: 1,381Midwest: 3,471South: 944West: 700 91.0% of Northbrook residents lived in the same house 1 years ago.
Out of people who lived in different houses, 42.2% lived in this county.
Out of people who lived in different counties, 43.6% lived in Illinois.
Northbrook:
91.0%State average:
88.3%
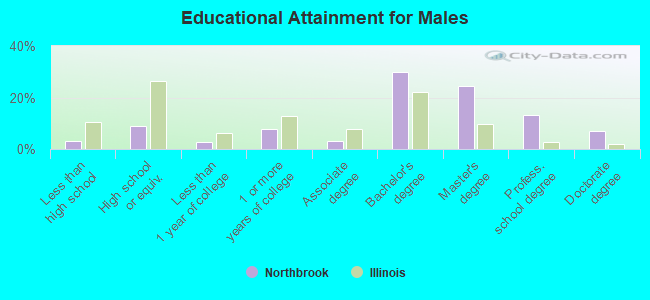
Education attainment for males 25 years and older:
No schooling: 101Nursery to 4th grade: 375th and 6th grade: 47th and 8th grade: 1179th grade: 2510th grade: 511th grade: 1712th grade, no diploma: 56High school graduate (or equivalency): 1,104Less than 1 year of college: 311Some college more than 1 year, no degree: 941Associate degree: 363Bachelor's degree: 3,621Master's degree: 2,994Professional school degree: 1,599Doctorate degree: 856
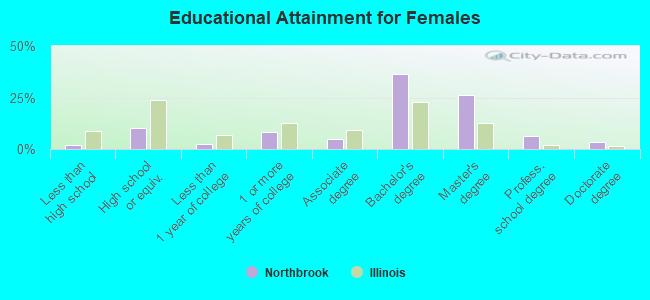
Education attainment for females 25 years and older:
No schooling: 28Nursery to 4th grade: 55th and 6th grade: 587th and 8th grade: 329th grade: 5410th grade: 1011th grade: 1112th grade, no diploma: 92High school graduate (or equivalency): 1,355Less than 1 year of college: 333Some college more than 1 year, no degree: 1,076Associate degree: 634Bachelor's degree: 4,835Master's degree: 3,501Professional school degree: 862Doctorate degree: 483
Housing units in structures:
One, detached: 9,883One, attached: 1,719Two: 1633 or 4: 2715 to 9: 9110 to 19: 47220 to 49: 99650 or more: 1,273Mobile homes: 58Housing units lacking complete plumbing facilities in 2022: 1.2%Housing units lacking complete kitchen facilities in 2022: 1.0%House/condo owner moved in on average 12 years ago
Renter moved in on average 1 years ago
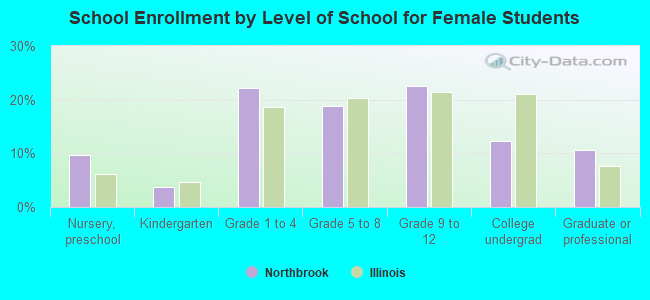
Private vs. public school enrollment:
Students in private schools in grades 1 to 8 (elementary and middle school): 157 Students in private schools in grades 9 to 12 (high school): 187 Students in private undergraduate colleges: 473