All U.S. Cities  
City-Data Forum City-Data

Northwest Yellowstone, MT (Montana) Houses and Residents


Back to: Northwest Yellowstone, Montana main profile, Montana, Montana smaller cities, Montana small towns, Montana forum, All US cities.


(Urban population: 815 (799 inside urbanized areas, 16 inside urban clusters), Rural population: 3,515 (216 farm, 3,299 nonfarm))

Houses: 1,623 (1,532 occupied: 1,408 owner occupied, 124 renter occupied)
% of renters here:  8%
State:  31%

Housing density: 3 houses/condos per square mile


Median price asked for vacant for-sale houses and condos in 2007 in this state: $228,803.


Median contract rent in 2007: $485 (lower quartile is $415, upper quartile is $702)


Median rent asked for vacant for-rent units in 2007: $507


Median gross rent in Northwest Yellowstone, MT in 2007: $647


Housing units in Northwest Yellowstone with a mortgage: 714 (84 second mortgage, 79 home equity loan, 0 both second mortgage and home equity loan)
Houses without a mortgage: 163


Estimated median house or condo value in 2007: $233,839 (it was $125,900 in 2000)
Northwest Yellowstone:  $233,839
Montana:  $170,000
Lower value quartile - upper value quartile: $147,784 - $346,426

Mean price in 2007:
Detached houses: $321,135
Here:  $321,135
State:  $251,645

Townhouses or other attached units: $290,804
Here:  $290,804
State:  $207,161

In 2-unit structures: $157,457
Here:  $157,457
State:  $147,637

Mobile homes: $56,132
Here:  $56,132
State:  $51,663

Occupied boats, RVs, vans, etc.: $34,583
Here:  $34,583
State:  $45,944

Household type by relationship

Households: 4,330
  • In family households: 3,973 (1,116 male householders, 142 female householders)
    1,105 spouses, 1,410 children (1,257 natural, 58 adopted, 95 stepchildren), 36 grandchildren, 15 brothers or sisters, 20 parents, 38 other relatives, 91 non-relatives
  • In nonfamily households: 357 (182 male householders (136 living alone)), 101 female householders (81 living alone)), 74 nonrelatives

Size of family households: 519 2-persons, 272 3-persons, 285 4-persons, 126 5-persons, 39 6-persons, 17 7-or-more-persons.

Size of nonfamily households: 217 1-person, 59 2-persons, 4 3-persons, 3 4-persons.

1,054 married couples with children.
178 single-parent households (75 men, 103 women).

96.2% of residents of Northwest Yellowstone speak English at home.
1.8% of residents speak Spanish at home (87% speak English very well, 13% speak English well).
1.3% of residents speak other Indo-European language at home (96% speak English very well, 4% speak English not well).
0.5% of residents speak Asian or Pacific Island language at home (70% speak English very well, 30% speak English well).
0.2% of residents speak other language at home (50% speak English very well, 50% speak English well).
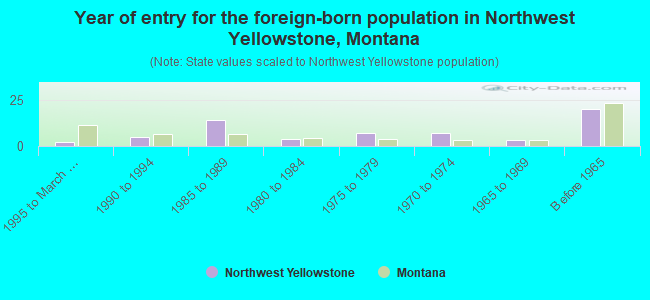
Foreign born population: 62 (1.4%)
(66.1% of them are naturalized citizens)

Median number of rooms in houses and condos:
Here:  6.9
State:  6.1

Median number of rooms in apartments:
Here:  5.2
State:  4.1


Rooms in owner-occupied houses in Northwest Yellowstone, Montana:
  • 1 room: 8
  • 2 rooms: 13
  • 3 rooms: 49
  • 4 rooms: 103
  • 5 rooms: 201
  • 6 rooms: 255
  • 7 rooms: 199
  • 8 rooms: 202
  • 9 or more rooms: 378


Rooms in renter-occupied apartments in Northwest Yellowstone, Montana:
  • 1 room: 0
  • 2 rooms: 4
  • 3 rooms: 9
  • 4 rooms: 24
  • 5 rooms: 35
  • 6 rooms: 24
  • 7 rooms: 12
  • 8 rooms: 9
  • 9 or more rooms: 7


Year house built:

  • 1999 to March 2000: 180
  • 1995 to 1998: 245
  • 1990 to 1994: 146
  • 1980 to 1989: 324
  • 1970 to 1979: 452
  • 1960 to 1969: 104
  • 1950 to 1959: 64
  • 1940 to 1949: 33
  • 1939 or earlier: 75


Bedrooms in owner-occupied houses and condos in Northwest Yellowstone:
  • no bedroom: 14
  • 1 bedroom: 49
  • 2 bedrooms: 194
  • 3 bedrooms: 641
  • 4 bedrooms: 364
  • 5 or more bedrooms: 146


Bedrooms in renter-occupied apartments in Northwest Yellowstone:
  • no bedroom: 0
  • 1 bedroom: 16
  • 2 bedrooms: 26
  • 3 bedrooms: 60
  • 4 bedrooms: 20
  • 5 or more bedrooms: 2


Owners and renters by unit type in %


Breakdown of mean house values by ages of householders


Cars and other vehicles available in Northwest Yellowstone in owner-occupied houses/condos:
  • no vehicle: 35
  • 1 vehicle: 223
  • 2 vehicles: 515
  • 3 vehicles: 440
  • 4 vehicles: 132
  • 5 or more vehicles: 63


Cars and other vehicles available in Northwest Yellowstone in n renter-occupied apartments
  • no vehicle: 6
  • 1 vehicle: 35
  • 2 vehicles: 52
  • 3 vehicles: 19
  • 4 vehicles: 4
  • 5 or more vehicles: 8


Northwest Yellowstone, MT house values


Estimate of home value of owner-occupied houses in 2007 in Northwest Yellowstone, MT:

  • Less than $10,000: 9
  • $10,000 to $14,999: 5
  • $15,000 to $19,999: 9
  • $20,000 to $24,999: 14
  • $25,000 to $29,999: 15
  • $30,000 to $34,999: 16
  • $35,000 to $39,999: 16
  • $40,000 to $49,999: 30
  • $50,000 to $59,999: 23
  • $60,000 to $69,999: 19
  • $70,000 to $79,999: 18
  • $80,000 to $89,999: 16
  • $90,000 to $99,999: 10
  • $100,000 to $124,999: 65
  • $125,000 to $149,999: 63
  • $150,000 to $174,999: 126
  • $175,000 to $199,999: 132
  • $200,000 to $249,999: 260
  • $250,000 to $299,999: 181
  • $300,000 to $399,999: 144
  • $400,000 to $499,999: 88
  • $500,000 to $749,999: 87
  • $750,000 to $999,999: 30
  • $1,000,000 or more: 34


Northwest Yellowstone rent paid by renters for apartments graph

Rent paid by renters in 2007 in Northwest Yellowstone:

  • Less than $100: 0 people
  • $100 to $149: 0
  • $150 to $199: 1
  • $200 to $249: 3
  • $250 to $299: 6
  • $300 to $349: 3
  • $350 to $399: 4
  • $400 to $449: 8
  • $450 to $499: 17
  • $500 to $549: 8
  • $550 to $599: 4
  • $600 to $649: 2
  • $650 to $699: 2
  • $700 to $749: 0
  • $750 to $799: 0
  • $800 to $899: 6
  • $900 to $999: 5
  • $1,000 to $1,249: 7
  • $1,250 to $1,499: 0
  • $1,500 to $1,999: 0
  • $2,000 or more: 0
  • No cash rent: 24


Year of entry for the foreign-born population
  • 1995 to March 2000: 2
  • 1990 to 1994: 5
  • 1985 to 1989: 14
  • 1980 to 1984: 4
  • 1975 to 1979: 7
  • 1970 to 1974: 7
  • 1970 to 1974: 3
  • 1965 to 1969: 20

Percentage of workers working in this county: 95.0%
Number of people working at home: 90 (4.0% of all workers)


Travel time to work

  • Less than 5 minutes: 50
  • 5 to 9 minutes: 126
  • 10 to 14 minutes: 325
  • 15 to 19 minutes: 402
  • 20 to 24 minutes: 558
  • 25 to 29 minutes: 126
  • 30 to 34 minutes: 287
  • 35 to 39 minutes: 38
  • 40 to 44 minutes: 48
  • 45 to 59 minutes: 83
  • 60 to 89 minutes: 54
  • 90 or more minutes: 45


Means of transportation to work

  • Drove a car alone: 1,845 (83%)
  • Carpooled: 229 (10%)
  • Bus or trolley bus: 4 (0%)
  • Bicycle: 2 (0%)
  • Walked: 38 (2%)
  • Other means: 24 (1%)
  • Worked at home: 90 (4%)

Northwest Yellowstone, MT household income

Household income:

  • Less than $10,000: 63
  • $10,000 to $14,999: 66
  • $15,000 to $19,999: 79
  • $20,000 to $24,999: 95
  • $25,000 to $29,999: 77
  • $30,000 to $34,999: 107
  • $35,000 to $39,999: 106
  • $40,000 to $44,999: 95
  • $45,000 to $49,999: 88
  • $50,000 to $59,999: 163
  • $60,000 to $74,999: 193
  • $75,000 to $99,999: 202
  • $100,000 to $124,999: 67
  • $125,000 to $149,999: 34
  • $150,000 to $199,999: 50
  • $200,000 or more: 56


First ancestries reported:

 German: 1113
 Irish: 458
 Norwegian: 330
 English: 297
 Other groups: 285
 United States or American: 183
 French (except Basque): 120
 Italian: 106
 Scottish: 88
 Polish: 83
 Swedish: 81
 Scotch-Irish: 81
 Dutch: 53
 Danish: 49
 French Canadian: 30
 Russian: 29
 European: 24
 Scandinavian: 19
 Swiss: 16
 Czech: 16
 Welsh: 12
 Finnish: 11
 Hungarian: 9
 Carpatho Rusyn: 6
 Northern European: 5
 Belgian: 5
 Bulgarian: 5
 Slavic: 5
 Ukrainian: 5
 Yugoslavian: 5
 Slovene: 5
 Canadian: 4
 Romanian: 4
 Macedonian: 4
 Czechoslovakian: 4
 Slovak: 4
 Greek: 3
 Austrian: 2
 Subsaharan African:: 1
 South African: 1
 Lithuanian: 1


Most common places of birth for the foreign-born residents (%):


  • Korea (24%)
  • Canada (23%)
  • Other Northern Europe (8%)
  • Yugoslavia (8%)
  • Vietnam (6%)
  • Honduras (5%)
  • United Kingdom (3%)


Place of birth for U.S.-born residents:

  • This state: 2366
  • Northeast: 172
  • Midwest: 775
  • South: 271
  • West: 653

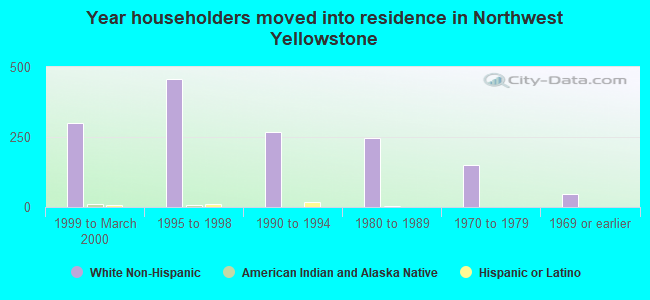
49% of Northwest Yellowstone residents lived in the same house 5 years ago.
   Out of people who lived in different houses, 59% lived in this county.
   Out of people who lived in different counties, 35% lived in Montana.

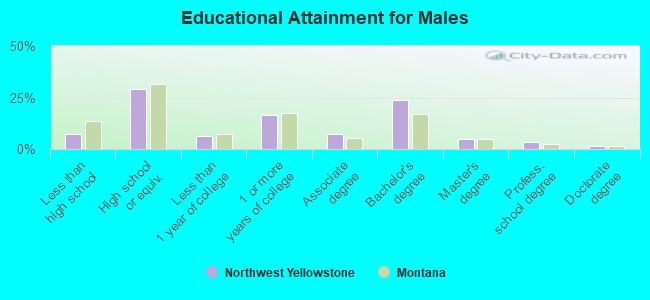
Education attainment for males 25 years and older:

  • No schooling: 0
  • Nursery to 4th grade: 0
  • 5th and 6th grade: 0
  • 7th and 8th grade: 30
  • 9th grade: 14
  • 10th grade: 11
  • 11th grade: 16
  • 12th grade, no diploma: 32
  • High school graduate (or equivalency): 416
  • Less than 1 year of college: 93
  • Some college more than 1 year, no degree: 235
  • Associate degree: 107
  • Bachelor's degree: 339
  • Master's degree: 70
  • Professional school degree: 50
  • Doctorate degree: 19


Educational Attainment for Males


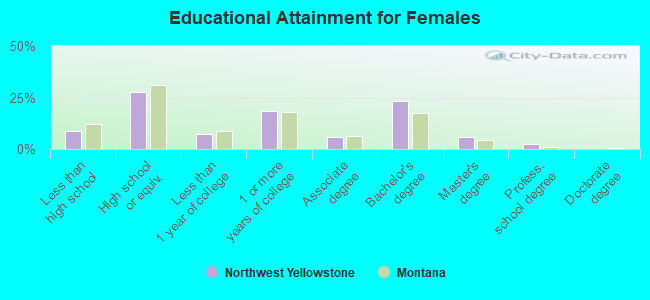
Education attainment for females 25 years and older:

  • No schooling: 0
  • Nursery to 4th grade: 2
  • 5th and 6th grade: 2
  • 7th and 8th grade: 19
  • 9th grade: 13
  • 10th grade: 19
  • 11th grade: 19
  • 12th grade, no diploma: 47
  • High school graduate (or equivalency): 377
  • Less than 1 year of college: 102
  • Some college more than 1 year, no degree: 249
  • Associate degree: 81
  • Bachelor's degree: 318
  • Master's degree: 76
  • Professional school degree: 34
  • Doctorate degree: 0


Educational Attainment for Females


Class of Workers


Unemployment rate for White non-Hispanic males: 4.6%
Unemployment rate for White non-Hispanic females: 3.0%


Unemployment rate for American Indian and Alaska Native males: 0.0%
Unemployment rate for American Indian and Alaska Native females: 0.0%


Unemployment rate for other race males: 0.0%
Unemployment rate for other race females: 0.0%


Unemployment rate for two or more race males: 25.0%
Unemployment rate for two or more race females: 0.0%


Unemployment rate for Hispanic or Latino males: 0.0%
Unemployment rate for Hispanic or Latino females: 8.3%


Median household income in 2007 for:

  • White non-Hispanic householders: $65,936
  • Black householders: $18,778
  • American Indian and Alaska Native householders: $76,032
  • Asian householders: $57,779
  • Some other race householders: $52,095
  • Two or more races householders: $67,060
  • Hispanic or Latino race householders: $45,371

Northwest Yellowstone household income for White non-Hispanic householders

Northwest Yellowstone household income for American Indian and Alaska Native householders

Northwest Yellowstone household income for Hispanic or Latino race householders

Northwest Yellowstone marital status for males

Northwest Yellowstone marital status for females


Median 2007 house value for:

  • White Non-Hispanic householders: $229,624
  • Asian householders: $243,997
  • Two or more races householders: $221,816
  • Hispanic or Latino householders: $255,177

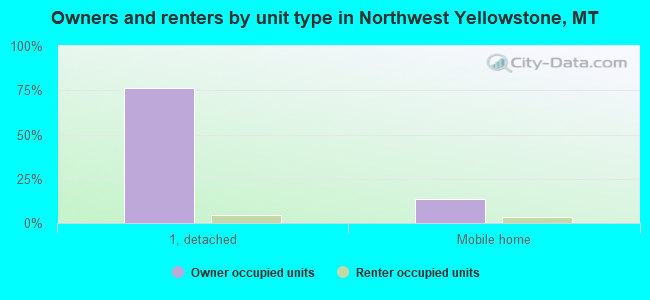
Housing units in structures:

  • One, detached: 1,296
  • One, attached: 12
  • Two: 7
  • Mobile homes: 294
  • Boats, RVs, vans, etc.: 14

Median worth of mobile homes: $48,615


Housing units lacking complete plumbing facilities: 3%

Housing units lacking complete kitchen facilities: 3%


Year Householders Moved Into Unit in Northwest Yellowstone:


Most commonly used house heating fuel in houses and condos:
  • Utility gas (42%)
  • Bottled, tank, or LP gas (28%)
  • Electricity (21%)
  • Wood (6%)
  • Other fuel (1%)
  • Coal or coke (1%)
  • Fuel oil, kerosene, etc. (1%)


Most commonly used house heating fuel in apartments:
  • Bottled, tank, or LP gas (43%)
  • Utility gas (27%)
  • Electricity (22%)
  • Other fuel (6%)
  • Fuel oil, kerosene, etc. (3%)

Private vs. public school enrollment:
Students in private schools in grades 1 to 8 (elementary and middle school): 37
Here:  5.7%
Montana:  7.4%

Students in private schools in grades 9 to 12 (high school): 32
Here:  11.0%
Montana:  6.1%

Students in private undergraduate colleges: 13
Here:  12.1%
Montana:  11.5%


School Enrollment by Level of School for Male Students


School Enrollment by Level of School for Female Students

Age and Sex of Sensory-Disabled Residents (Noninstitutionalized)

Age and Sex of Physically-Disabled Residents (Noninstitutionalized)


Age and Sex of Mentally-Disabled Residents (Noninstitutionalized)

Age and Sex of Self-Care Disabled Residents (Noninstitutionalized)


Age and Sex of Go-Outside-Home Disabled Residents (Noninstitutionalized)

Age and Sex of Residents with Employment Disability (Noninst.)


Back to the top


Discuss this and other local issues on our hugely popular Montana forum.

Back to: Northwest Yellowstone, MT (don't miss, contains a wealth of additional information), Montana, All US cities.


City-data.com does not guarantee the accuracy or timeliness of any information on this site.  Use at your own risk.
Some parts © 2003-2008 Advameg, Inc.