Ocala, FL (Florida) Houses and Residents
| Ocala: | $285,100 |
| Florida: | $354,100 |
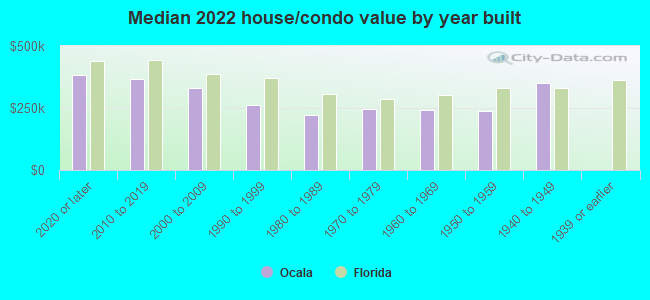
Mean price in 2022:
Detached houses: $337,570
Here: $337,570 State: $500,941 Townhouses or other attached units: $212,234
Here: $212,234 State: $370,869 In 2-unit structures: $362,337
Here: $362,337 State: $423,188 In 3-to-4-unit structures: $149,821
Here: $149,821 State: $309,944 In 5-or-more-unit structures: $549,015
Here: $549,015 State: $447,145 Mobile homes: $32,397
Here: $32,397 State: $113,202
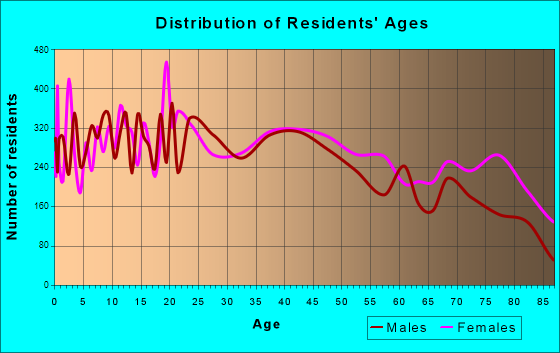
Total population: 57,586 (Urban population: 45,460, Rural population: 162 (all nonfarm))
Houses: 29,402 (24,206 occupied: 11,303 owner occupied, 12,903 renter occupied)
| % of renters here: | 53% |
| State: | 33% |
Housing density: 761 houses/condos per square mile
Median price asked for vacant for-sale houses and condos in 2022: $254,183.
Median contract rent in 2022: $937 (lower quartile is $657, upper quartile is $1,571)
Median rent asked for vacant for-rent units in 2022: $2,652
Median gross rent in Ocala, FL in 2022: $1,171
Housing units in Ocala with a mortgage: 7,458 (461 second mortgage, 5 home equity loan, 375 both second mortgage and home equity loan)
Houses without a mortgage: 38
Median household income for houses/condos with a mortgage: $91,554
Median household income for apartments without a mortgage: $43,208
Median monthly housing costs: $1,160
Compare current foreclosures in Ocala, FL:
| Photo | Address | Area | Beds / Baths | Price | Details |
|---|---|---|---|---|---|

|
#1
Pine Crse
Ocala, FL 34472
|
1,456 sq. feet
|
2 baths 3 beds |
$154,900
|
show details |

|
#2
SW 105th Pl
Ocala, FL 34481
|
884 sq. feet
|
2 baths 2 beds |
show details | |

|
#3
SW 108th St
Ocala, FL 34476
|
1,524 sq. feet
|
2 baths 3 beds |
show details | |

|
#4
SW 93rd Loop
Ocala, FL 34481
|
1,573 sq. feet
|
2 baths 2 beds |
show details | |

|
#5
SE 31st Ter
Ocala, FL 34471
|
2,337 sq. feet
|
2 baths 3 beds |
show details | |

|
#6
SE 56th Ter
Ocala, FL 34480
|
2,375 sq. feet
|
2 baths 4 beds |
show details | |

|
#7
Spring Ter
Ocala, FL 34472
|
1,689 sq. feet
|
3 baths 4 beds |
show details | |

|
#8
Juniper Loop Ct
Ocala, FL 34480
|
1,327 sq. feet
|
2 baths 3 beds |
show details | |

|
#9
Bahia Track Trl
Ocala, FL 34472
|
1,826 sq. feet
|
2 baths 3 beds |
show details | |

|
#10
NE 13th Ave
Ocala, FL 34470
|
1,491 sq. feet
|
1 baths 4 beds |
show details |
| Photo | Address | Area | Beds / Baths | Price | Details |
|---|---|---|---|---|---|

|
#11
NE 42nd Pl
Ocala, FL 34479
|
1,396 sq. feet
|
2 baths 3 beds |
show details | |

|
#12
NE 42nd St
Ocala, FL 34479
|
1,769 sq. feet
|
2 baths 3 beds |
show details | |

|
#13
NE 22nd Ave
Ocala, FL 34470
|
1,596 sq. feet
|
2 baths 3 beds |
show details | |

|
#14
NE 49th St
Ocala, FL 34479
|
3,017 sq. feet
|
2 baths 3 beds |
show details | |

|
#15
NW 18th Ct
Ocala, FL 34475
|
1,351 sq. feet
|
2 baths 3 beds |
show details | |

|
#16
NE 22nd St
Ocala, FL 34470
|
1,124 sq. feet
|
1 baths 2 beds |
show details | |

|
#17
SW 16th St
Ocala, FL 34474
|
1,948 sq. feet
|
2 baths 3 beds |
show details | |

|
#18
NW 44th Ct
Ocala, FL 34482
|
1,224 sq. feet
|
2 baths 3 beds |
show details | |

|
#19
NE 40th Cir
Ocala, FL 34470
|
2,256 sq. feet
|
3 baths 3 beds |
show details | |

|
#20
SW 48th Ct
Ocala, FL 34473
|
1,368 sq. feet
|
2 baths 3 beds |
show details |
| Photo | Address | Area | Beds / Baths | Price | Details |
|---|---|---|---|---|---|

|
#21
SW 105th Pl
Ocala, FL 34481
|
1,404 sq. feet
|
2 baths 3 beds |
show details | |

|
#22
NE 12th Ave
Ocala, FL 34470
|
1,439 sq. feet
|
2 baths 3 beds |
show details | |

|
#23
Locust Loop
Ocala, FL 34472
|
1,346 sq. feet
|
2 baths 3 beds |
show details | |

|
#24
Marion Oaks Dr
Ocala, FL 34473
|
1,480 sq. feet
|
2 baths 2 beds |
show details | |

|
#25
SE 2nd St
Ocala, FL 34471
|
2,657 sq. feet
|
2 baths 3 beds |
show details | |

|
#26
SE 85th Ln
Ocala, FL 34472
|
1,874 sq. feet
|
2 baths 4 beds |
show details | |

|
#27
NE 13th St
Ocala, FL 34470
|
1,872 sq. feet
|
1 baths 3 beds |
show details | |

|
#28
SW 166th Loop
Ocala, FL 34473
|
1,299 sq. feet
|
2 baths 3 beds |
show details | |

|
#29
SW 53rd Ter
Ocala, FL 34476
|
3,567 sq. feet
|
4 baths 5 beds |
show details | |

|
#30
NE 28th Ct
Ocala, FL 34479
|
1,428 sq. feet
|
2 baths 3 beds |
show details |
| Photo | Address | Area | Beds / Baths | Price | Details |
|---|---|---|---|---|---|

|
#31
SW 32nd Ct
Ocala, FL 34476
|
1,712 sq. feet
|
2 baths 2 beds |
show details | |

|
#32
SW 5th Pl
Ocala, FL 34471
|
840 sq. feet
|
1 baths 2 beds |
show details | |

|
#33
SW 40th Pl
Ocala, FL 34474
|
1,596 sq. feet
|
2 baths 2 beds |
show details | |

|
#34
Teak Loop
Ocala, FL 34472
|
1,435 sq. feet
|
2 baths 3 beds |
show details | |

|
#35
NE 22nd Ave
Ocala, FL 34479
|
1,464 sq. feet
|
1 baths 3 beds |
show details | |

|
#36
SW 83rd Ave
Ocala, FL 34481
|
1,572 sq. feet
|
2 baths 2 beds |
show details | |

|
#37
Pecan Pass
Ocala, FL 34472
|
1,638 sq. feet
|
2 baths 3 beds |
show details | |

|
#38
Teak Loop
Ocala, FL 34472
|
1,213 sq. feet
|
2 baths 3 beds |
show details | |

|
#39
NW 49th Street Rd
Ocala, FL 34482
|
3,116 sq. feet
|
2 baths 3 beds |
show details | |

|
#40
NE 11th St
Ocala, FL 34470
|
890 sq. feet
|
1 baths 2 beds |
show details |
| Photo | Address | Area | Beds / Baths | Price | Details |
|---|---|---|---|---|---|

|
#41
SE 80th St
Ocala, FL 34480
|
2,056 sq. feet
|
2 baths 3 beds |
show details | |

|
#42
Emerald Trak
Ocala, FL 34472
|
1,603 sq. feet
|
2 baths 3 beds |
show details | |

|
#43
NW 44th Pl
Ocala, FL 34475
|
1,014 sq. feet
|
2 baths 3 beds |
show details | |

|
#44
SW 150th Lane Rd
Ocala, FL 34473
|
738 sq. feet
|
2 baths 3 beds |
show details | |

|
#45
SW 38th Cir
Ocala, FL 34473
|
1,658 sq. feet
|
2 baths 3 beds |
show details | |

|
#46
NE 9th St
Ocala, FL 34470
|
1,123 sq. feet
|
1 baths 3 beds |
show details | |

|
#47
SE 29th Ter
Ocala, FL 34471
|
1,532 sq. feet
|
2 baths 3 beds |
show details | |

|
#48
Pine Drive Trce
Ocala, FL 34472
|
1,916 sq. feet
|
2 baths 3 beds |
show details | |

|
#49
SW 17th Cir
Ocala, FL 34473
|
2,280 sq. feet
|
3 baths 4 beds |
show details | |

|
Check over 1 million property listings on Foreclosure.com!
|
browse all offers | |||

Latest news about housing in Ocala, FL collected exclusively by city-data.com from local newspapers, TV, and radio stations


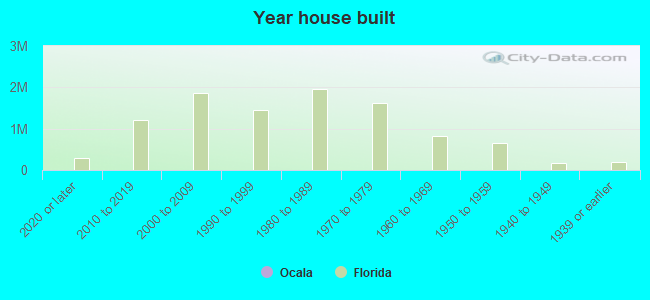
Median year apartment built: 1986
Household type by relationship:
Households: 65,498- Male householders: 10,426 (2,086 living alone), Female householders: 13,780 (4,968 living alone)
9,467 spouses (9,467 opposite-sex spouses), 1,653 unmarried partners, (1,578 opposite-sex unmarried partners), 20,072 children (18,272 natural, 745 adopted, 1,055 stepchildren), 2,703 grandchildren, 430 brothers or sisters, 1,346 parents, 0 foster children, 711 other relatives, 1,592 non-relatives
- In group quarters: 3,318
Size of family households: 5,441 2-persons, 4,715 3-persons, 2,435 4-persons, 728 5-persons, 1,658 6-persons, 364 7-or-more-persons.
Size of nonfamily households: 7,054 1-person, 1,811 2-persons.
6,905 married couples with children.
7,951 single-parent households (1,449 men, 6,502 women).
83.2% of residents of Ocala speak English at home.
12.7% of residents speak Spanish at home (57% speak English very well, 21% speak English well, 16% speak English not well, 6% don't speak English at all).
2.3% of residents speak other Indo-European language at home (83% speak English very well, 14% speak English well, 3% speak English not well).
1.3% of residents speak Asian or Pacific Island language at home (64% speak English very well, 17% speak English well, 11% speak English not well, 8% don't speak English at all).
0.3% of residents speak other language at home (100% speak English very well).
Foreign born population: 4,656 (7.1%)
(55.2% of them are naturalized citizens)
| Here: | 6.2 |
| State: | 5.9 |
| Here: | 4.6 |
| State: | 4.2 |
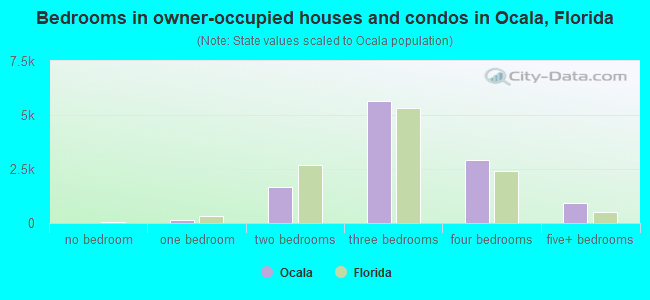
- Bedrooms in owner-occupied houses and condos in Ocala, Florida
- 0no bedroom
- 1231 bedroom
- 1,6592 bedrooms
- 5,6703 bedrooms
- 2,9284 bedrooms
- 9235+ bedrooms
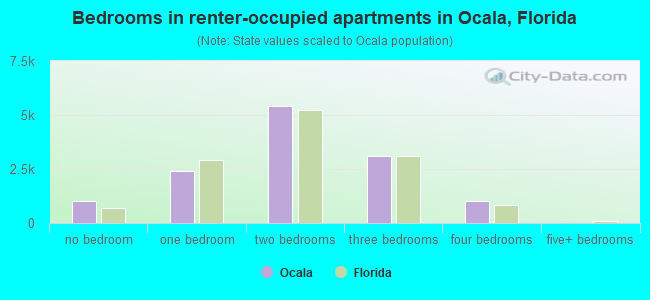
- Bedrooms in renter-occupied apartments in Ocala, Florida
- 1,009no bedroom
- 2,3971 bedroom
- 5,4172 bedrooms
- 3,0803 bedrooms
- 1,0004 bedrooms
- 05+ bedrooms
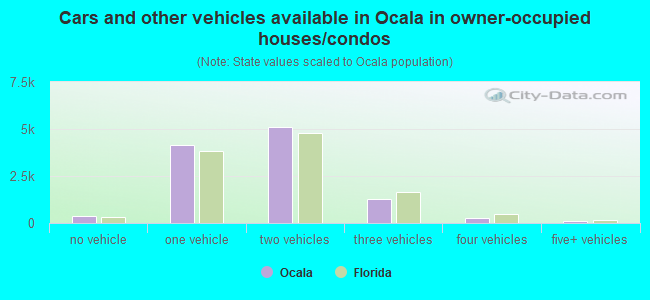
- Cars and other vehicles available in Ocala in owner-occupied houses/condos
- 383no vehicle
- 4,1231 vehicle
- 5,1302 vehicles
- 1,2883 vehicles
- 2834 vehicles
- 965+ vehicles
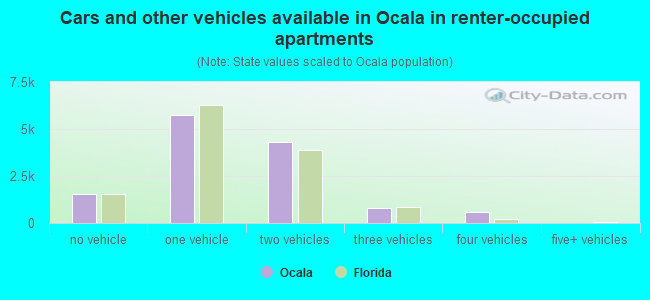
- Cars and other vehicles available in Ocala in renter-occupied apartments
- 1,519no vehicle
- 5,7361 vehicle
- 4,2832 vehicles
- 7793 vehicles
- 5864 vehicles
- 05+ vehicles
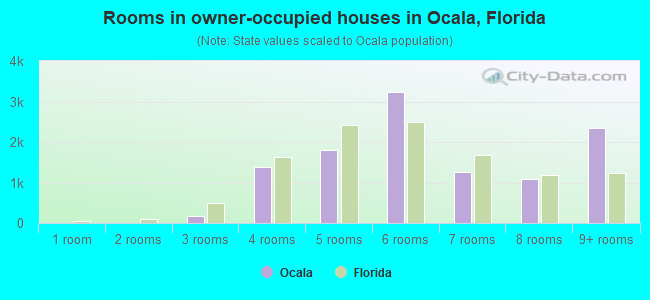
- Rooms in owner-occupied houses in Ocala, Florida
- 01 room
- 02 rooms
- 1823 rooms
- 1,3904 rooms
- 1,8115 rooms
- 3,2436 rooms
- 1,2587 rooms
- 1,0848 rooms
- 2,3359+ rooms
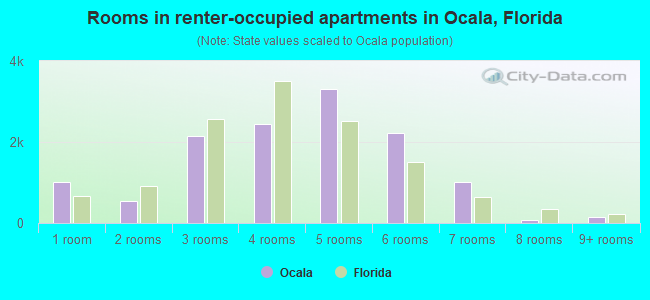
- Rooms in renter-occupied apartments in Ocala, Florida
- 1,0091 room
- 5342 rooms
- 2,1373 rooms
- 2,4524 rooms
- 3,3145 rooms
- 2,2266 rooms
- 1,0047 rooms
- 708 rooms
- 1579+ rooms
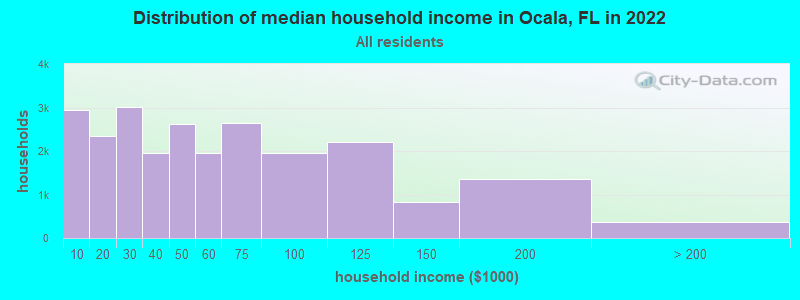
Ocala, FL household income distribution

- 2,947Less than $10,000
- 2,349$10,000 to $19,999
- 3,017$20,000 to $29,999
- 1,959$30,000 to $39,999
- 2,631$40,000 to $49,999
- 1,957$50,000 to $59,999
- 2,637$60,000 to $74,999
- 1,947$75,000 to $99,999
- 2,209$100,000 to $124,999
- 832$125,000 to $149,999
- 1,357$150,000 to $199,999
- 364$200,000 or more
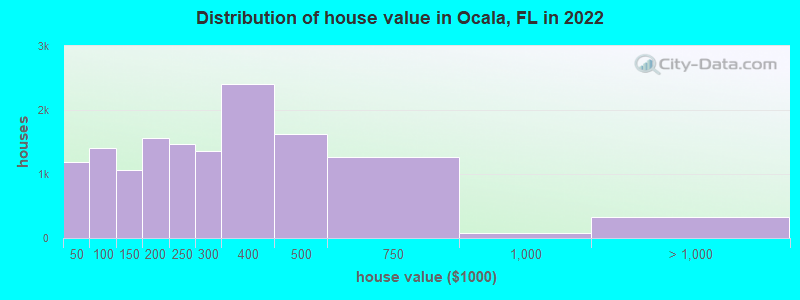
Home value of owner - occupied houses in 2022 in Ocala, FL
-
- 305Less than $10,000
- 36$10,000 to $14,999
- 33$15,000 to $19,999
- 225$20,000 to $24,999
- 84$25,000 to $29,999
- 225$30,000 to $34,999
- 68$35,000 to $39,999
- 207$40,000 to $49,999
- 217$50,000 to $59,999
- 186$60,000 to $69,999
- 171$70,000 to $79,999
- 248$80,000 to $89,999
- 373$90,000 to $99,999
- 567$100,000 to $124,999
- 501$125,000 to $149,999
- 819$150,000 to $174,999
- 743$175,000 to $199,999
- 1,464$200,000 to $249,999
- 1,352$250,000 to $299,999
- 2,413$300,000 to $399,999
- 1,617$400,000 to $499,999
- 1,273$500,000 to $749,999
- 80$750,000 to $999,999
- 32$1,000,000 to $1,499,999
- 66$1,500,000 to $1,999,999
- 222$2,000,000 or more
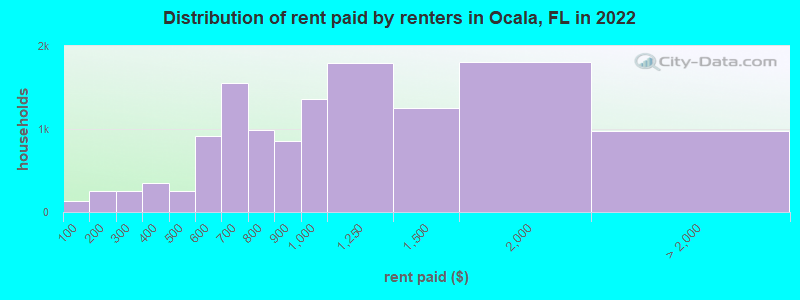
Rent paid by renters in 2022 in Ocala, FL
-
- 136Less than $100
- 71$100 to $149
- 188$150 to $199
- 161$200 to $249
- 96$250 to $299
- 290$300 to $349
- 62$350 to $399
- 138$400 to $449
- 112$450 to $499
- 342$500 to $549
- 572$550 to $599
- 1,062$600 to $649
- 488$650 to $699
- 659$700 to $749
- 331$750 to $799
- 849$800 to $899
- 1,359$900 to $999
- 1,792$1,000 to $1,249
- 1,251$1,250 to $1,499
- 1,805$1,500 to $1,999
- 271$2,000 to $2,499
- 126$2,500 to $2,999
- 210$3,000 to $3,499
- 79$3,500 or more
- 283No cash rent
Percentage of workers working in this county: 88.7%
Number of people working at home: 3,819 (13.3% of all workers)
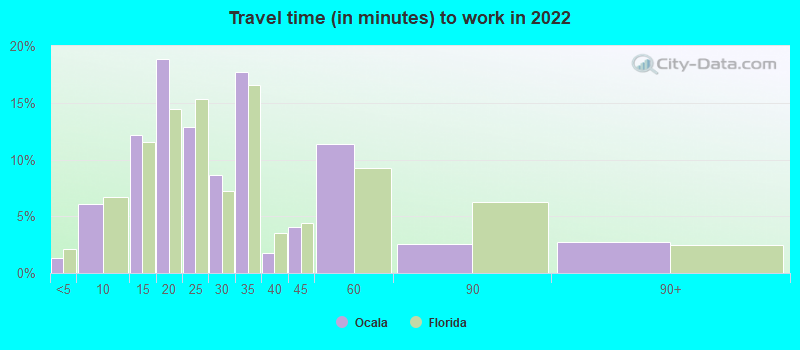
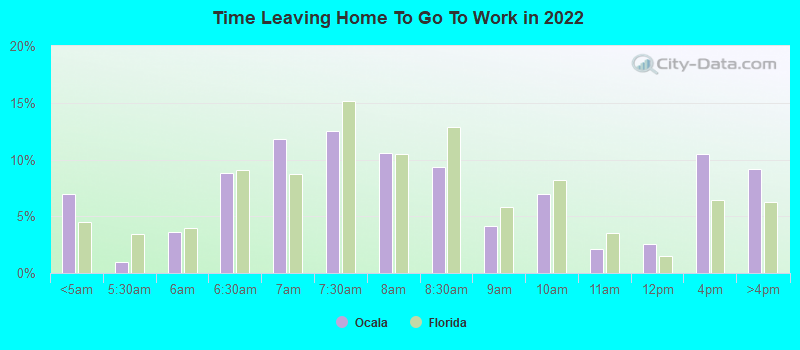
Travel time to work (commute)
- Less than 5 minutes: 947
- 5 to 9 minutes: 2,756
- 10 to 14 minutes: 6,297
- 15 to 19 minutes: 4,741
- 20 to 24 minutes: 2,668
- 25 to 29 minutes: 1,469
- 30 to 34 minutes: 1,642
- 35 to 39 minutes: 166
- 40 to 44 minutes: 418
- 45 to 59 minutes: 1,418
- 60 to 89 minutes: 242
- 90 or more minutes: 292
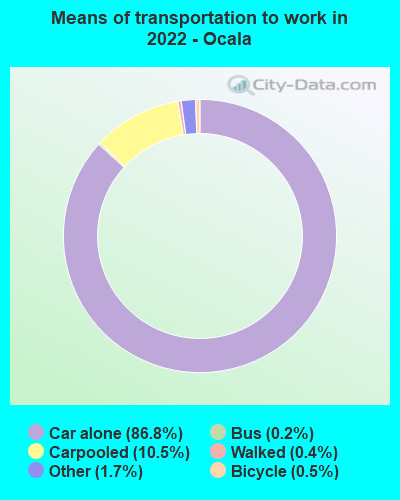
Means of transportation to work:
- Drove a car alone: 58,476 (78.6%)
- Carpooled: 7,513 (10.1%)
- Bus: 109 (0.1%)
- Taxi: 1,253 (1.7%)
- Bicycle: 318 (0.4%)
- Walked: 256 (0.3%)
- Worked at home: 3,746 (5.0%)
- Unemployment by race in 2022
- Unemployment rate for White non-Hispanic residents
- 1.1%Males
- Unemployment rate for Black residents
- 7.9%Males
- 11.0%Females
- Unemployment rate for Asian residents
- 2.4%Females
- Unemployment rate for other race residents
- 9.9%Males
- 1.2%Females
- Unemployment rate for two or more race residents
- 8.8%Males
- 10.0%Females
- Unemployment rate for Hispanic or Latino residents
- 9.3%Males
- 2.2%Females
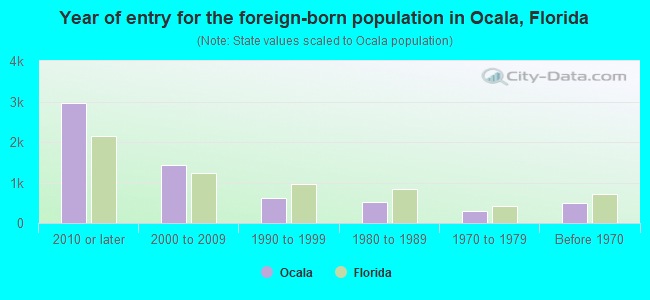
- Year of entry for the foreign-born population in Ocala, Florida
- 2,9522010 or later
- 1,4432000 to 2009
- 6231990 to 1999
- 5231980 to 1989
- 2911970 to 1979
- 501Before 1970
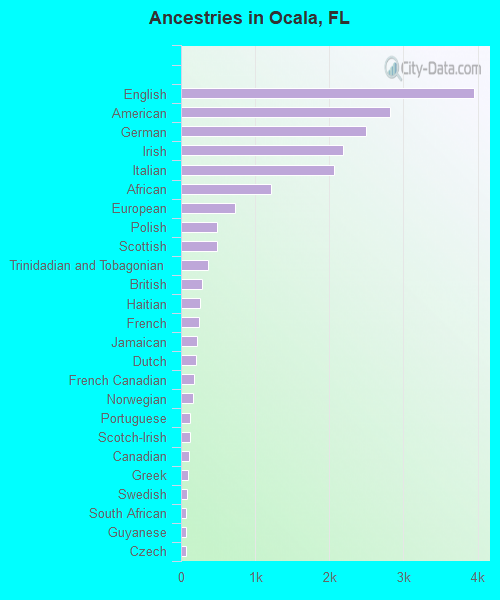
First ancestries reported:
- English: 3,957 (10.6%)
- American: 2,817 (7.6%)
- German: 2,502 (6.7%)
- Irish: 2,183 (5.9%)
- Italian: 2,063 (5.5%)
- African: 1,220 (3.3%)
- European: 735 (2.0%)
- Polish: 485 (1.3%)
- Scottish: 484 (1.3%)
- Trinidadian and Tobagonian: 361 (1.0%)
- British: 283 (0.8%)
- Haitian: 261 (0.7%)
- French: 248 (0.7%)
- Jamaican: 217 (0.6%)
- Dutch: 196 (0.5%)
- French Canadian: 177 (0.5%)
- Norwegian: 157 (0.4%)
- Portuguese: 127 (0.3%)
- Scotch-Irish: 122 (0.3%)
- Canadian: 105 (0.3%)
- Greek: 96 (0.3%)
- Swedish: 81 (0.2%)
- South African: 71 (0.2%)
- Guyanese: 67 (0.2%)
- Czech: 66 (0.2%)
- Russian: 63 (0.2%)
- Welsh: 62 (0.2%)
- British West Indian: 57 (0.2%)
- Hungarian: 48 (0.1%)
- U.S. Virgin Islander: 40 (0.1%)
- Moroccan: 39 (0.1%)
- Eastern European: 36 (0.10%)
- Lithuanian: 33 (0.09%)
- Afghan: 28 (0.08%)
- Romanian: 23 (0.06%)
- Australian: 21 (0.06%)
- Bahamian: 20 (0.05%)
- Armenian: 17 (0.05%)
- German Russian: 17 (0.05%)
- Czechoslovakian: 15 (0.04%)
- Austrian: 15 (0.04%)
- Turkish: 14 (0.04%)
- Basque: 12 (0.03%)
- Scandinavian: 12 (0.03%)
- Palestinian: 12 (0.03%)
- Egyptian: 12 (0.03%)
- Ukrainian: 11 (0.03%)
- Finnish: 9 (0.02%)
- Slovak: 8 (0.02%)
- Syrian: 5 (0.01%)
- Pennsylvania German: 3 (0.01%)
Most common places of birth for foreign-born residents (%):
| Ocala: | 15.9% (1,021) |
| Florida: | 5.7% (262,042) |
| Ocala: | 10.2% (655) |
| Florida: | 2.1% (94,349) |
| Ocala: | 7.1% (458) |
| Florida: | 6.5% (298,669) |
| Ocala: | 6.7% (428) |
| Florida: | 22.0% (1,006,576) |
| Ocala: | 6.2% (396) |
| Florida: | 3.0% (137,727) |
| Ocala: | 6.0% (382) |
| Florida: | 7.5% (342,375) |
| Ocala: | 3.9% (251) |
| Florida: | 0.2% (8,352) |
| Ocala: | 3.2% (206) |
| Florida: | 0.7% (34,227) |
| Ocala: | 2.8% (181) |
| Florida: | 1.3% (60,604) |
| Ocala: | 2.7% (174) |
| Florida: | 1.2% (54,585) |
| Ocala: | 2.7% (171) |
| Florida: | 0.7% (33,556) |
| Ocala: | 2.6% (166) |
| Florida: | 5.0% (227,319) |
| Ocala: | 2.3% (149) |
| Florida: | 1.8% (84,403) |
| Ocala: | 2.1% (134) |
| Florida: | 2.3% (107,160) |
| Ocala: | 2.1% (132) |
| Florida: | 1.2% (54,272) |
| Ocala: | 2.0% (131) |
| Florida: | 5.6% (257,152) |
| Ocala: | 1.9% (124) |
| Florida: | 1.3% (57,263) |
| Ocala: | 1.5% (99) |
| Florida: | 2.4% (109,132) |
| Ocala: | 1.5% (98) |
| Florida: | 2.3% (105,066) |
Place of birth for U.S.-born residents:
- This state: 30,165
- Other state: 23,626
- Northeast: 9,800
- Midwest: 6,101
- South: 6,158
- West: 1,567
83.6% of Ocala residents lived in the same house 1 years ago.
Out of people who lived in different houses, 36.3% lived in this county.
Out of people who lived in different counties, 60.5% lived in Florida.
| Ocala: | 83.6% |
| State average: | 86.3% |
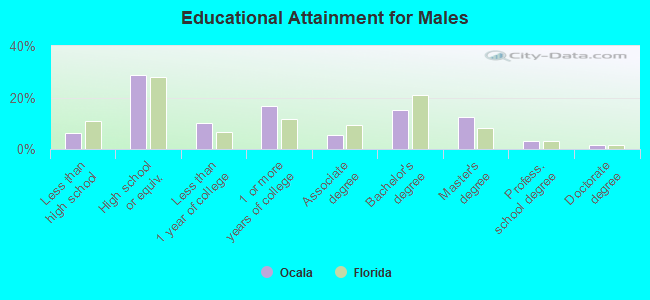
Education attainment for males 25 years and older:
- No schooling: 139
- Nursery to 4th grade: 0
- 5th and 6th grade: 50
- 7th and 8th grade: 203
- 9th grade: 49
- 10th grade: 50
- 11th grade: 388
- 12th grade, no diploma: 267
- High school graduate (or equivalency): 5,311
- Less than 1 year of college: 1,897
- Some college more than 1 year, no degree: 3,119
- Associate degree: 1,024
- Bachelor's degree: 2,774
- Master's degree: 2,331
- Professional school degree: 591
- Doctorate degree: 291
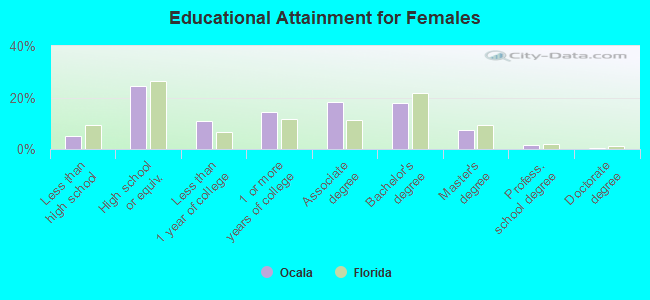
Education attainment for females 25 years and older:
- No schooling: 145
- Nursery to 4th grade: 69
- 5th and 6th grade: 105
- 7th and 8th grade: 266
- 9th grade: 79
- 10th grade: 81
- 11th grade: 200
- 12th grade, no diploma: 259
- High school graduate (or equivalency): 5,830
- Less than 1 year of college: 2,596
- Some college more than 1 year, no degree: 3,441
- Associate degree: 4,321
- Bachelor's degree: 4,273
- Master's degree: 1,781
- Professional school degree: 341
- Doctorate degree: 66
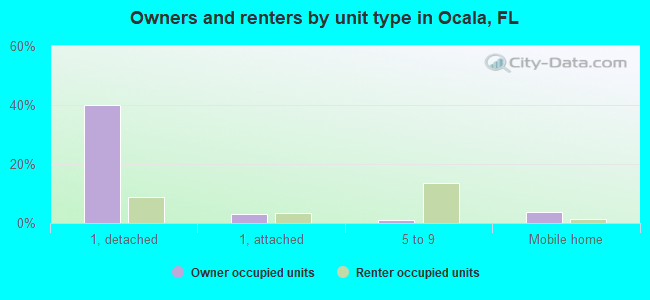
Housing units in structures:
- One, detached: 13,342
- One, attached: 2,086
- Two: 678
- 3 or 4: 1,945
- 5 to 9: 3,839
- 10 to 19: 3,093
- 20 to 49: 435
- 50 or more: 2,134
- Mobile homes: 1,652
- Boats, RVs, vans, etc.: 198
Median worth of mobile homes: $45,700
Housing units lacking complete kitchen facilities in 2022: 4.9%
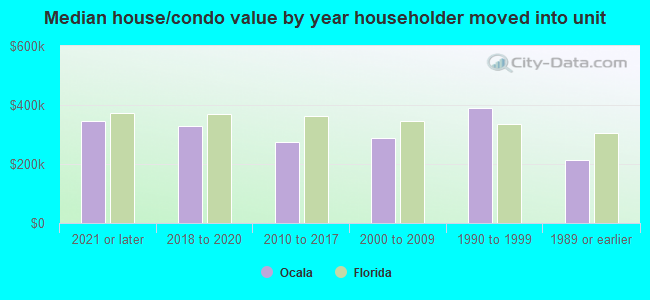
House/condo owner moved in on average 10 years ago
Renter moved in on average 3 years ago
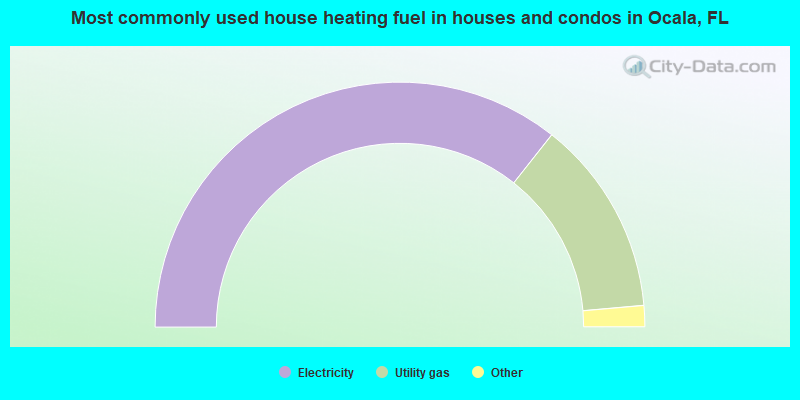
- 71.3%Electricity
- 25.9%Utility gas
- 0.9%Fuel oil, kerosene, etc.
- 0.9%No fuel used
- 0.8%Bottled, tank, or LP gas
- 0.1%Solar energy
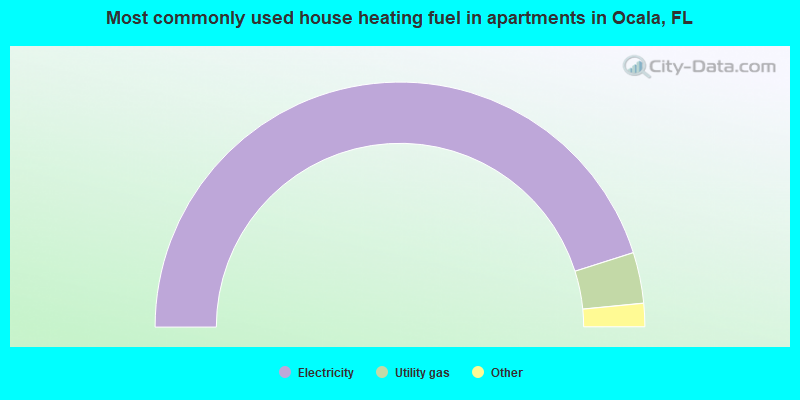
- 90.2%Electricity
- 6.7%Utility gas
- 2.1%No fuel used
- 0.5%Bottled, tank, or LP gas
- 0.4%Fuel oil, kerosene, etc.
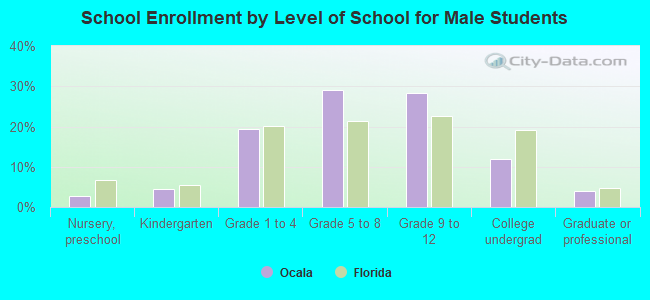
Private vs. public school enrollment:
| Here: | 12.0% |
| Florida: | 15.8% |
| Here: | 9.9% |
| Florida: | 12.9% |
| Here: | 30.6% |
| Florida: | 23.6% |