Housing density: 138 houses/condos per square mile
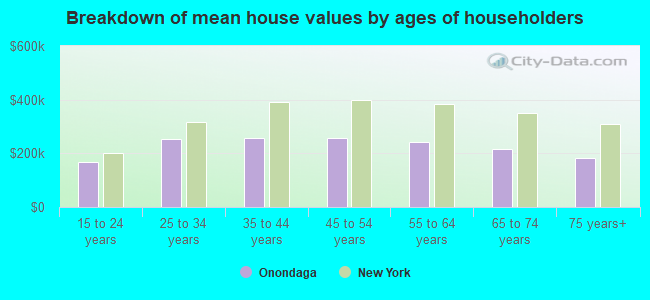
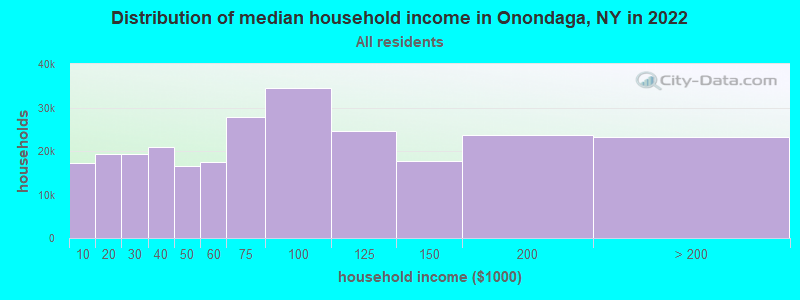
Median price asked for vacant for-sale houses and condos in 2022 in this county: $60,373.
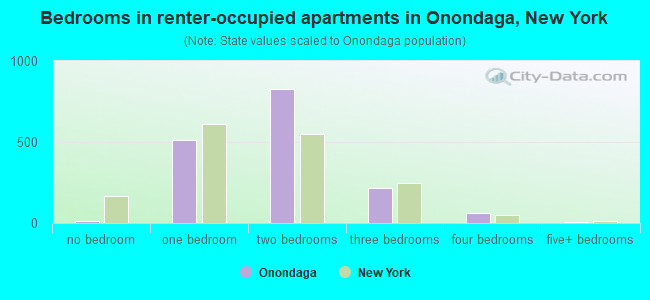
Median contract rent in 2022: $1,033 (lower quartile is $850, upper quartile is $1,283)
Median rent asked for vacant for-rent units in 2022: $980
Median gross rent in Onondaga, NY in 2022: $1,202
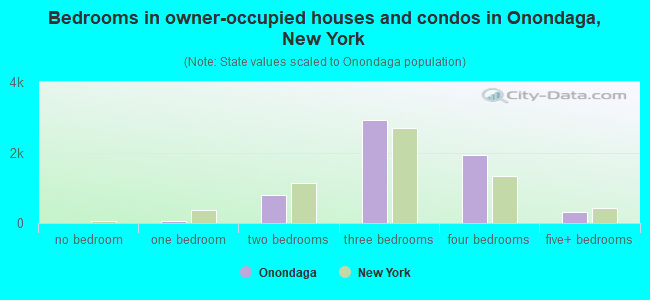
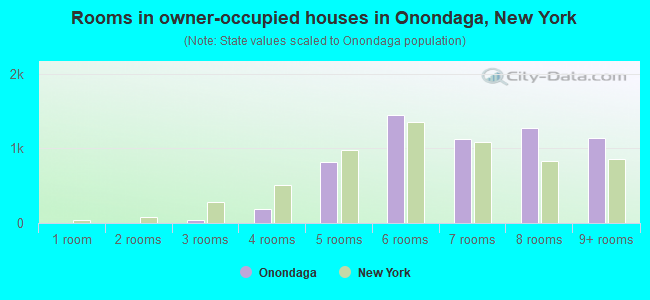
Housing units in Onondaga with a mortgage: 3,847 (288 second mortgage, 650 home equity loan, 7 both second mortgage and home equity loan) Houses without a mortgage: 1,803
In family households: 358,168 (74,643 male householders, 40,640 female householders)
81,289 spouses, 131,650 children (123,979 natural, 3,067 adopted, 4,604 stepchildren), 7,646 grandchildren, 3,233 brothers or sisters, 3,161 parents, foster children, 3,596 other relatives, 10,424 non-relatives
In nonfamily households: 91,789 (33,178 male householders (25,133 living alone)), 39,225 female householders (32,473 living alone)), 19,386 nonrelatives
In group quarters: 17,069 (4,484 institutionalized population)
75,395 married couples with children.
33,683 single-parent households (6,194 men, 27,489 women).
93.9% of residents of Onondaga speak English at home.
1.1% of residents speak Spanish at home (72% speak English very well, 13% speak English well, 15% speak English not well).
3.3% of residents speak other Indo-European language at home (65% speak English very well, 24% speak English well, 11% speak English not well).
1.4% of residents speak Asian or Pacific Island language at home (45% speak English very well, 28% speak English well, 23% speak English not well, 4% don't speak English at all).
0.3% of residents speak other language at home (89% speak English very well, 11% speak English well).
Foreign born population: 1,291 (6.0%)
(67.3% of them are naturalized citizens)
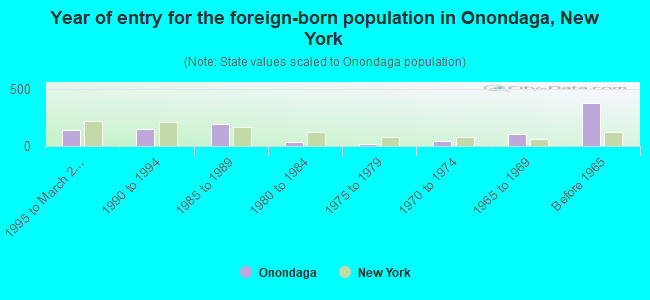
Year of entry for the foreign-born population in Onondaga, New York
1361995 to March 2000
1521990 to 1994
1921985 to 1989
371980 to 1984
161975 to 1979
441970 to 1974
1081965 to 1969
372Before 1965
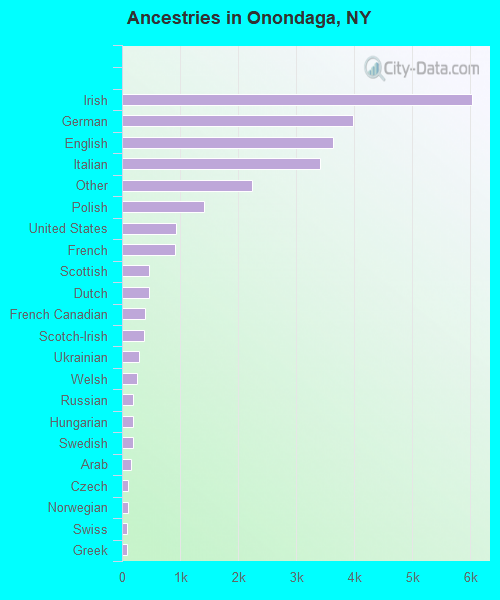
First ancestries reported:
Irish: 6,023 (23.1%)
German: 3,986 (15.3%)
English: 3,641 (13.9%)
Italian: 3,418 (13.1%)
Other: 2,237 (8.6%)
Polish: 1,418 (5.4%)
United States: 927 (3.6%)
French: 916 (3.5%)
Scottish: 473 (1.8%)
Dutch: 470 (1.8%)
French Canadian: 401 (1.5%)
Scotch-Irish: 373 (1.4%)
Ukrainian: 293 (1.1%)
Welsh: 252 (1.0%)
Russian: 191 (0.7%)
Hungarian: 189 (0.7%)
Swedish: 186 (0.7%)
Arab: 158 (0.6%)
Czech: 110 (0.4%)
Norwegian: 109 (0.4%)
Swiss: 92 (0.4%)
Greek: 90 (0.3%)
Slovak: 48 (0.2%)
Portuguese: 46 (0.2%)
Danish: 39 (0.1%)
Subsaharan African: 14 (0.05%)
Lithuanian: 8 (0.03%)
West Indian: 4 (0.02%)
Most common places of birth for foreign-born residents (%):
Korea
Onondaga:
16.3% (172)
New York:
2.5% (97,933)
Germany
Onondaga:
7.1% (75)
New York:
1.8% (69,327)
Poland
Onondaga:
6.9% (73)
New York:
2.4% (93,187)
Canada
Onondaga:
6.5% (69)
New York:
1.4% (54,876)
Italy
Onondaga:
5.7% (60)
New York:
3.8% (147,729)
Philippines
Onondaga:
5.6% (59)
New York:
1.9% (72,408)
Other Eastern Europe
Onondaga:
5.5% (58)
New York:
1.4% (53,825)
United Kingdom
Onondaga:
4.7% (50)
New York:
1.6% (62,237)
Japan
Onondaga:
4.7% (50)
New York:
0.8% (32,034)
Ireland
Onondaga:
4.2% (44)
New York:
1.1% (41,934)
China, excluding Hong Kong and Taiwan
Onondaga:
3.7% (39)
New York:
6.0% (233,766)
Yugoslavia
Onondaga:
3.2% (34)
New York:
0.7% (25,688)
Other South Eastern Asia
Onondaga:
3.0% (32)
New York:
0.2% (6,761)
Greece
Onondaga:
2.8% (30)
New York:
1.1% (42,335)
Syria
Onondaga:
2.4% (25)
New York:
0.2% (6,226)
Asia, n.e.c.
Onondaga:
2.1% (22)
New York:
0.1% (3,580)
Hungary
Onondaga:
1.8% (19)
New York:
0.4% (17,401)
Jordan
Onondaga:
1.6% (17)
New York:
0.1% (4,084)
Place of birth for U.S.-born residents:
This state: 17,469
Other state: 2,416
Northeast: 1,004
Midwest: 632
South: 531
West: 249
65% of Onondaga residents lived in the same house 5 years ago. Out of people who lived in different houses, 77% lived in this county. Out of people who lived in different counties, 50% lived in New York.
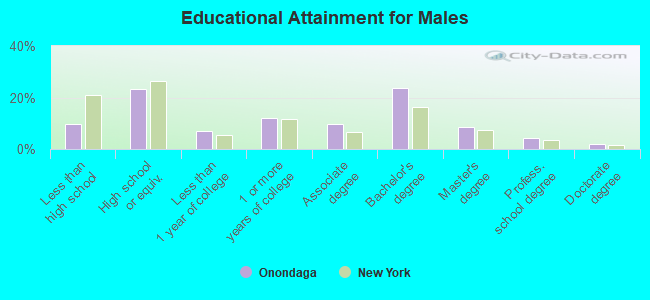
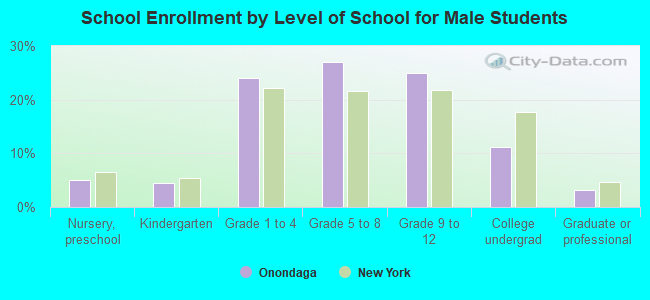
Education attainment for males 25 years and older:
No schooling: 36
Nursery to 4th grade: 8
5th and 6th grade: 33
7th and 8th grade: 109
9th grade: 82
10th grade: 125
11th grade: 132
12th grade, no diploma: 107
High school graduate (or equivalency): 1,528
Less than 1 year of college: 449
Some college more than 1 year, no degree: 799
Associate degree: 628
Bachelor's degree: 1,564
Master's degree: 555
Professional school degree: 292
Doctorate degree: 133
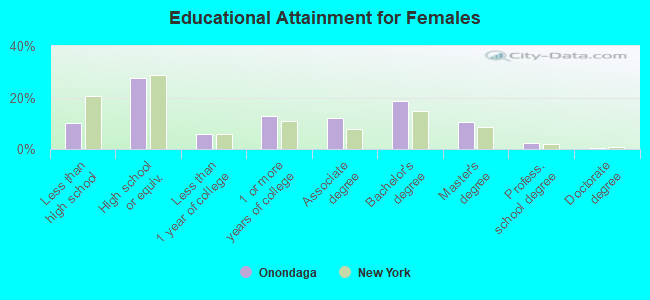
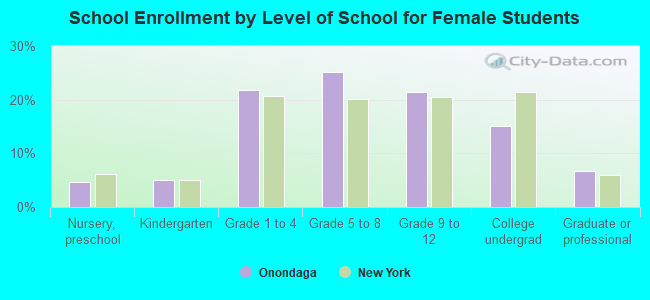
Education attainment for females 25 years and older:
No schooling: 39
Nursery to 4th grade: 34
5th and 6th grade: 60
7th and 8th grade: 167
9th grade: 61
10th grade: 140
11th grade: 132
12th grade, no diploma: 128
High school graduate (or equivalency): 2,117
Less than 1 year of college: 437
Some college more than 1 year, no degree: 993
Associate degree: 910
Bachelor's degree: 1,430
Master's degree: 808
Professional school degree: 178
Doctorate degree: 32
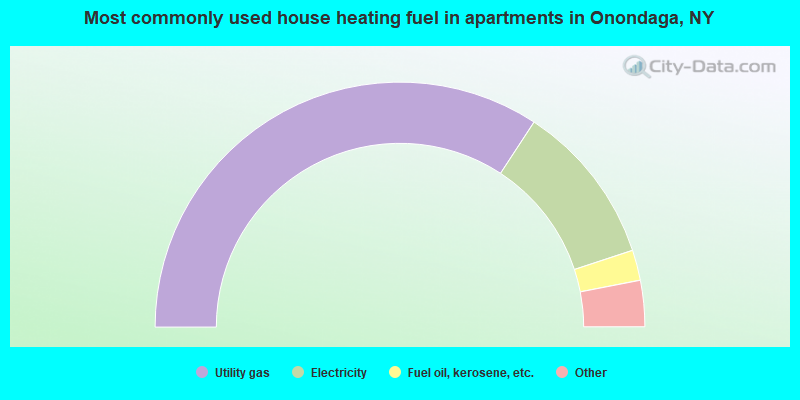
Housing units in structures:
One, detached: 6,409
One, attached: 145
Two: 156
3 or 4: 226
5 to 9: 680
10 to 19: 40
20 to 49: 88
50 or more: 202
Mobile homes: 6
Housing units lacking complete plumbing facilities: 0.2%
Housing units lacking complete kitchen facilities: 0.1%