Housing density: 625 houses/condos per square mile
Median price asked for vacant for-sale houses and condos in 2022: $1,125,277.
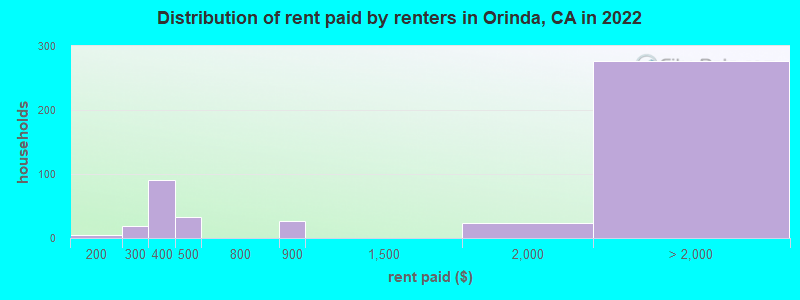
Median contract rent in 2022: over $2,000
Median rent asked for vacant for-rent units in 2022: $1,890
Median gross rent in Orinda, CA in 2022: over $2,000
Housing units in Orinda with a mortgage: 5,037 (917 second mortgage, 8 home equity loan, 908 both second mortgage and home equity loan) Houses without a mortgage: 73
Median household income for houses/condos with a mortgage: $252,501
Median household income for apartments without a mortgage: $156,408
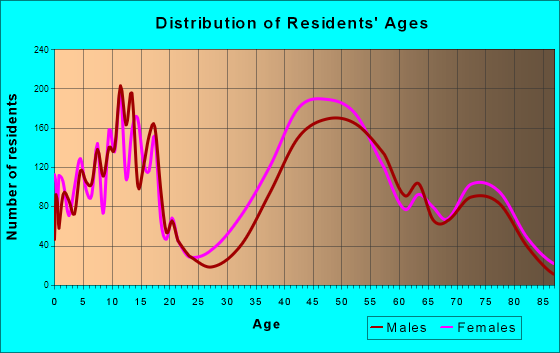
Size of family households: 2,349 2-persons, 1,242 3-persons, 1,474 4-persons, 439 5-persons, 55 6-persons, 8 7-or-more-persons.
Size of nonfamily households: 1,560 1-person, 418 2-persons, 16 3-persons.
4,353 married couples with children.
190 single-parent households (116 men, 74 women).
80.0% of residents of Orinda speak English at home.
2.9% of residents speak Spanish at home (45% speak English very well, 55% speak English well).
7.6% of residents speak other Indo-European language at home (85% speak English very well, 10% speak English well, 6% speak English not well).
8.5% of residents speak Asian or Pacific Island language at home (74% speak English very well, 21% speak English well, 5% speak English not well, 1% don't speak English at all).
0.5% of residents speak other language at home (100% speak English very well).
Foreign born population: 3,765 (19.4%)
(80.3% of them are naturalized citizens)
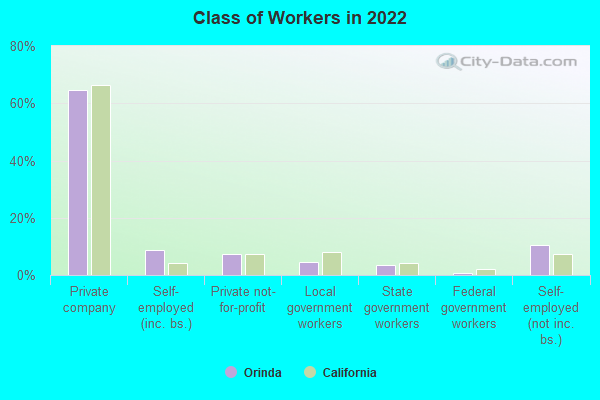
Percentage of workers working in this county: 61.1% Number of people working at home: 3,220 (36.2% of all workers)
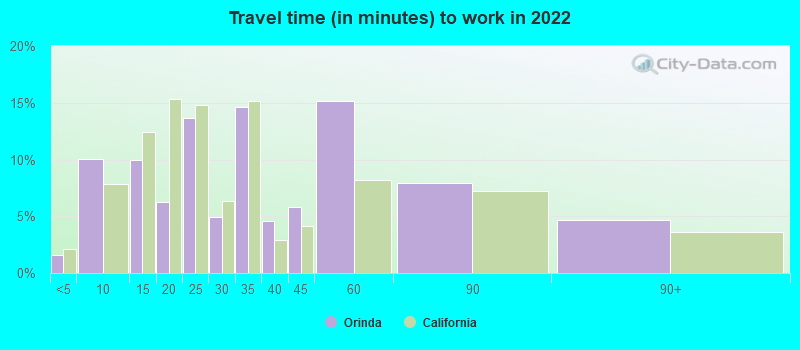
Travel time to work (commute)
Less than 5 minutes: 42
5 to 9 minutes: 367
10 to 14 minutes: 558
15 to 19 minutes: 600
20 to 24 minutes: 814
25 to 29 minutes: 229
30 to 34 minutes: 836
35 to 39 minutes: 138
40 to 44 minutes: 311
45 to 59 minutes: 1,144
60 to 89 minutes: 834
90 or more minutes: 162
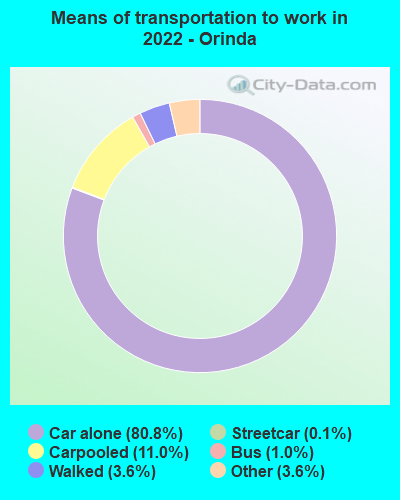
Means of transportation to work:
Drove a car alone: 2,834 (43.6%)
Carpooled: 431 (6.6%)
Bus: 27 (0.4%)
Subway or elevated rail: 2 (0.0%)
Taxi: 134 (2.1%)
Walked: 178 (2.7%)
Worked at home: 3,220 (49.5%)
Unemployment by race in 2022
Unemployment rate for White non-Hispanic residents
1.1%Males
2.5%Females
Unemployment rate for Asian residents
5.8%Males
0.9%Females
Unemployment rate for two or more race residents
6.8%Males
7.9%Females
Unemployment rate for Hispanic or Latino residents
4.9%Males
9.8%Females
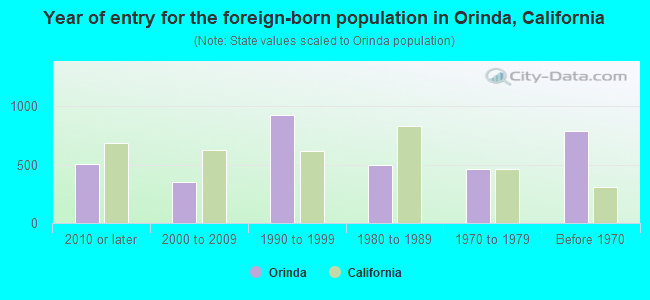
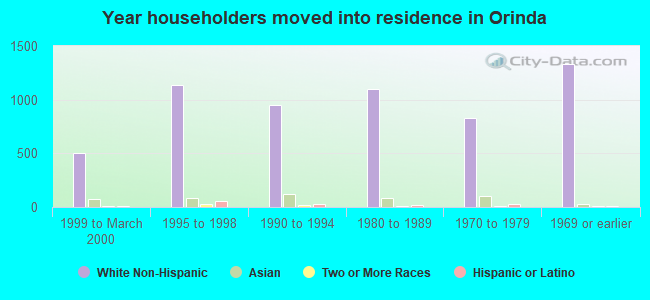
Year of entry for the foreign-born population in Orinda, California
5062010 or later
3522000 to 2009
9251990 to 1999
4971980 to 1989
4581970 to 1979
790Before 1970
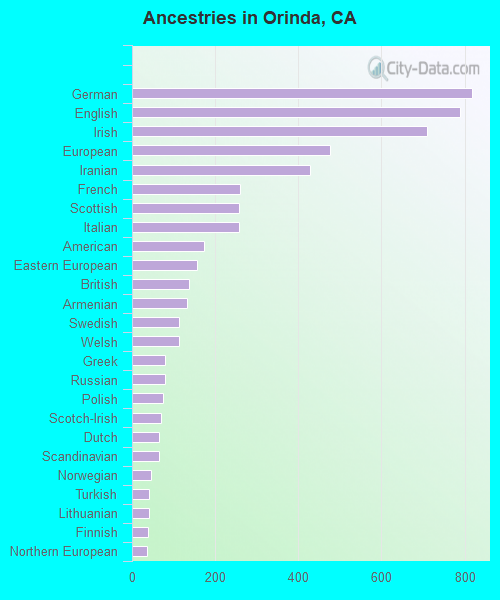
First ancestries reported:
German: 818 (9.3%)
English: 788 (9.0%)
Irish: 710 (8.1%)
European: 477 (5.4%)
Iranian: 428 (4.9%)
French: 259 (2.9%)
Scottish: 258 (2.9%)
Italian: 257 (2.9%)
American: 173 (2.0%)
Eastern European: 157 (1.8%)
British: 137 (1.6%)
Armenian: 133 (1.5%)
Swedish: 114 (1.3%)
Welsh: 112 (1.3%)
Greek: 80 (0.9%)
Russian: 79 (0.9%)
Polish: 74 (0.8%)
Scotch-Irish: 69 (0.8%)
Dutch: 65 (0.7%)
Scandinavian: 65 (0.7%)
Norwegian: 45 (0.5%)
Turkish: 42 (0.5%)
Lithuanian: 40 (0.5%)
Finnish: 39 (0.4%)
Northern European: 36 (0.4%)
French Canadian: 35 (0.4%)
Slovak: 26 (0.3%)
Portuguese: 25 (0.3%)
Maltese: 21 (0.2%)
Iraqi: 19 (0.2%)
Swiss: 19 (0.2%)
Danish: 16 (0.2%)
Czech: 15 (0.2%)
Hungarian: 13 (0.1%)
Latvian: 10 (0.1%)
Australian: 7 (0.08%)
Canadian: 7 (0.08%)
Ukrainian: 6 (0.07%)
Romanian: 4 (0.05%)
Most common places of birth for foreign-born residents (%):
China, excluding Hong Kong and Taiwan
Orinda:
13.0% (464)
California:
6.6% (684,672)
Iran
Orinda:
8.8% (313)
California:
2.0% (206,004)
India
Orinda:
6.4% (229)
California:
5.2% (539,184)
Taiwan
Orinda:
6.2% (221)
California:
1.7% (176,274)
Germany
Orinda:
6.1% (217)
California:
0.7% (73,304)
Korea
Orinda:
5.9% (210)
California:
3.0% (315,248)
Vietnam
Orinda:
5.8% (207)
California:
4.9% (512,335)
Hong Kong
Orinda:
5.5% (194)
California:
1.0% (105,215)
United Kingdom, excluding England and Scotland
Orinda:
3.5% (125)
California:
0.6% (60,582)
Canada
Orinda:
3.2% (114)
California:
1.2% (127,477)
Russia
Orinda:
2.9% (103)
California:
0.7% (71,932)
Honduras
Orinda:
2.9% (102)
California:
0.6% (66,590)
France
Orinda:
2.7% (96)
California:
0.4% (40,224)
Philippines
Orinda:
2.6% (92)
California:
7.8% (818,297)
Argentina
Orinda:
2.0% (71)
California:
0.3% (33,960)
El Salvador
Orinda:
1.7% (59)
California:
4.2% (440,287)
Place of birth for U.S.-born residents:
This state: 9,781
Other state: 5,334
Northeast: 1,850
Midwest: 2,077
South: 812
West: 659
90.9% of Orinda residents lived in the same house 1 years ago. Out of people who lived in different houses, 28.7% lived in this county. Out of people who lived in different counties, 81.7% lived in California.
Orinda:
90.9%
State average:
88.9%
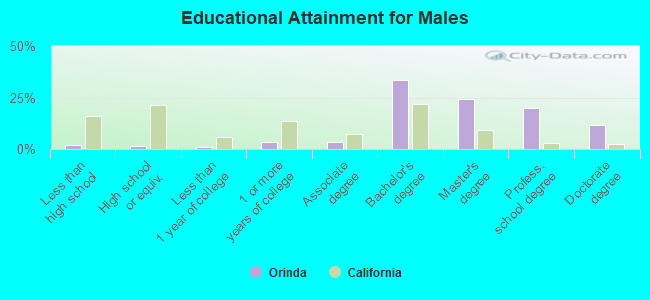
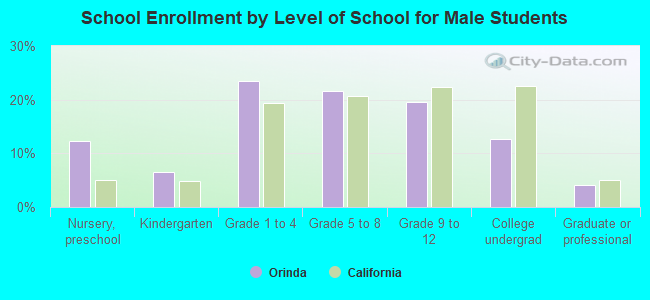
Education attainment for males 25 years and older:
No schooling: 78
Nursery to 4th grade: 30
5th and 6th grade: 0
7th and 8th grade: 0
9th grade: 0
10th grade: 0
11th grade: 20
12th grade, no diploma: 8
High school graduate (or equivalency): 119
Less than 1 year of college: 54
Some college more than 1 year, no degree: 264
Associate degree: 249
Bachelor's degree: 2,428
Master's degree: 1,755
Professional school degree: 1,439
Doctorate degree: 831
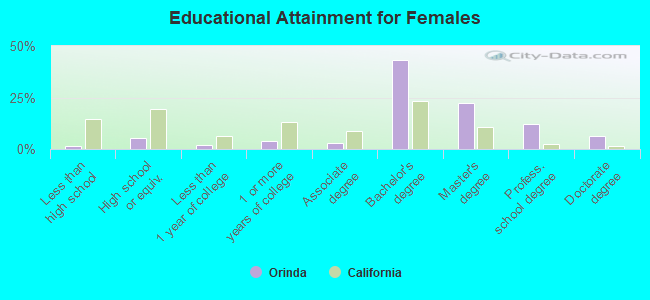
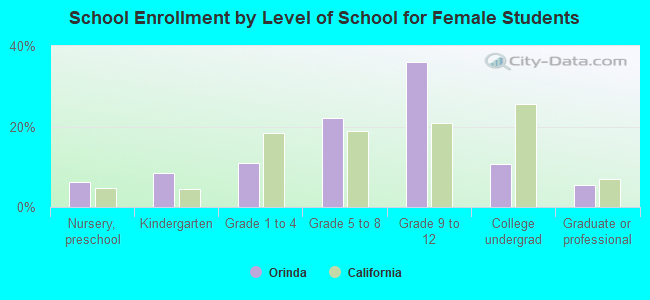
Education attainment for females 25 years and older:
No schooling: 60
Nursery to 4th grade: 0
5th and 6th grade: 0
7th and 8th grade: 10
9th grade: 0
10th grade: 1
11th grade: 0
12th grade, no diploma: 30
High school graduate (or equivalency): 376
Less than 1 year of college: 140
Some college more than 1 year, no degree: 262
Associate degree: 211
Bachelor's degree: 3,008
Master's degree: 1,544
Professional school degree: 844
Doctorate degree: 454
Housing units in structures:
One, detached: 7,500
One, attached: 67
3 or 4: 10
10 to 19: 10
20 to 49: 30
50 or more: 245
Boats, RVs, vans, etc.: 6
Housing units lacking complete plumbing facilities in 2022: 0.1%
Housing units lacking complete kitchen facilities in 2022: 0.5%
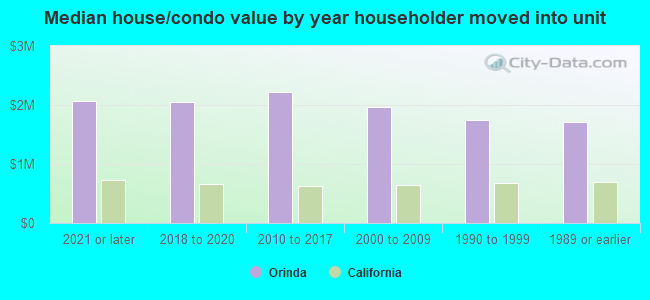
House/condo owner moved in on average 16 years ago