Orlando, FL (Florida) Houses and Residents
Estimated median house or condo value in 2022: $389,900 (it was $97,400 in 2000 )
Orlando:
$389,900Florida:
$354,100
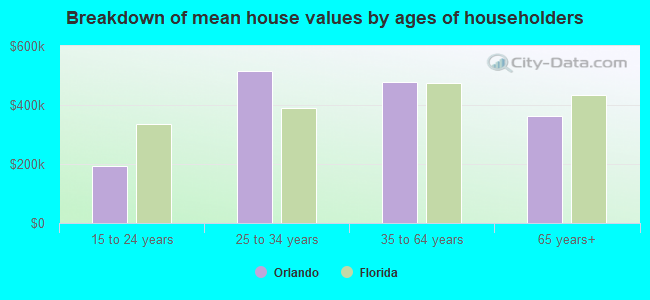
Lower value quartile - upper value quartile: $257,400 - $614,400Mean price in 2022: Detached houses: $521,028 Here:
$521,028State:
$500,941
Townhouses or other attached units: $321,064 Here:
$321,064State:
$370,869
In 2-unit structures: $325,707 Here:
$325,707State:
$423,188
In 3-to-4-unit structures: $191,574 Here:
$191,574State:
$309,944
In 5-or-more-unit structures: $282,118 Here:
$282,118State:
$447,145
Mobile homes: $805,289 Here:
$805,289State:
$113,202
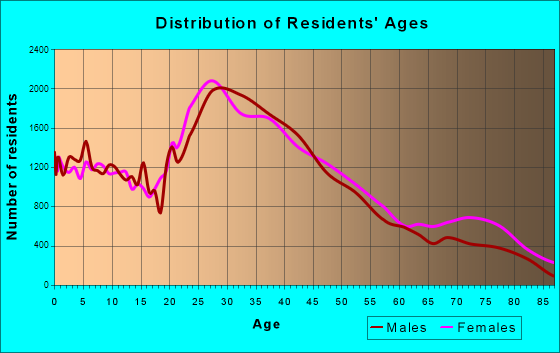
Total population: 262,372 (Urban population: 185,145, Rural population: 839 (all nonfarm) )
Houses: 147,352 (136,364 occupied: 55,097 owner occupied, 81,267 renter occupied )
% of renters here:
60%State:
33%
Housing density: 1,576 houses/condos per square mile
Median price asked for vacant for-sale houses and condos in 2022: $119,954.
Median contract rent in 2022: $1,425 (lower quartile is $1,108, upper quartile is $1,862)
Median rent asked for vacant for-rent units in 2022: $1,012
Median gross rent in Orlando, FL in 2022: $1,595
Housing units in Orlando with a mortgage: 39,135 (3,433 second mortgage, 67 home equity loan, 2,977 both second mortgage and home equity loan )Houses without a mortgage: 1,186
Median household income for houses/condos with a mortgage: $98,224
Median household income for apartments without a mortgage: $68,831
Median monthly housing costs: $1,552
Data:
Median house or condo value ($)
Median house or condo value ($ change since 2000)
Median house or condo value ($) - White
Median house or condo value ($) - Black or African American
Median house or condo value ($) - Asian
Median house or condo value ($) - Hispanic or Latino
Median house or condo value ($) - American Indian and Alaska Native
Median house or condo value ($) - Multirace
Median house or condo value ($) - Other Race
Median price asked for mobile homes ($)
Household density (households per square mile)
Mean house or condo value by units in structure - 1, detached ($)
Mean house or condo value by units in structure - 1, attached ($)
Mean house or condo value by units in structure - 2 ($)
Mean house or condo value by units in structure by units in structure - 3 or 4 ($)
Mean house or condo value by units in structure - 5 or more ($)
Mean house or condo value by units in structure - Boat, RV, van, etc. ($)
Mean house or condo value by units in structure - Mobile home ($)
Median contract rent ($)
Median contract rent - Lower quartile ($)
Median contract rent - Upper quartile ($)
Median gross rent ($)
Urban houses (%)
Rural houses (%)
Houses occupied (%)
Houses occupied (% change since 2000)
Houses owner occupied (%)
Houses owner occupied (% change since 2000)
Houses renter occupied (%)
Houses renter occupied (% change since 2000)
Vacant housing units - For rent (%)
Vacant housing units - For rent (% change since 2000)
Vacant housing units - For sale only (%)
Vacant housing units - For sale only (% change since 2000)
Vacant housing units - Rented or sold, not occupied (%)
Vacant housing units - Rented or sold, not occupied (% change since 2000)
Vacant housing units - For seasonal, recreational, or occasional use (%)
Vacant housing units - For seasonal, recreational, or occasional use (% change since 2000)
Vacant housing units - For migrant workers (%)
Vacant housing units - For migrant workers (% change since 2000)
Vacant housing units - Other vacant (%)
Vacant housing units - Other vacant (% change since 2000)
Median monthly housing costs ($)
Median household income for houses/condos with a mortgage ($)
Median household income for houses/condos without a mortgage ($)
Median household income ($)
Median household income ($) - White
Median household income ($) - Black or African American
Median household income ($) - Asian
Median household income ($) - Hispanic or Latino
Median household income ($) - American Indian and Alaska Native
Median household income ($) - Multirace
Median household income ($) - Other Race
Mortgage status - with mortgage (%)
Mortgage status - with second mortgage (%)
Mortgage status - with home equity loan (%)
Mortgage status - with both second mortgage and home equity loan (%)
Mortgage status - without a mortgage (%)
Median year house/condo built
Median year apartment built
Household type by relationship - Male householder living alone (%)
Household type by relationship - Male householder not living alone (%)
Household type by relationship - Female householder living alone (%)
Household type by relationship - Female householder not living alone (%)
Household type by relationship - Opposite-Sex spouse (%)
Household type by relationship - Same-Sex spouse (%)
Household type by relationship - Opposite-Sex unmarried partner (%)
Household type by relationship - Same-Sex unmarried partner (%)
Household type by relationship - In group quarters (%)
Size of family households - 2-person household (%)
Size of family households - 3-person household (%)
Size of family households - 4-person household (%)
Size of family households - 5-person household (%)
Size of family households - 6-person household (%)
Size of family households - 7-or-more-person household (%)
Size of nonfamily households - 1-person household (%)
Size of nonfamily households - 2-person household (%)
Size of nonfamily households - 3-person household (%)
Size of nonfamily households - 4-person household (%)
Size of nonfamily households - 5-person household (%)
Size of nonfamily households - 6-person household (%)
Size of nonfamily households - 7-or-moreperson household (%)
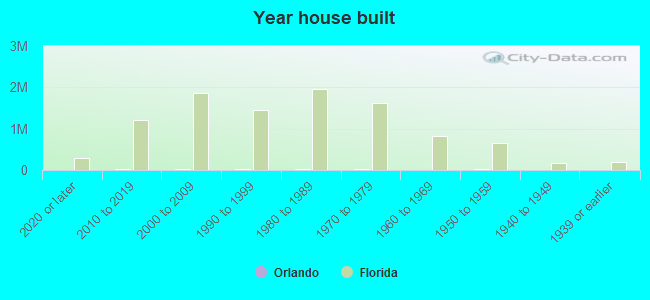
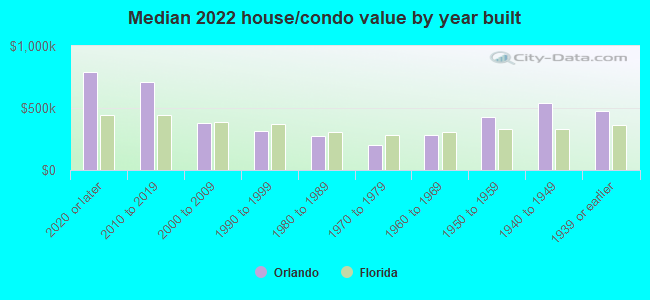
Year house built - Built 2010 or later (%)
Year house built - Built 2000 to 2009 (%)
Year house built - Built 1990 to 1999 (%)
Year house built - Built 1980 to 1989 (%)
Year house built - Built 1970 to 1979 (%)
Year house built - Built 1960 to 1969 (%)
Year house built - Built 1950 to 1959 (%)
Year house built - Built 1940 to 1949 (%)
Year house built - Built 1939 or earlier (%)
Median number of rooms in houses and condos
Median number of rooms in apartments
Median number of bedrooms in owner occupied houses
Mean number of bedrooms in owner occupied houses
Median number of bedrooms in renter occupied houses
Mean number of bedrooms in renter occupied houses
Median number of vehichles in owner occupied houses
Mean number of vehichles in owner occupied houses
Median number of vehichles in renter occupied houses
Mean number of vehichles in renter occupied houses
Rooms in owner-occupied houses - 1 room (%)
Rooms in owner-occupied houses - 2 rooms (%)
Rooms in owner-occupied houses - 3 rooms (%)
Rooms in owner-occupied houses - 4 rooms (%)
Rooms in owner-occupied houses - 5 rooms (%)
Rooms in owner-occupied houses - 6 rooms (%)
Rooms in owner-occupied houses - 7 rooms (%)
Rooms in owner-occupied houses - 8 rooms (%)
Rooms in owner-occupied houses - 9+ rooms (%)
Rooms in renter-occupied houses - 1 room (%)
Rooms in renter-occupied houses - 2 rooms (%)
Rooms in renter-occupied houses - 3 rooms (%)
Rooms in renter-occupied houses - 4 rooms (%)
Rooms in renter-occupied houses - 5 rooms (%)
Rooms in renter-occupied houses - 6 rooms (%)
Rooms in renter-occupied houses - 7 rooms (%)
Rooms in renter-occupied houses - 8 rooms (%)
Rooms in renter-occupied houses - 9+ rooms (%)
Bedrooms in owner-occupied houses - no bedrooms (%)
Bedrooms in owner-occupied houses - 1 bedroom (%)
Bedrooms in owner-occupied houses - 2 bedrooms (%)
Bedrooms in owner-occupied houses - 3 bedrooms (%)
Bedrooms in owner-occupied houses - 4 bedrooms (%)
Bedrooms in owner-occupied houses - 5+ bedrooms (%)
Bedrooms in renter-occupied houses - no bedrooms (%)
Bedrooms in renter-occupied houses - 1 bedroom (%)
Bedrooms in renter-occupied houses - 2 bedrooms (%)
Bedrooms in renter-occupied houses - 3 bedrooms (%)
Bedrooms in renter-occupied houses - 4 bedrooms (%)
Bedrooms in renter-occupied houses - 5+ bedrooms (%)
Vehicles available in owner-occupied houses - no vehicle available (%)
Vehicles available in owner-occupied houses - 1 vehicle available(%)
Vehicles available in owner-occupied houses - 2 Vehicles available (%)
Vehicles available in owner-occupied houses - 3 Vehicles available (%)
Vehicles available in owner-occupied houses - 4 Vehicles available (%)
Vehicles available in owner-occupied houses - 5+ Vehicles available (%)
Vehicles available in renter-occupied houses - no vehicle available (%)
Vehicles available in renter-occupied houses - 1 vehicle available (%)
Vehicles available in renter-occupied houses - 2 Vehicles available (%)
Vehicles available in renter-occupied houses - 3 Vehicles available (%)
Vehicles available in renter-occupied houses - 4 Vehicles available (%)
Vehicles available in renter-occupied houses - 5+ Vehicles available (%)
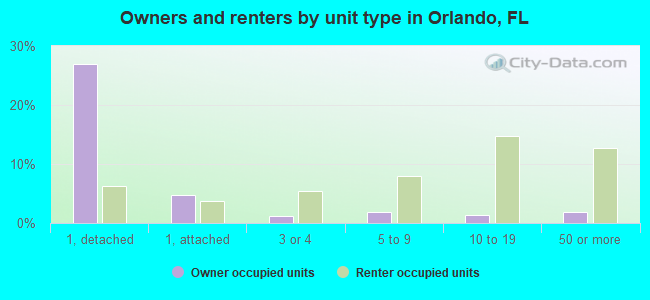
Housing units in structures - 1, detached (%)
Housing units in structures - 1, attached (%)
Housing units in structures - 2 (%)
Housing units in structures - 3 or 4 (%)
Housing units in structures - 5 to 9 (%)
Housing units in structures - 10 to 19 (%)
Housing units in structures - 20 to 49 (%)
Housing units in structures - 50 or more (%)
Housing units in structures - Mobile home (%)
Housing units in structures - Boat, RV, van, etc. (%)
Housing units in structures - Owners - 1, detached (%)
Housing units in structures - Owners - 1, attached (%)
Housing units in structures - Owners - 2 (%)
Housing units in structures - Owners - 3 or 4 (%)
Housing units in structures - Owners - 5 to 9 (%)
Housing units in structures - Owners - 10 to 19 (%)
Housing units in structures - Owners - 20 to 49 (%)
Housing units in structures - Owners - 50 or more (%)
Housing units in structures - Owners - Mobile home (%)
Housing units in structures - Owners - Boat, RV, van, etc. (%)
Housing units in structures - Renters - 1, detached (%)
Housing units in structures - Renters - 1, attached (%)
Housing units in structures - Renters - 2 (%)
Housing units in structures - Renters - 3 or 4 (%)
Housing units in structures - Renters - 5 to 9 (%)
Housing units in structures - Renters - 10 to 19 (%)
Housing units in structures - Renters - 20 to 49 (%)
Housing units in structures - Renters - 50 or more (%)
Housing units in structures - Renters - Mobile home (%)
Housing units in structures - Renters - Boat, RV, van, etc. (%)
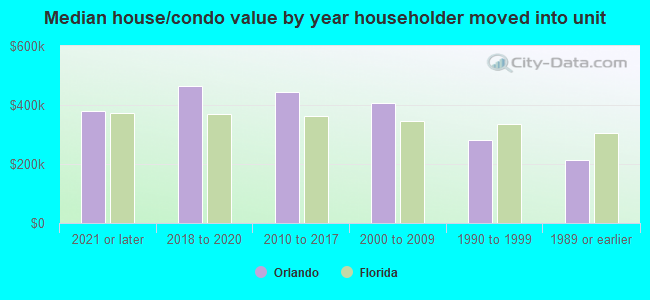
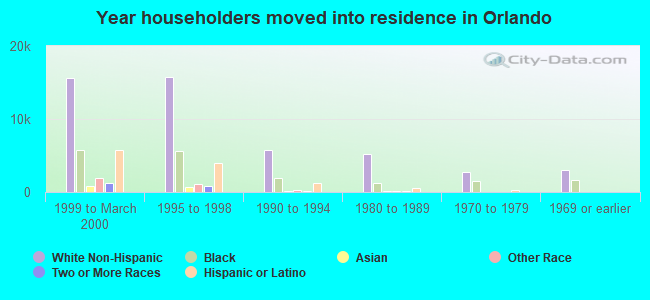
House/condo owner moved in on average (years ago)
Renter moved in on average (years ago)
Year householder moved into unit - Moved in 1999 to March 2000 (%)
Year householder moved into unit - Moved in 1999 to March 2000 (%) - White
Year householder moved into unit - Moved in 1999 to March 2000 (%) - Black or African American
Year householder moved into unit - Moved in 1999 to March 2000 (%) - Asian
Year householder moved into unit - Moved in 1999 to March 2000 (%) - Hispanic or Latino
Year householder moved into unit - Moved in 1999 to March 2000 (%) - American Indian and Alaska Native
Year householder moved into unit - Moved in 1999 to March 2000 (%) - Multirace
Year householder moved into unit - Moved in 1999 to March 2000 (%) - Other Race
Year householder moved into unit - Moved in 1995 to 1998 (%)
Year householder moved into unit - Moved in 1995 to 1998 (%) - White
Year householder moved into unit - Moved in 1995 to 1998 (%) - Black or African American
Year householder moved into unit - Moved in 1995 to 1998 (%) - Asian
Year householder moved into unit - Moved in 1995 to 1998 (%) - Hispanic or Latino
Year householder moved into unit - Moved in 1995 to 1998 (%) - American Indian and Alaska Native
Year householder moved into unit - Moved in 1995 to 1998 (%) - Multirace
Year householder moved into unit - Moved in 1995 to 1998 (%) - Other Race
Year householder moved into unit - Moved in 1990 to 1994 (%)
Year householder moved into unit - Moved in 1990 to 1994 (%) - White
Year householder moved into unit - Moved in 1990 to 1994 (%) - Black or African American
Year householder moved into unit - Moved in 1990 to 1994 (%) - Asian
Year householder moved into unit - Moved in 1990 to 1994 (%) - Hispanic or Latino
Year householder moved into unit - Moved in 1990 to 1994 (%) - American Indian and Alaska Native
Year householder moved into unit - Moved in 1990 to 1994 (%) - Multirace
Year householder moved into unit - Moved in 1990 to 1994 (%) - Other Race
Year householder moved into unit - Moved in 1980 to 1989 (%)
Year householder moved into unit - Moved in 1980 to 1989 (%) - White
Year householder moved into unit - Moved in 1980 to 1989 (%) - Black or African American
Year householder moved into unit - Moved in 1980 to 1989 (%) - Asian
Year householder moved into unit - Moved in 1980 to 1989 (%) - Hispanic or Latino
Year householder moved into unit - Moved in 1980 to 1989 (%) - American Indian and Alaska Native
Year householder moved into unit - Moved in 1980 to 1989 (%) - Multirace
Year householder moved into unit - Moved in 1980 to 1989 (%) - Other Race
Year householder moved into unit - Moved in 1970 to 1979 (%)
Year householder moved into unit - Moved in 1970 to 1979 (%) - White
Year householder moved into unit - Moved in 1970 to 1979 (%) - Black or African American
Year householder moved into unit - Moved in 1970 to 1979 (%) - Asian
Year householder moved into unit - Moved in 1970 to 1979 (%) - Hispanic or Latino
Year householder moved into unit - Moved in 1970 to 1979 (%) - American Indian and Alaska Native
Year householder moved into unit - Moved in 1970 to 1979 (%) - Multirace
Year householder moved into unit - Moved in 1970 to 1979 (%) - Other Race
Year householder moved into unit - Moved in 1969 or earlier (%)
Year householder moved into unit - Moved in 1969 or earlier (%) - White
Year householder moved into unit - Moved in 1969 or earlier (%) - Black or African American
Year householder moved into unit - Moved in 1969 or earlier (%) - Asian
Year householder moved into unit - Moved in 1969 or earlier (%) - Hispanic or Latino
Year householder moved into unit - Moved in 1969 or earlier (%) - American Indian and Alaska Native
Year householder moved into unit - Moved in 1969 or earlier (%) - Multirace
Year householder moved into unit - Moved in 1969 or earlier (%) - Other Race
Housing units lacking complete plumbing facilities (%)
Housing units lacking complete kitchen facilities (%)
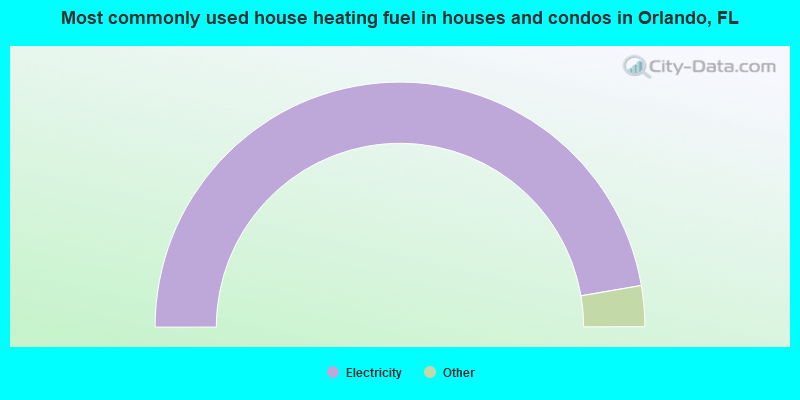
House heating fuel used in houses and condos - Utility gas (%)
House heating fuel used in houses and condos - Bottled, tank, or LP gas (%)
House heating fuel used in houses and condos - Electricity (%)
House heating fuel used in houses and condos - Fuel oil, kerosene, etc. (%)
House heating fuel used in houses and condos - Coal or coke (%)
House heating fuel used in houses and condos - Wood (%)
House heating fuel used in houses and condos - Solar energy (%)
House heating fuel used in houses and condos - Other fuel (%)
House heating fuel used in houses and condos - No fuel used (%)
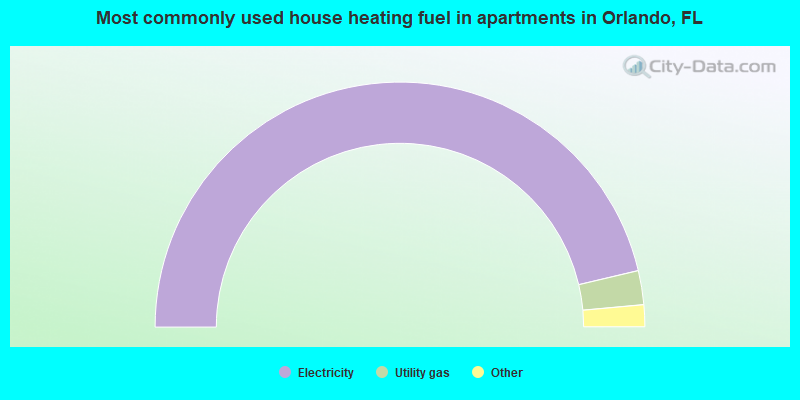
House heating fuel used in apartments - Utility gas (%)
House heating fuel used in apartments - Bottled, tank, or LP gas (%)
House heating fuel used in apartments - Electricity (%)
House heating fuel used in apartments - Fuel oil, kerosene, etc. (%)
House heating fuel used in apartments - Coal or coke (%)
House heating fuel used in apartments - Wood (%)
House heating fuel used in apartments - Solar energy (%)
House heating fuel used in apartments - Other fuel (%)
House heating fuel used in apartments - No fuel used (%)
Latest news about housing in Orlando, FL collected exclusively by city-data.com from local newspapers, TV, and radio stations
Median year house/condo built: 1990Median year apartment built: 1996Household type by relationship:
Households: 316,086
Male householders: 69,231 (22,047 living alone ), Female householders: 67,133 (21,817 living alone )47,530 spouses (45,817 opposite-sex spouses ), 14,018 unmarried partners , (13,251 opposite-sex unmarried partners ), 75,186 children (72,009 natural , 663 adopted , 2,514 stepchildren ), 5,255 grandchildren , 5,988 brothers or sisters , 4,691 parents , 619 foster children , 9,803 other relatives , 13,070 non-relatives In group quarters: 3,562
Size of family households: 31,364 2-persons , 20,386 3-persons , 15,397 4-persons , 5,511 5-persons , 1,261 6-persons , 1,399 7-or-more-persons .
Size of nonfamily households: 43,864 1-person , 14,491 2-persons , 2,107 3-persons , 261 4-persons , 128 5-persons , 195 6-persons .
30,306 married couples with children. single-parent households (3,529 men , 18,335 women ).
60.9% of residents of Orlando speak English at home. of residents speak Spanish at home (55% speak English very well , 22% speak English well , 14% speak English not well , 9% don't speak English at all ).of residents speak other Indo-European language at home (57% speak English very well , 22% speak English well , 17% speak English not well , 5% don't speak English at all ).of residents speak Asian or Pacific Island language at home (49% speak English very well , 28% speak English well , 21% speak English not well , 2% don't speak English at all ).of residents speak other language at home (76% speak English very well , 22% speak English well , 2% don't speak English at all ).
Foreign born population: 74,569 (23.6%)of them are naturalized citizens )
Median number of rooms in houses and condos:
Median number of rooms in apartments
Owner-occupied Renter-occupied
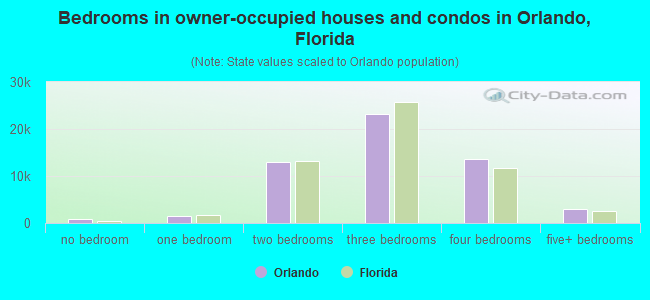
Bedrooms in owner-occupied houses and condos in Orlando, Florida
808 no bedroom 1,508 1 bedroom 12,991 2 bedrooms 23,230 3 bedrooms 13,595 4 bedrooms 2,965 5+ bedrooms
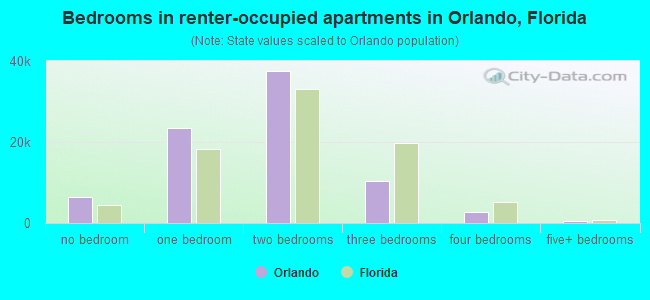
Bedrooms in renter-occupied apartments in Orlando, Florida
6,448 no bedroom 23,526 1 bedroom 37,582 2 bedrooms 10,379 3 bedrooms 2,748 4 bedrooms 584 5+ bedrooms
Owner-occupied Renter-occupied
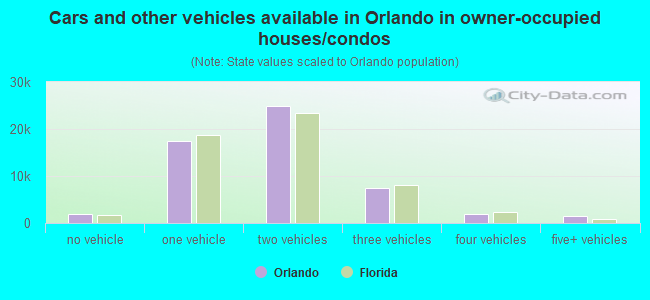
Cars and other vehicles available in Orlando in owner-occupied houses/condos
1,939 no vehicle 17,411 1 vehicle 24,968 2 vehicles 7,346 3 vehicles 1,847 4 vehicles 1,586 5+ vehicles
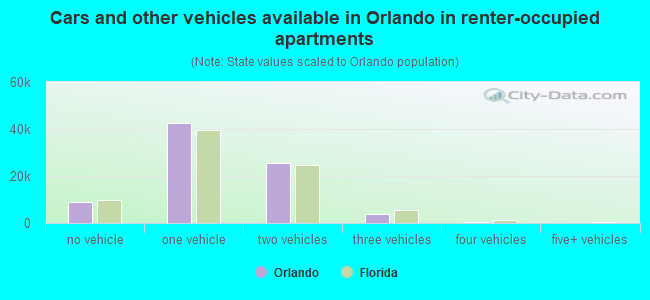
Cars and other vehicles available in Orlando in renter-occupied apartments
9,057 no vehicle 42,406 1 vehicle 25,431 2 vehicles 3,723 3 vehicles 519 4 vehicles 131 5+ vehicles
Owner-occupied Renter-occupied
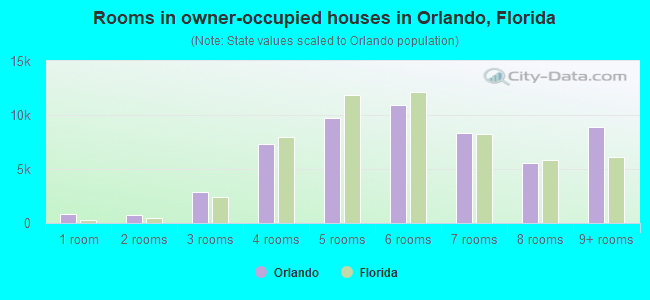
Rooms in owner-occupied houses in Orlando, Florida
808 1 room 705 2 rooms 2,845 3 rooms 7,332 4 rooms 9,709 5 rooms 10,907 6 rooms 8,311 7 rooms 5,599 8 rooms 8,881 9+ rooms
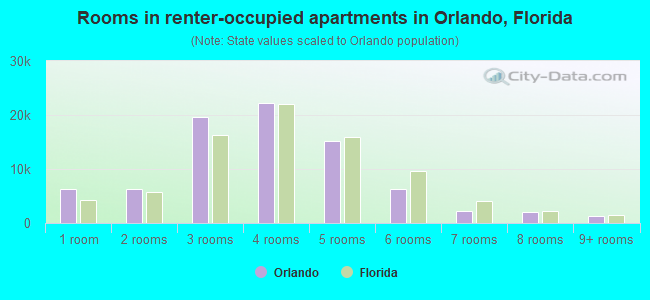
Rooms in renter-occupied apartments in Orlando, Florida
6,216 1 room 6,281 2 rooms 19,618 3 rooms 22,226 4 rooms 15,151 5 rooms 6,316 6 rooms 2,230 7 rooms 1,981 8 rooms 1,248 9+ rooms
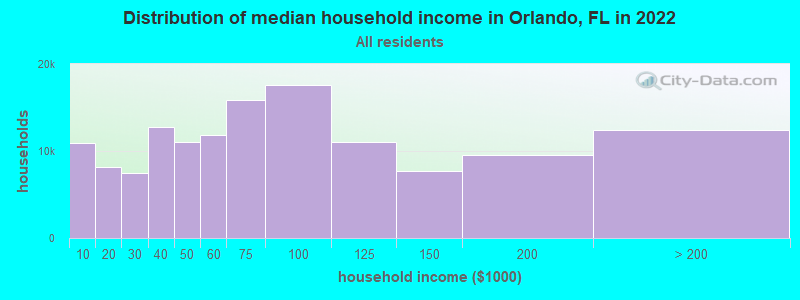
Orlando, FL household income distribution 10,918 Less than $10,0008,155 $10,000 to $19,9997,457 $20,000 to $29,99912,763 $30,000 to $39,99910,986 $40,000 to $49,99911,851 $50,000 to $59,99915,911 $60,000 to $74,99917,583 $75,000 to $99,99911,064 $100,000 to $124,9997,673 $125,000 to $149,9999,592 $150,000 to $199,99912,411 $200,000 or more
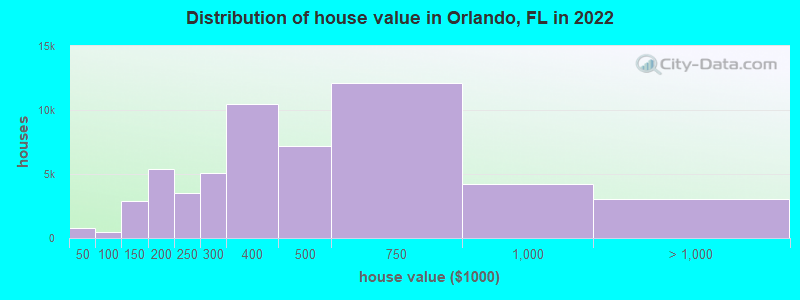
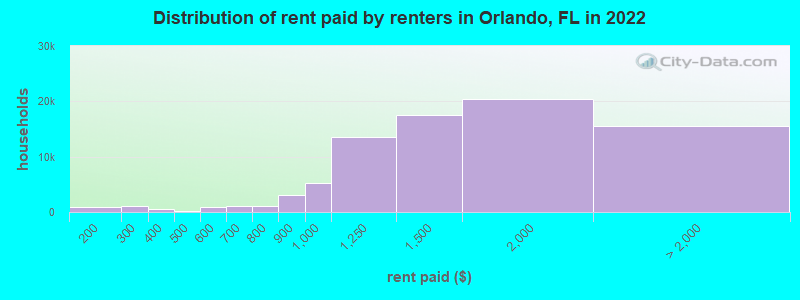
Home value of owner - occupied houses in 2022 in Orlando, FL 113 Less than $10,000235 $10,000 to $14,99973 $20,000 to $24,999364 $25,000 to $29,99962 $60,000 to $69,99914 $70,000 to $79,999226 $80,000 to $89,999128 $90,000 to $99,9991,548 $100,000 to $124,9991,336 $125,000 to $149,9992,349 $150,000 to $174,9993,024 $175,000 to $199,9993,553 $200,000 to $249,9995,080 $250,000 to $299,99910,500 $300,000 to $399,9997,179 $400,000 to $499,99912,102 $500,000 to $749,9994,198 $750,000 to $999,9992,538 $1,000,000 to $1,499,999260 $1,500,000 to $1,999,999215 $2,000,000 or moreRent paid by renters in 2022 in Orlando, FL 592 $100 to $149326 $150 to $199869 $200 to $249232 $250 to $299446 $300 to $349171 $350 to $399176 $400 to $449245 $500 to $549623 $550 to $599386 $600 to $649699 $650 to $699560 $700 to $749554 $750 to $7992,991 $800 to $8995,287 $900 to $99913,562 $1,000 to $1,24917,555 $1,250 to $1,49920,363 $1,500 to $1,99910,638 $2,000 to $2,4992,574 $2,500 to $2,999278 $3,000 to $3,499884 $3,500 or more1,256 No cash rent
Percentage of workers working in this county: 89.2%Number of people working at home: 30,245 (17.2% of all workers )
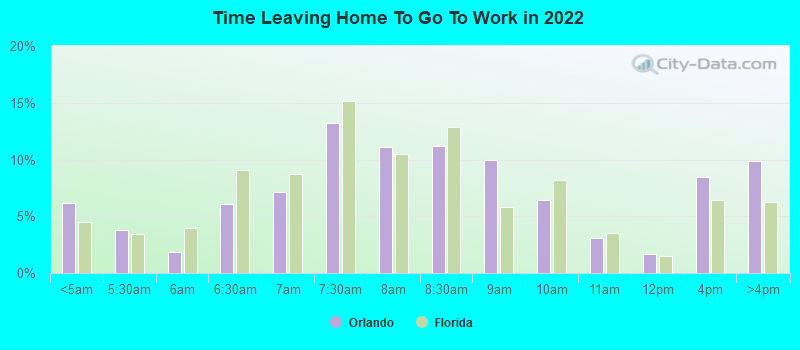
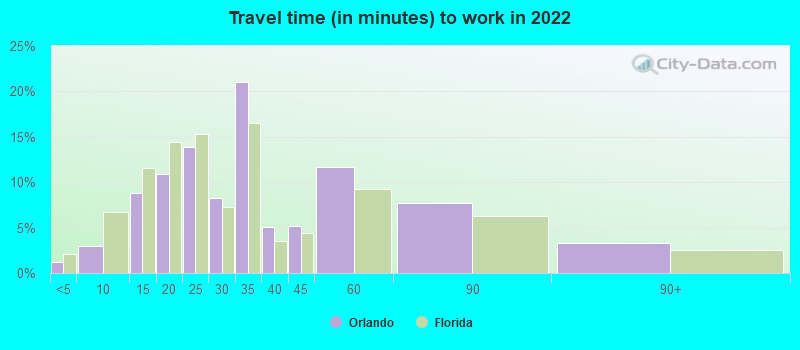
Travel time to work (commute)
Less than 5 minutes: 2,9705 to 9 minutes: 8,94610 to 14 minutes: 18,23515 to 19 minutes: 22,93520 to 24 minutes: 22,18425 to 29 minutes: 17,10030 to 34 minutes: 28,41435 to 39 minutes: 4,55740 to 44 minutes: 4,11445 to 59 minutes: 6,30360 to 89 minutes: 5,47290 or more minutes: 4,082
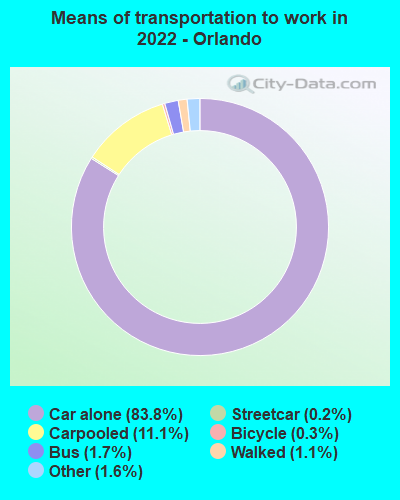
Means of transportation to work:
Drove a car alone: 299,767 (77.3%)Carpooled: 39,874 (10.3%)Bus : 6,016 (1.6%)Subway or elevated rail : 856 (0.2%)Long-distance train or commuter rail : 259 (0.1%)Light rail, streetcar or trolley : 216 (0.1%)Taxi: 5,786 (1.5%)Bicycle: 984 (0.3%)Walked: 4,016 (1.0%)Worked at home: 30,245 (7.8%)
Unemployment by race in 2022
Unemployment rate for White non-Hispanic residents 1.5% Males6.3% FemalesUnemployment rate for Black residents 6.1% Males7.7% FemalesUnemployment rate for American Indian and Alaska Native residents 17.1% MalesUnemployment rate for Asian residents 1.0% Males0.6% FemalesUnemployment rate for other race residents 0.7% Males3.7% FemalesUnemployment rate for two or more race residents 4.3% Males3.7% FemalesUnemployment rate for Hispanic or Latino residents 2.4% Males3.6% Females
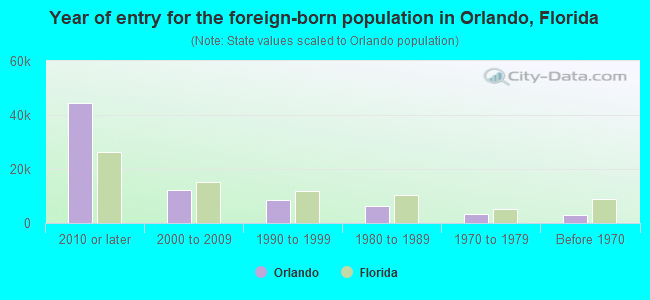
Year of entry for the foreign-born population in Orlando, Florida
44,573 2010 or later 12,152 2000 to 2009 8,659 1990 to 1999 6,353 1980 to 1989 3,395 1970 to 1979 3,095 Before 1970
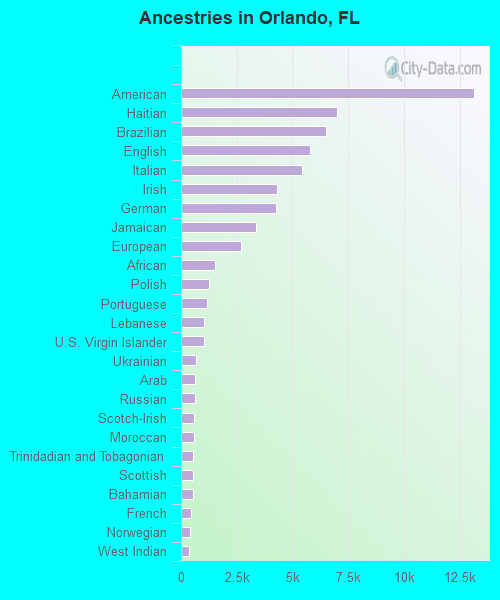
First ancestries reported:
American: 13,159 (7.5%)
Haitian: 6,987 (4.0%)
Brazilian: 6,512 (3.7%)
English: 5,774 (3.3%)
Italian: 5,442 (3.1%)
Irish: 4,296 (2.4%)
German: 4,277 (2.4%)
Jamaican: 3,367 (1.9%)
European: 2,703 (1.5%)
African: 1,511 (0.9%)
Polish: 1,249 (0.7%)
Portuguese: 1,147 (0.7%)
Lebanese: 1,053 (0.6%)
U.S. Virgin Islander: 1,014 (0.6%)
Ukrainian: 683 (0.4%)
Arab: 619 (0.4%)
Russian: 613 (0.3%)
Scotch-Irish: 599 (0.3%)
Moroccan: 597 (0.3%)
Trinidadian and Tobagonian: 559 (0.3%)
Scottish: 543 (0.3%)
Bahamian: 525 (0.3%)
French: 442 (0.3%)
Norwegian: 383 (0.2%)
West Indian: 378 (0.2%)
Scandinavian: 363 (0.2%)
Ghanaian: 320 (0.2%)
British: 313 (0.2%)
Canadian: 310 (0.2%)
Swedish: 308 (0.2%)
Icelander: 303 (0.2%)
British West Indian: 282 (0.2%)
Syrian: 272 (0.2%)
Northern European: 271 (0.2%)
Jordanian: 254 (0.1%)
French Canadian: 230 (0.1%)
Israeli: 229 (0.1%)
Greek: 221 (0.1%)
Palestinian: 205 (0.1%)
Bulgarian: 204 (0.1%)
Eastern European: 186 (0.1%)
Slovak: 149 (0.08%)
Guyanese: 140 (0.08%)
Dutch: 134 (0.08%)
Danish: 130 (0.07%)
Welsh: 129 (0.07%)
Lithuanian: 128 (0.07%)
Hungarian: 126 (0.07%)
Iranian: 116 (0.07%)
Slovene: 100 (0.06%)
Nigerian: 88 (0.05%)
Austrian: 76 (0.04%)
Croatian: 73 (0.04%)
Turkish: 71 (0.04%)
Romanian: 68 (0.04%)
Cape Verdean: 63 (0.04%)
Pennsylvania German: 58 (0.03%)
Zimbabwean: 51 (0.03%)
Czech: 48 (0.03%)
Egyptian: 47 (0.03%)
Slavic: 45 (0.03%)
Yugoslavian: 40 (0.02%)
Finnish: 38 (0.02%)
South African: 37 (0.02%)
Barbadian: 33 (0.02%)
Serbian: 31 (0.02%)
Swiss: 30 (0.02%)
Kenyan: 29 (0.02%)
Armenian: 23 (0.01%)
Ethiopian: 17 (0.01%)
Albanian: 17 (0.01%)
Belizean: 16 (0.01%)
Cajun: 16 (0.01%)
New Zealander: 15 (0.01%)
Belgian: 14 (0.01%)
Czechoslovakian: 12 (0.01%)
Basque: 10 (0.01%)
Australian: 9 (0.01%)
Most common places of birth for foreign-born residents (%): Venezuela Orlando:
19.2% (13,992)Florida:
5.7% (262,042)
Brazil Orlando:
14.0% (10,203)Florida:
2.7% (122,906)
Haiti Orlando:
9.0% (6,576)Florida:
7.5% (342,375)
Colombia Orlando:
7.0% (5,093)Florida:
6.5% (298,669)
Dominican Republic Orlando:
6.4% (4,650)Florida:
3.0% (137,727)
Cuba Orlando:
5.1% (3,736)Florida:
22.0% (1,006,576)
Jamaica Orlando:
3.8% (2,744)Florida:
5.0% (227,319)
Mexico Orlando:
3.0% (2,166)Florida:
5.6% (257,152)
India Orlando:
2.9% (2,121)Florida:
2.1% (94,349)
Peru Orlando:
2.4% (1,754)Florida:
2.1% (96,693)
Philippines Orlando:
2.1% (1,511)Florida:
1.8% (84,403)
Place of birth for U.S.-born residents:
This state: 110,262Other state: 104,528Northeast: 46,005Midwest: 22,231South: 28,191West: 8,101 79.3% of Orlando residents lived in the same house 1 years ago.
Out of people who lived in different houses, 35.4% lived in this county.
Out of people who lived in different counties, 57.6% lived in Florida.
Orlando:
79.3%State average:
86.3%
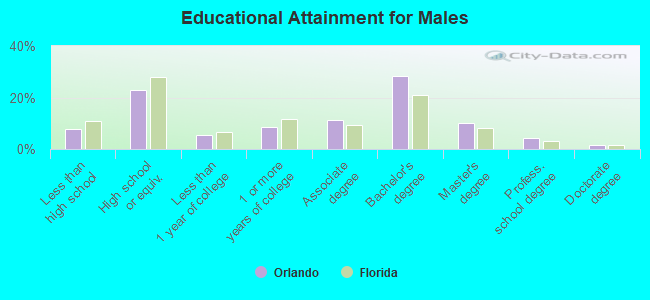
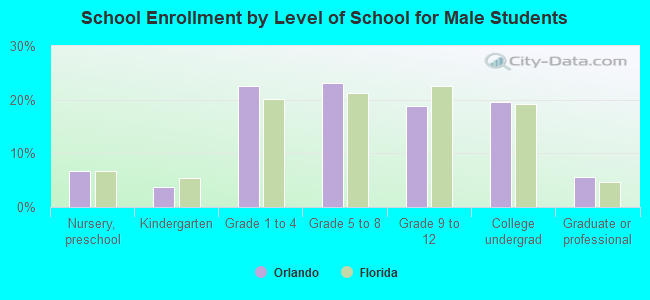
Education attainment for males 25 years and older:
No schooling: 2,126Nursery to 4th grade: 8015th and 6th grade: 5887th and 8th grade: 8459th grade: 55710th grade: 92011th grade: 63612th grade, no diploma: 1,911High school graduate (or equivalency): 24,879Less than 1 year of college: 5,724Some college more than 1 year, no degree: 9,463Associate degree: 12,312Bachelor's degree: 30,845Master's degree: 11,069Professional school degree: 4,464Doctorate degree: 1,752
Education attainment for females 25 years and older:
No schooling: 2,188Nursery to 4th grade: 4615th and 6th grade: 1,3097th and 8th grade: 1,3309th grade: 38710th grade: 1,50511th grade: 2,26112th grade, no diploma: 2,873High school graduate (or equivalency): 26,050Less than 1 year of college: 4,572Some college more than 1 year, no degree: 10,300Associate degree: 9,965Bachelor's degree: 33,889Master's degree: 13,208Professional school degree: 4,183Doctorate degree: 1,833
Housing units in structures:
One, detached: 48,130One, attached: 11,731Two: 4,4253 or 4: 8,6625 to 9: 12,07910 to 19: 25,23320 to 49: 15,62650 or more: 21,099Mobile homes: 280Boats, RVs, vans, etc.: 87Housing units lacking complete plumbing facilities in 2022: 0.4%Housing units lacking complete kitchen facilities in 2022: 1.0%House/condo owner moved in on average 7 years ago
Renter moved in on average 2 years ago
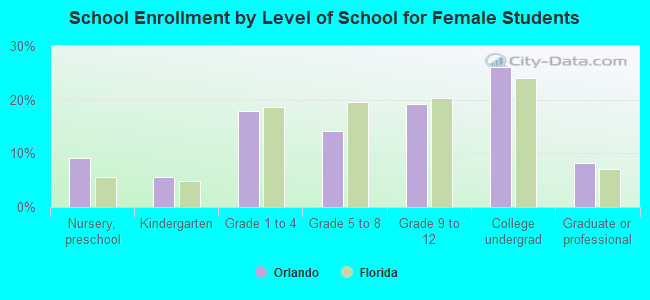
Private vs. public school enrollment:
Students in private schools in grades 1 to 8 (elementary and middle school): 3,306 Students in private schools in grades 9 to 12 (high school): 2,021 Students in private undergraduate colleges: 2,781